DNA Sequence Reading
by
Image Processing
A
thesis
presented in partial fulfilment of the requirements
for the degree of
Master of Science
in Computer Science at
Massey University
Supervised by
Dr Donald Bailey
and
Dr John Hudson
Fan Baozhen
To my mother, father
Abstract
The research described in this thesis is the development of the DNA sequence reading system.
Macromolecular sequences of DNA are the encoded form of the genetic information of all living organisms. DNA sequencing has therefore played a significant role in the elucidation of biological systems. DNA sequence reading is a part of DNA sequencing. This project is for reading DNA sequences directly from DNA sequencing gel autoradiographs within a general purpose image processing system.
The DNA sequence reading software is developed based on the waterfall software development approach combined with exploratory programming. Requirement analysis, software design, detailed design, implementation, system testing and maintenance are the basic development stages. The feedback from implementation and system testing to detailed design is much stronger in image processing than a lot of other software development.
Abstract iv
bands. Each of the lane set represents one part of a DNA sequence. The lane sets are separated automatically into subimages to be read individually. The gap lines between the lane sets are detected for separation. The geometric distortions are corrected by finding the boundaries of the lane set in the subimage. The left boundary of the lane set is used to straighten lane set and the right boundary is used to warp the lane set into a standard width. If separation of the lane sets or geometry correction is unsuccessful by automatical processing, manual selection is used. After the band features are enhanced, the individual
bands are extracted and the positions of the bands are determined. The band positions are then converted into the order of the DNA sequence. Different part of a sequence from subsequences are merged into a longer sequence.
In most of the cases, the individual lane sets in a captured image are able to be separated automatically. Manual processing is necessary to handle the cases where the lane sets are too close.
Preface
As I complete my study for my master's degree, I want to call to mind my mother and father and sisters, and my whole family who have encouraged and supported me so much over the past years. I am very grateful to my family, who have helped me to persist in my studies when I often felt too old to continue. I feel very relieved and thankful that after so many years of what seems like wasted time and many struggles I have now completed my work.
When I was a small girl I loved studying very much, and was inspired by my parents, and by my sisters. However, circumstances were very difficult from my youth onwards, as a result of the environment at that time.
Pre ace vi
successful and the champion for the whole of China. After middle school, she too went to university. I am the fourth in the family, and I was admitted to one of the best middle
schools in Qingdao city after taking the entrance examinations.
My sisters set a fine example for me, inspiring me subconsciously to go on from school to university, and then after my undergraduate study to undertake postgraduate research, and then do research or teach in a university. It all seemed so straight-forward. But the Cultural Revolution in China commenced just as I was completing my three years of
study at middle school. So overnight the dream of studying in university evaporated. High school study is for a period of three years between middle school and tertiary study in China, and I felt sure I could go there. However, because my father had once been a capitalist I was not permitted to attend, even though my school marks were always excellent. When I discovered that I would not be permitted to study in high school I was broken-hearted. In my dreams I would imagine that I was at school, and when I woke up, I would cry because I would never be allowed to take a seat in the lecture theatre.
Later, I went to the countryside and worked in a factory. All the "golden time" of my youth had come to nothing. It was ten years later when once again people were admitted to university by sitting the entrance examinations. However, I had attended no classes at
high school level, while others had attended for three years. My sisters encouraged me to take the entrance exams anyway, and with their help and my own study I got very good marks much to my surprise. Even then I encountered prejudices against admitting me to university, and I almost missed out on gaining entrance. But I was stubborn, and I clung onto the gleam of hope and refused to succumb to the opposition. So finally I entered my university career, ten years late. My university study in China was the essential preparation to overseas study.
New Zealand is the first foreign country I have ever visited. As a mature student, I found study overseas much more difficult than for others in the same course. Language is one problem, but I have also experienced a serious ailment in my back, and although I do not look ill, I have constantly had to struggle with it. Nobody else has any idea just how acute this little problem has been. I spent a great deal of time trying to control the pain, so
that I could concentrate better on my work. The suffering reduced my ability to work and to live, and this made me lose confidence. The worry and distress made my condition worse, and several times I almost abandoned my study. Yet my family's desire that I
Pre ace vii
God has taken care of me. Just before completing my MSc I again almost lost confidence about my future direction. Just at this point the pain in my back began to reduce. So the hope of what lies in the future has returned to me. The desire to climb forward and upward has returned to my heart. I am still my stubborn self, and I will not give up on my aspirations.
During the difficult experiences of my life, I have always had the complete support of my whole family to get me over dangers and difficulties. My mother has always been my guide through life. Whenever difficulty or danger has come near, I have always remembered when I was a child lying in my cradle. She would pick me up and place me securely in her arms. In a way this is what she still does when I am in difficulties. She has always protected and helped her children and encouraged them to go forward and upward. I wish my mother good health, much happiness and long life.
During the two years when I was working on my masters in New Zealand, two members of my family have died, my honoured father and my third sister Guie. They were so far away across the oceans that they could not farewell me before they went to heaven. The pictures of two roses in the Introduction of my thesis are a special tribute to my father and my sister Guie.
When I left home to come to New Zealand, my father wept. He had a premonition that he would never see his youngest daughter again. But I do not believe that my father and sister Guie have left the world. I dreamed about my father last night. I know from this that my father is still alive. So I have a good reason to do what my family want and what they hope for me. I can feel that God is with me, and peace and happiness are present with me, for that is what my sister Guie prayed for and wished as blessing for me in her will. So I want my father, my sister Guie and all my family to smile upon me as I live here.
My all family, my parents, my sisters, my brother-inlaws, my nieces and my nephews, have encouraged and supported me over the past years when I study in NZ. Many thanks to everyone in my family.
Many thanks to my supervisor Dr Donald Bailey, for his valuable guidance throughout this project, for his helping me to learn image analysis techniques, for his patience in trying to understand my Chinese way of thinking and talking, especially when checking my thesis and conference papers, for his encouragement and support when I felt like giving up since my father and sister died.
I would like to thank Dr Nick Ellison for providing invaluable technical information on DNA sequencing and for the provision of the autoradiographs used to develop the software.
CONTENTS
Abstract
...
.
...
..
.
..
.
...
..
.
.
...
.
...
...
...
.
...
iiiPreface ....
.
...
...
..
.
.
...
..
.
...
...
...
.
....
...
...
..
..
...
...
...
uAcknowledgments
...
...
...
.
..
...
..
....
..
..
...
...
...
.
.
...
...
.... .
iixChapter 1 Introduction
..
..
....
..
...
..
..
...
...
....
..
...
1Chapter 2 Image Processing and
VIPS ...
42 . 1 Image processing ... 5
2. 2 Vision Image Processing System (VIPS) ... 10
Chapter
3
DNA Sequence Reading Software Development ...
133.1 DNA sequencing ... 14
3. 2 An Image processing software development approach ... 16
3.3 Requirement analysis ... 17
3. 4 Software design ... 18
3 . 5 Detailed design and implementation ... 20
3 . 6 System testing and maintenance ... 25
Chapter 4 Image processing module
Algorithms
...
...
.
274. 1 Image acquisition ... 27
4. 2 Contrast enhancement ... 33
4. 3 Gap line detection ... 37
4. 4 Subimage separation ... .41
4 . 5 Boundary extraction ... 42
4. 6 Geometry warping ... .47
4. 7 Band extraction ... 53
4 . 8 Band scanning ... 56
Chapter 5 Results
...
...
..
....
...
...
...
...
625 .1 Subimage separation and geometry warping ... 63
5 . 2 Accuracy ... 65
5 . 3 Timing ... 70
Chapter 6 Summary
and Conclusions
...
....
...
.
...
.
.
.
...
.
71References
..
.
...
.
...
.
..
.
...
.
...
.
...
.
..
.
.
..
.
.
...
..
...
...
.
...
.
74Appendix
I:Expressions
of
VIPS
Commands
..
..
.
..
...
...
...
76Appendix II:
VIPS
Programs for DNA Sequence Reading
....
..
79Chapter 1
Introduction
Digital image processing has been a rapidly evolving field during the last 30 years with
a growing range of applications in a broad spectrum of science and engineering
disciplines [Jain, 1989]. This growth is coupled with improvements in the processing
speed, image display and storage capabilities of computers and cost effectiveness of the related signal processing devices and computers [Pratt, 1978]. Image processing is a
broad subject of interdisciplinary study and research in such diverse fields as computer and information science, statistics, physics, astronomy, chemistry, biology, psychology, medicine, geology, engineering and so on [Bailey, 1985].
DNA sequence reading is one application of image processing in fundamental genetic
and cellular analysis. Genetic and cellular analysis is an important part of biological,
agricultural and medical research [Bodmer, 1987]. The goal of this project is to incorporate automatic DNA sequence reading capability from a gel autoradiograph
within a general purpose image processing system.
The genetic information of a living organism is encoded by the DNA contained within
Chapter I Introduction 2
the DNA sequence can be read from the gel autoradiograph. A DNA sequence reading
system is developed for reading sequences directly from DNA sequencing gel autoradiographs by image processing techniques. A number of subsequences in an
image are captured from a gel autoradiograph. Each subsequence must be read separately. Most of the subsequences may be separated automatically. If necessary, manual processing may be used to separate the subsequences. The subsequence boundaries are extracted and are used to correct for geometric distortions. Individual bands are extracted and the band positions are detected. The order of the DNA sequence is then determined from the sequence of band positions. Different parts of a sequence from different subimages are merged into a longer sequence. The algorithms of the DNA sequence reading system are developed and implemented using VIPS (Vision Image Processing System), version 4.1, which currently runs on an PC under Windows, an Apple Macintosh and a DEC Micro VAX.
Chapter 2 includes a brief survey of image processing and introduces the Vision Image
Processing System (VIPS). Some of the image processing concepts are explained which are used in the following chapters on ON A sequence reading software development. These are image acquisition, feature enhancement, linear convolutional filters, intensity histograms, image segmentation, thresholding and line profiles. VIPS
is used as the software development and implementation environment for this project. The hardware components required by VIPS and software features of VIPS are described.
In chapter 3, the DNA sequencing application is described more fully and an image processing software development model, based on the waterfall software development
approach combined with exploratory programming, is presented. Each stage of the model (requirement analysis, software design, detailed design and implementation, system testing and maintenance) is described as it relates to DNA sequence reading system development. A general model for image processing and the final system function module structure are given in section 3.4. The control module algorithms of DNA sequence reading system are described in section 3.5.
Chapter 4 describes the algorithms for the image processing module of the DNA sequence reading system in detail. An image must be acquired from a DNA sequence gel autoradiograph. Contrast enhancement increases the faint bands in the DNA sequence images. Several subsequences may be in the same captured image and each subsequence must be read separately. The gap lines between subsequences are detected, which are used to obtain separate subimages for each subsequence. Geometric
Chapter I Introduction 3 the gel autoradiographs, geometry correction is necessary. The subsequence boundaries
are extracted and are used to correct for geometric distortions. The left boundary is
used to shear the image to straighten left side and the right boundary is used to
trapezoid warp the right side. The individual bands are extracted and the positions of
the bands are then detected. The band positions are sorted into a list and then converted
into a DNA sequence. Different parts of a sequence are merged into a longer sequence.
Chapter 5 discusses the results of the DNA sequence reading system. Automatic
separation of lane sets and geometry warping are successful on most of the images
captured. If the boundaries of a band lane set are not clear, manual selection of the lane
set and manual geometry correction are used. The accuracy of the system depends on
the clarity of the bands on the gel autoradiograph. If the bands are clear, the accuracy
of automatic processing may reach 98%. The output is checked and any errors may be
corrected manually to obtain an acceptable accuracy. Timing is carried out on a 33MHz
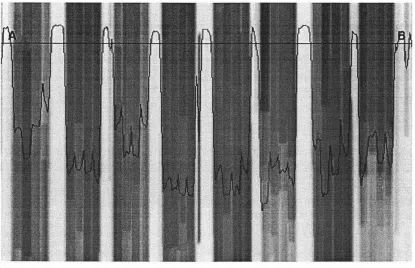
486 PC. Automatically processing a 430 x 350 mm autoradiograph with 16 lane sets
(see Figure 3.1-1) takes about 40 minutes.
Chapter 6 summarises the system and the thesis and gives suggestions for future work.
The mathematical expression of the VIPS operations used in this thesis are summarised
in Appendix I. Appendix II gives VIPS programs for the DNA sequence reading
system. Several new VIPS commands were developed for DNA sequence reading:
STRAIGHTEN, PARALL, SEQUENCE, POINTS, SORT and JOIN. The C programs for these commands are given in Appendix III.
During the research for the project the following papers were published:
Fan B., Bailey D.G. and Hudson J., Image processing in DNA Sequence Reading, 7th
NZ Image Processing Workshop, pp 117-122, Christchuch NZ, (8, 1992).
Fan B. and Bailey D.G.,Algorithms for DNA Sequence Reading by Image Processing,
NZ Computer Science Research Students' Conference, pp 109-116, Hamilton NZ,
(10, 1992).
Fan B. and Bailey D.G., Algorithms for DNA Sequence Reading by Image Processing,
NZ Journal of Computing, pp 47-56, Palmerston North NZ, (5, 1993).
Fan B. and Bailey D.G., Preprocessing Algorithms for Automatic DNA Sequence
Chapter2
Image processing
and VIPS
Visual imagery is one of the most important sensory inputs to the human perceptual
system [Kasturi and Trivedi, 1990]. However, many of the activities which need to be
done in modern science are repetitive and mundane, so people have attempted to
automate such activities. Since vision is so important, we have also attempted to
automate vision. Many theoretical and technological breakthroughs are required before
we could emulate the visual functions of human beings [Jain, 1989].
Image processing, as a technology, is a step toward automating visual tasks. Image
processing and analysis are used primarily to augment human vision and to extract
numerical information from images by applying series of mathematical operations. In
practical image processing, there are two principal application areas. The first is the improvement of pictorial information for human interpretation. This is also called
computer assisted vision and is primarily used to augment human vision and to extract
information from images. The second is the processing of scene data for autonomous
machine perception, mainly for inspection and manipulation, which is known as
Clwpter 2 Image processing and VIPS 5
The DNA sequence reading system described in this thesis is an application of
computer assisted vision. In section 2.1, some concepts and terminology of image
processing techniques used in the following chapters are explained.
Vision Image Processing System (VIPS) is a tool for investigating the applicability and
practicability of image processing techniques to industrial and scientific problems.
VIPS is used as the software development environment for developing the DNA
sequence reading system. The hardware required and the software features of VIPS are
described in section 2.2.
2.1 Image Processing
Some concepts and terminology of image processing techniques, which will be used in
the following chapters, are explained in this section. These are image acquisition,
feature enhancement, linear convolutional filters, intensity histograms, image
segmentation, thresholding and line profiles.
Image acquisition. Images can be acquired by a sensor system specially designed to
view a scene and provide a digital representation of that scene. The continuous two
dimensional intensity pattern is quantised, or sampled, both in position and in intensity
giving a digital image. The sampling rate is the number of pixels (J2._Kture elements )
per unit area. This must be larger than twice the maximum frequency to preserve the
useful information in an image without aliasing [Gongalez and Wintz, 1987].
We may consider a digital image as a two dimensional array f(x,y), whose row and
column indices identify a point in the image and the corresponding matrix element
identifies the grey level or colour at that point.
Feature enhancement. Image enhancement is one of the principal image processing
techniques. Images are processed to enhance or extract features which are important for
the particular application. Filters, multiple image combination and histogram
modification are used for enhancement.
A spatial domain filter calculates the value of each pixel of the output image as some
function of the values corresponding pixel and its neighbours in the input image.
Different functions enhance or detect different features. This neighbourhood can be
thought of as a moving window, where the window is moved from pixel to pixel as
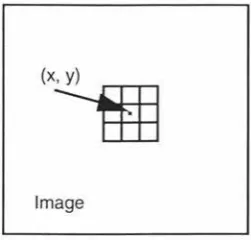
each output value is calculated. Figure 2.1-1 illustrates a (3x3) moving window centred
Chap/er 2 Image processing and VIPS 6
(x, y)
~
[image:15.563.240.366.95.215.2]Image
Figure 2.1-1 A 3x3 moving window centred at (x, y) in an image.
The general moving window filter with an mxn window can be represented
mathematically as
PouJx,y)=f(p;Jx+i,y+ j),
\-I' v l E { - T,m ··,T ,] m} · E { - 2,··,2 n n })
(Eq. 2.1-1)
where Pour is the output image,
f( )
is the filter function which is evaluated at eachposition of the window in the image, P;n is the input image [Bailey, 1993].
Figure 2.1-2 gives an example of edge enhancement. The (a) is the original image, (b)
is an edge detected image using a Sobel filter.
a) b)
Figure 2.1-2 Edge enhancement
a) original image, b) edge detection by Sobel filter.
Chap/er 2 Image processing and VIPS
P"u1(x,y)=-\-
±
Iw(i,j)P;,,(x+i,y+ j) sea e i=-'r J=-'J-7
(Eq. 2.1-2)
where w(i,j) are the fixed kernel weights corresponding to each position within the
moving window. The kernel weights are chosen to detect a particular property of
interest in an image. Figure 2.1-3 gives noise smoothing and different edge detection
filter kernel weights [Bailey et al, 1984].
¼[ :
:J
¼[~
iJ
r-1
0
:i
±[
~I 1]
0
½
-1 0 0-1 -I -1 0 I -2 -1
noise horizontal vertical diagonal
smoothing edge detection edge detection edge detection
Figure 2.1-3 Kernel weights of smoothing and detection.
Intensity histograms. The grey level histogram is a function which summarizes the grey level content of an image. The function shows, for each grey level, the number of
pixels in the image that have that grey level. The abscissa is grey level and the ordinate
is frequency of occurrence (number of pixels) [Castleman, 1979]. Intensity histograms
may be used to enhance images. Figure 2.1-4 gives a histogram of an image. Figure
2.1-5 gives a contrast enhanced image and the histogram, which expanded the range of
grey levels linearly .
Figure 2.1-4 An image and the intensity histogram.
Chapler 2 Image processing and VIPS 8
Figure 2.1-5 The contrast stretched image and the histogram.
Image segmentation. Image segmentation is the splitting of an image into its
meaningful constituent parts, or regions which have a common property [Gongalez and Wintz, 1987]. Edge detection, boundary tracking, thresholding and region growing are
the principal image segmentation approaches [Bailey, 1991]. Image thresholding is the most commonly used method of image segmentation. It splits an image into component
regions based on the pixel value at each point. Simple thresholding uses a single
threshold level. All pixels less than this threshold are categorised as belonging to one class, while those above the threshold are categorised as belonging to the second class.
Figure 2.1-6 gives an example of image segmentation using thresholding. The threshold level is selected by examining the histogram (see Figure 2.1-5) to segment
the background and the object. The threshold is chosen at 155 which is just to the left
of the main peak, separating the background and the object.
Figure 2.1-6 Image segmentation.
Figure 2.1-7 gives an example of edge detection by thresholding. These pixels with
level less than 30 are classified as not edge and set to white. The remaining pixels
Chapter 2 Image processing and VIPS 9
Figure 2.1-7 Image thresholding.
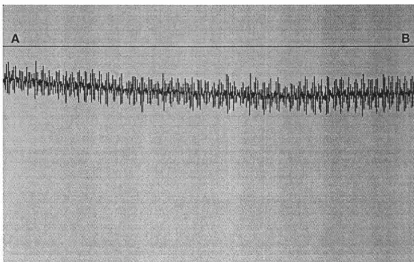
Line profile. The intensity line profile of a image is used to analyse the image features
at a defined line. Sharpness of edges, contrast, noise and thresholding range may be
determined by analysing the intensities along a line in an image. Figure 2.1-8 shows a
profile along the line of the image. The sharpness of edges can be seen from the slope
of the lines. The contrast of the image can be seen from the profile shape. The noise
can be seen clearly on flat part.
Figure 2.1-8 An image with line profile.
These image processing techniques, along with others, can be combined to form image
processing algorithms.
Vision Image Processing System (VIPS) is a tool for developing image processing
algorithms. The DNA sequence reading system is developed and implemented using
Chap/er 2 Image processing and VIPS 10
2.2 V
i
sion image processing system (VIPS)
VIPS is designed to support general-purpose image processing. It is a tool for
investigating the applicability and practicability of image processing techniques to
industrial and scientific problems. It runs on several different computing platforms,
MicroVAX, IBM compatible PC and Macintosh with a common command line
interface used on all. Sequences of VIPS command lines may be combined together
into program files. The main function of VIPS is to provide an environment for the
development of image processing algorithms. Therefore, the system is highly
interactive and has available hundreds of general purpose image processing operations
and functions. VIPS is written in portable C. New commands and new functions may
be developed and added to the system by users if necessary [Image Analysis Unit,
1992]. VIPS is developed by my supervisor, Dr. Donald G. Bailey, at the Image
Analysis Unit of Massey University.
VIPS hardware requirements. The required hardware components of VIPS are
similar even when VIPS is implemented on different computing platforms. Image
sensor, frame grabber, image display, computer and image processing software storage
are the indispensable components required for image processing. The components of
VIPS hardware required are shown in Figure 2.2-1.
Object
mage Sensor
Frame Grabber
Digitizer
Image
Display
Frame Display Buffer Generator
Network
8---'
Figure 2.2-1 Components of VIPS hardware required.
VIPS Software
Package
Chapter 2 Image processing and VIPS 11
An image sensor is required for image acquisition which converts an image into an
analog signal suitable for input into a frame grabber. The most common method for
capturing images is to use a solid state video camera.
The frame grabber provides the interface between the computer, and the camera and
display. A frame grabber typically involves three functional parts: a digitiser, a frame
buffer and a display generator. The analog signal produced by the camera is
transformed to a digital format. The digital image data are stored into the frame buffer,
where they can be read by the CPU in the computer. The function of the display
generator is to convert the stored digital information into an analog video signal, and
output this signal to a video monitor or image display, where the image can be viewed.
Image display is indispensable for checking the result images. A monochrome or
colour video monitor is used to display analog video signal images, or images are
displayed directly in another window on the computer terminal.
A general purpose computer provides versatility as well as ease of VIPS application
programming. Currently, a microVAX under VMS, an IBM compatible PC under
Windows or a Macintosh are used as platforms for VIPS and VIPS applications. At
least 2M bytes of RAM is required for data throughput on a general image processing
project. The memory requirements depend on the number of images required, which
depends on the intended application.
A printer is used to hard copy resultant images and output files if necessary.
Network may be used to get images to be processed from remote computers or to
convey results to remote computers.
Chapter 2 Image processing and VIPS 12
Figure 2.2-2 shows VIPS running on a PC with the hardware required.
VIPS software. VIPS software package is command based. Operations within VIPS
are invoked by entering commands in response to a prompt. The VIPS window on the
screen shows VIPS command lines, user prompt and text input and output. The VIPS
kernel part includes command parser, command table and variable table. Each
command and function code includes command definition and command procedure.
Display driver and utilities are also provided for use by commands. Figure 2.2-3 gives
the VIPS structure.
VIPS window on screen
Command lines user prompt
--input & outputVIPS kernel
Command table I
l
Command parser4
IVariable table
~
-Command code function code Command definition Command procedure
I
Figure 2.2-3 VIPS structure.
~ Display - driver
--
UtilitiesVIPS is written in portable C. Hundreds of VIPS commands are available. New
commands may be added by the user by providing a command definition and a
command procedure. New functions may be added as well.
The general VIPS command format is as below:
VIPS V4: COMMAND parameterl [parameter2 ... J [ /optionl ... J
In a VIPS application, command lines can be combined in a text file, as a program. As
an example, a rotate program is given below which captures a (5 l 2x5 l 2) image from
the display, then rotates the image and displays the rotated images repeatedly.
PROGRAM
DISPLAY image
FOR n = 1 4
ROTATE image
DISPLAY image
END END
!rotate. vip
Chapter3
DN4 ~equen
'
cin~g
i
Software Developmelt
DNA sequences are a representation of the genetic structure of DNA molecules. The
generation and analysis of DNA sequence data, DNA sequencing, has played a
significant role in the elucidation of biological systems. DNA sequence reading is a part of DNA sequencing, and provides a bridge between the generation and the analysis
of DNA sequence data.
DNA sequences may be read manually by trained technical staff. However, although
the reading process is straight forward, it is tedious, and therefore prone to errors. After
reading, the sequence must then be transcribed into a computer for entry into or
comparison with a sequence database. This transcription step is also error prone. The
very nature of the problem: being well defined and very repetitive makes it amenable to
image analysis techniques. Although several commercial packages are available for
DNA sequence reading, these are either limited in what they do (for example an
operator manually points to each band using a digital-pad) or expensive (for example.
laser sequence reading is part of the whole sequencing machine) and highly specialised
Chap/er 3 DNA Sequencing Software Development 14
automatic DNA sequence reading capability from a gel autoradiograph within a general
purpose image processing system.
In this chapter, the DNA sequencing process is described, an image processing
software development model is presented and each stage in the model is described with
processes of DNA sequence reading system development. A general model for image
processing and the final system function module structure are given in section 3.4. The
control flow diagrams of control modules in the DNA sequence reading system are
described in section 3.5.
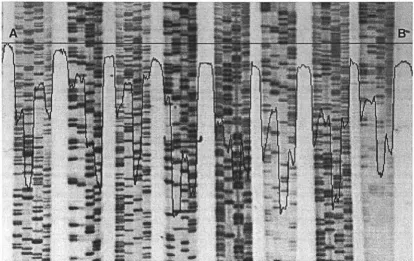
3.1 DNA sequencing
The genetic information of a living organism is encoded by the DNA contained within
every living cell of that organism. DNA itself consists of a chain of nucleotide residues
derived from the bases adenine, cytosine, guanine and thymine. Thus the genetic code
can be determined by reading the sequence of bases within the DNA, a process referred
to as DNA sequencing.
The current methodology of DNA sequencing has its origins in a variety of different
fields of nucleic acid enzymology and chemistry. DNA sequencing relies on the
incorporation of radiolabelled nucleotide residues into the DNA molecule to be
sequenced and the generation of populations of radiolabelled oligonucleotides that
begin from a fixed point and terminate randomly at a fixed residue within that DNA
molecule. The population of radiolabelled oligonucleotides is separated on the basis of
size by gel electrophoresis and the DNA sequence is determined by the examination of
an autoradiographic image of the separated oligonucleotides [Hindley, 1983).
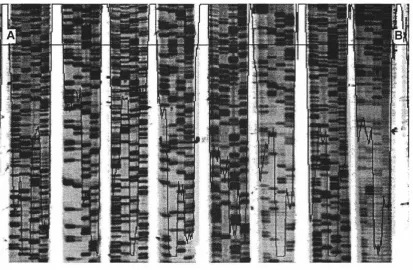
The DNA sequence itself is determined by reading the sequence of bands in the four
lanes on the autoradiograghic image of the sequencing gel starting at the bottom of the
gel and working up, where each lane represents one of the four bases, adenine (A),
cytosine (C), guanine(G) and thymine (T). The correct sequence is obtained by noting
the most intense band at each level, developing a feel for the spacing [Daivies,
1982].The sequence read from gel autoradiogragh either is used directly, or form the
input to a software package which obtains a consensus sequence from overlapping
sequences [Elder and Southern, 1987].
Automatic reading of DNA sequencing gel autoradiographs is the purpose of the
Chapter 3 DNA Sequencing Software Development 15
Figure 3.1-1 gives an example of DNA sequence gel autoradiograph.
Chapter 3 DNA Sequencing Software Development 16
3.2 An Image Processing Software Development approach
Image processing software development is inherently iterative. Since both hardware
and techniques are still limited, applying image processing to a particular application
relies strongly on checking intermediate results during the development process. The
standard waterfall model of software development [Sommerville, 1989] fits most of the
stages in image processing software development. However the feedback from
implementation and system testing to detailed design is much stronger in image
processing than a lot of other software development.
An approach based on the waterfall model combined with exploratory programming
were used to develop the DNA sequence reading system. Figure 3.2-1 outlines this
approach.
Requirements analysis
•
and outlinesoecification Software
'
design
'
.
Detailed Implemen-►
•
design tation and'
unit testing
System
j I J ~
I ,
testing'
I
jOperation and
maintenance
Figure 3.2-1 Image processing software development model.
The general requirements analysis stage includes feasibility study, requirement
definition and specification, and then system specification. The feasibility study
specially relies on image processing hardware and image processing techniques. The
detailed requirement cannot be defined at this stage, only outline specification is
possible. A general model for image processing software design can be used in a small
system design. Image acquisition, image preprocessing, feature extraction and post data
processing are the top modules in the structure diagram of any image processing
software. Different applications require different middle modules in the structure
diagram. Detailed design can be defined as selecting the individual image operations.
Implementation can be defined as supplying the series of operations with parameters.
Chapter 3 DNA Sequencing Software Development 17
suitable operation path (the algorithm) from a operation tree for each image processing
function module. Implementation generates preliminary programs and then decides the
operation parameters, instead of deriving the program from low-level specification.
System testing demonstrates the adequacy of the system rather than the correctness of
the programs. When a larger number of images are tested, various complicating factors
and special cases may be introduced, so that the detailed design and implementation
must be refined repeatedly. The development stages overlap and feed information to
each other.
The following sections will give detailed descriptions of each stages in the image
processing software development model with the DNA sequence reading system
development processes.
3.3 Requirement analysis
It is important to make a distinction between user need and software requirement.
Users may need a software system to support their task, but the problems to be solved
must be collected and analysed. A software requirement is a property that the software
system must satisfy. Feasibility, requirement definition and specification, and system
specification make up general requirement analysis.
The feasibility study of a image processing software relies on image processing
hardware and image processing techniques mastered by people and available to the
developers. The detailed requirements are hard to define but an outline specification is
possible. A prototype of exploratory programming is often required if it is a new
application area to the software developer.
In developing a system for DNA sequence reading, VIPS was chosen as the
development environment. Exploratory programming is used to determine the
feasibility of using image processing techniques and to outline the possible accuracy. A
straightforward part of a DNA sequence autoradiograph is captured into a sample
image (see Figure 3.3-1 ). After thresholding the image, most of the bands on the DNA
sequence image are segmented. It is possible to increase the readability of the image by
preprocessing and enhancing the band features. The positions of the centre of gravities
of the segmented bands may be used to get the sequence of the bands.
The accuracy is very important in the system. The accuracy should be at least as good
as that from manually reading the bands. Uncertainty codes may be used, but missing
Chapter 3 DNA Sequencing Software Development 18
preprocessing, but it is hard to affirm how well the process will be at this stage. A
manual correction step may be added at the end of the algorithm to make the system
more acceptable.
-....
-
--
- -
-
-
.
--
--
----
--
---
-...
r
---
. . ..a---·
-....
..;I-
-
-IIIIJ---
-- ,5 -~
-a) b)
~
--..
...
....
-
=-iiL
=
----i
..
---a ..
~
--
-~.
--- --
=--
..
-
--=
--
-
--
-
---
.
-
---
-
I
-
-c)
Figure 3 .3-1 Exploratory programming results a) a sample DNA sequence;
b) segmented image with threshold 11 O; c) segmented image with threshold 150.
Besides general image processing operations, DNA sequence reading may require
individual operations, for example, sorting band positions into a DNA sequence. VIPS
is extendable, allowing new operation commands to be added for an application
system. So, the project of DNA sequence reading is created.
3.4 Software design
Design is a creative process. Software design is the process of representing the
functions of each software system in a manner which may readily be transformed to
one or more programs. Image processing software design requires that the software
developers have strong experience and extensive background in image processing. A
general model of image processing software design may be used to form the top
modules of a small image processing application. Figure 3.4-1 gives a general model of
Chapter 3 DNA Sequencing Software Development
Capture images
Compensate deficienciei Normalise image
Quantitative measurement
Integrity or completeness checking Surface property inspection
Sorting
Data transform Convert result form
Figure 3.4-1 A general model of image processing software design.
19
The initial DNA sequence reading system top module structure is given in Figure 3.4-2. The DNA sequence images must be captured from a DNA sequence autoradiograph. Contrast enhancement is the main part of preprocessing, which enhances the flat bands in the image. The infonnation to be extracted is the position and order of the bands in
the image. For this, the bands are filtered and detected. The purpose of the system is to
obtain the DNA sequence. The positions of the bands are scanned and then sorted. The
order of the bands is transformed into the order of the bases in the DNA sequence.
DNA
sequence reading
I
I
I
I
I
acquire enhance extract sequence
image contrast bands reading
Chapter 3 DNA Sequencing Software Development 20
After more images were tested, an automatically process of all subsequences in a captured image is added into the system. The final system function module structure is
refined as Figure 3.4-3.
DNA sequence
reading
I
I
I
acquire enhance automatically manually
image contrast process process
I
I
I
I
I
detect separate subimage select
gap lines subimage reading subimage
geometry extract sequence
correction bands reading
I
I
extract warp manually scan boundaries geometry correction bands
Figure 3.4-3. DNA sequence reading system function module structure.
3.5 Detailed design and implementation
Detailed design and implementation are closely related to problem solving. Each
function module is designed into an algorithm. In an image processing context, this
involves developing an algorithm for each function module to obtain the desired
resultant image or data from a given image. The detailed design depends on
implementation.
There is little or no underlying theory that may be used to determine the sequence of
image processing operations through which a desired solution image can be obtained
from a given image. In practice, an operation sequence (an algorithm) is frequently decided by trying out operations and checking the resultant images [Bailey, 1988]. Detailed design may be defined as selecting the operations while implementation may
be defined as determining suitable parameter values. The operation selection relies on
Chapter 3 DNA Sequencin8 Software Development
'
unsatisfactor:1 resultant image
given imag
goal image
Figure 3.5-1 Searching an image processing operation path.
21
There may be several operation paths for solving the same problem. An operation
search tree for an image processing function module may be created by a experienced
image processing algorithm designer. Searching for a path that gives satisfactory
results is the purpose of detailed design. Figure 3.5-1 represents a simplified image
processing operation search tree with depth-first search. The root of the tree is a given
image to be processed. The median nodes are median resultant images. The arc
between two nodes is a single image processing operation (or embedded algorithm).
The leaves of the tree are resultant images. Some resultant images are not successful.
The goal images are satisfactory (node j, f).
The control module designs of the DNA sequence reading system are described briefly
below. The image processing module algorithms will be given in Chapter 4.
DNA sequence reading module. The DNA sequence reading module is the main
system control module. The image to be processed may be either captured directly
from a gel autoradiograph by VIPS through a camera, or loaded from image data files
which have been captured previously. The user is offered the selection of the
acquisition mode, or to exit from the system. When loading from a file, the input image
file name is checked until the file name is acceptable. As preprocessing, the enhance
contrast module is called to make faint bands readable and enhance the contrast
between band lane sets and the inter-set spaces. Since each lane set represents a
different part of the DNA sequence, the lane sets must be separated into different
Chapter 3 DNA Sequencing Software Developmenl 22
automatically. If the image can not be separated well, for example if the space between
the lane sets is too small, the subimages may be selected manually. The process type is selected by user. The control flow diagram (CFD) of the system control module is
given in Figure 3.5-2.
DNA Sequence Reading
File
Capture image Load image file N
Enhance contrast Exit
N
Automatically process Manually process
Figure 3.5-2 System control module CFD.
Automatically process module. The automatically process module separates each
subimage automatically before processing each subsequence. Detect gap lines module
detects the spaces between lane sets and then obtains the separation key points, the
leftmost point and the rightmost point of each gap centre line. The separate subimage
module successively extracts subimages using the separation key points of the gap line. If the lane set is not extracted satisfactorily, the user may select the lane set manually
for the subimage. The subimage reading module processes each subimage to give the corresponding DNA sequence. Figure 3.5-3 gives the automatically process module CFD.
Manually process module. The manually process module is necessary to handle the
cases where the image cannot be separated automatically. For example, if the DNA
Chapter 3 DNA Sequencing Software Development 23
each lane set manually before reading the subsequence. This is repeated until all the
required subsequences are processed. Figure 3.5-4 gives the manually process module
CFO.
Automatically process
Detect gap lines
Separate subimage
y
Subimage reading
N
End
Select subimage manually
Figure 3.5-3 Automatically process module CFD.
y
Manually process
Select subimage manually
Subimage reading
End
Chapter 3 DNA Sequencing Software Development 24
Subimage reading module. The subimage reading module is called by both
automatically process and manually process modules. The subimage reading module processes a subimage containing one lane set which represents one subsequence. The
geometry correction module corrects any irregularities in the geometry of the lane set,
which call the extract boundaries module and the warp geometry module. The
extract boundaries module determines the left and right boundaries of the lane set as
required for geometry warping. The warp geometry module uses the left boundary of
the lane set to straighten the set, and the right boundary of the lane set to align the
bands between the lanes with a predefined width. The extract bands module removes
the background, enhances the band features and then obtains the band positions by
band detection. The scan bands module scans the band positions to give the DNA
subsequence and then joins subsequences into a longer sequence. Figure 3.5-5 gives the subimage reading module CFD.
Subimage reading
r
Extract boundaries
Warp geometry
y
Extract bands
Scan bands
( End )
-I
GeometryI
correctionGeometry warp manually
Chapter 3 DNA Sequencing Software Development 25
3.6 System testing and maintenance
System testing integrates and tests the programs as a complete system to ensure that the
software requirements have been met. Image processing system testing demonstrates
the adequacy of system for the application rather than the correctness of the programs.
The initial exploratory programming processes a single, or a small range of
representative images. A larger range of images must be tested to verify that the system
is adequate. Various complicating factors and special cases may be introduced, and the
system modified to handle these. If necessary, the execution time may be reduced by
modifying the algorithm to reduce or eliminate processing bottlenecks. The
information obtained is fed back to previous phases, especially the detailed design and
implementation phases. The algorithms must be refined repeatedly and the operation
parameters must be adjusted again and again until the system is satisfactory. It is
possible that more function modules (and algorithms) are needed to overcome the
deficiencies.
After initial detailed design and implementation of the DNA sequence reading system,
more DNA sequence images had been captured and tested. It was found that the band
lane sets on the images are often much darker than the gaps between the lane sets.
Because each lane set will be separated into individual subimage to be read
respectively, it is possible to separate each lane set automatically instead of having to
select each lane set manually. The gap line detection module and lane set separation
module are added into the system to accomplish this. In the case of some unsuccessful
images, the manual processes are still kept in the system as an option. If the designer
has good skill and experience on similar tasks, the automatic lane set separation
process should have been considered at requirement analysis stage.
Maintenance is the longest life-cycle phase. The system is put into practical use.
Maintenance involves correcting errors which were not discovered in earlier stages of
the life-cycle, improving the implementation of system units and enhancing the
system's services as new requirements are perceived. Maintenance of image processing
system is often needed for more special cases of images which have not been covered
in system testing.
Figure
3.6-1
shows the DNA sequence reading system which 1s running on aChapter 3 DNA Sequencing Software Development 26
Chapter4
DNA Sequence
Reading Algorithms
The DNA sequence reading system is developed using a combination of exploratory
programming and the waterfall model. The system software has a modular structure.
The system function module structure and the design of each control module in the function module structure have been described in chapter 3.
In this chapter, the algorithms of image processing modules in the function module
structure of the DNA sequence reading system are described in detail. The data flow
diagram (DFD) of each module is given with explanation of each processing step in
separate sections. Expressions for the associated mathematical operations and the
corresponding VIPS command lines are given in appendixes I and II.
4.1 Image acquisition
Gel autoradiographs are commonly used for DNA sequencing in genetics research (see Figure 3.1-1). An image is captured from an autoradiograph with sufficient resolution
Chapter 4 DNA Sequence Reading Algorithms 28
processed may be captured directly by VIPS through a camera or loaded from image data files which have been captured previously. Figure 4.1-1 is the acquire image module data flow diagram.
original
image Fig.4.1-2
noise
smoothed image
Fig. 4.1-4
contrast module
Figure 4.1-1 Acquire image module DFD.
image
Figure 4.1-2 A captured DNA sequence image with profile.
subimage module
(1) Capture DNA image. The autoradiograph is placed on a light box to give good
- - - -- - - -
-Chapter 4 DNA Sequence Reading Algorithms 29
video camera (see Figure 2.2-2). The camera limits the image resolution to 512x512
picture elements (pixels). A large gel autoradiograph therefore contains more
information than can be processed readily in a single image. For this reason, several
overlapping images are obtained of the autoradiograph, with the resulting subsequences
merged after processing. The size of each subimage is limited by sampling
considerations.
The smallest features of interest in the image are the bands in the lanes. The
Whittaker-Shannon sampling theorem [Gonzalez and Wintz, 1987]) requires that adjacent bands
have a minimum spacing of 2 pixels (one pixel for the band and one for the gap
between the bands). This gives a best case lower limit on the resolution - if the bands
are half way between pixels the contrast will be very low. A band spacing of at least 3
pixels is required to detect the individual bands reliably. However, the bands are not
[image:38.560.90.504.399.661.2]spaced evenly along the length of the gel. The spacing is maximum at one end, and decreases to a minimum at the other end. In practise, the bands get so close together that the sequence past a certain point is not even readable manually. Therefore, the image size is determined by the spacing at that readable limit.
Figure 4.1-3 A captured background image with line profile.
A typical autoradiograph with a readable area of 250x350 mm may require 6 or more
Chapter 4 DNA Sequence Reading Algorithms 30
chapter as an example for most of the image processing steps. The intensity profile along the line A-B is plotted to show the features of the image, which will be used to compare the processed image.
(2) Capture background. Normalisation of the background reduces the variation of the background which is caused from the light box and camera lens. A background image is required for normalising the background. The background image is captured at the same environment as DNA sequence image only without the autoradiograph on the light box. Figure 4.1-3 shows the background image of Figure 4.1-2. The intensity profile along the line A-B shows variation of the background and noise on a captured image.
(3) Smooth noise. The high frequency noise in the captured images may be removed by a lowpass filter before further processing. A local average smooth operation is used to filter the noise in the image. The average smooth operation is a special linear convolutional filter. The weights of the average smooth operation in a moving window (see Figure 2.1-1) are all one. This enables the expression of local average smooth operation, BOX AVERAGE, to be simplified fromFILTER LINEAR (see Eq.Al-4). A small window size 2x3 is used to keep the small band features of the image while removing most of the noise. Figure 4.1-4 shows the image, with the profile along line
[image:39.558.90.505.484.745.2]A-B, after smoothing. It can be seen that the line profile shape is much smoother than that in Figure 4.1-2.
Chapter 4 DNA Sequence Reading Algorithms 31
Figure 4.1-5 Noise smoothed background image.
Figure 4.1-6 Background normalised image.
[image:40.558.89.504.416.679.2]Chapter 4 DNA Sequence Reading Algorithms 32
a larger window gives more smoothing. Figure 4.1-5 shows the background image, with the profile along the line A-B, after smoothing with a 15x15 window. After noise smoothing, the profile shape in Figure 4.1-5 is much smoother than that in Figure 4.1-3.
(5) Background normalise. The background of object image may be variable because of uneven illumination from the light box and camera lens. A division operation is used to normalise the image with respect to the background. Division is a point operation on two images, which divides the object image by the background image and then multiplies by a constant (Eq.AI-14). Each pixel value is calculated from the corresponding pixel values in the input images. In this application, to prevent saturation the multiplier constant k is set to 200. Figure 4.1-6 shows the background normalised image with profile at position A-B, from Figure 4.1-4 and Figure 4.1-5. The intensity of the spaces between the lane sets (the background) is normalised into similar grey levels.
Acquire image module
background
normalized Fig. 4-1-6 image
Detect
gap lines
module
background normalized image
Fig. 4.1-6
minimum
vertically
proportion by range
(6)
(3)
range image
Fig. 4.2-5
contrast enhanced
Separate subimage
module
Figure 4.2-1 Enhance contrast module DFD.
[image:41.558.128.462.350.710.2]Chapter 4 DNA Sequence Reading Algorithms 33
4.2 Contrast enhancement
Some of the bands in the image are quite faint, and are not able to be detected reliably.
A contrast enhancement step is required to make more faint bands readable. Also
contrast enhancement improves reliability of gap position detection (section 4.3) and
boundary extraction (section 4.5). A local linear intensity stretch operation BOX
STRETCH (Eq.AI-7) may be used to enhance the contrast.
In DNA sequence images, the widths of the lane sets may vary from one image to
another, and the length of the space between bands is also variable. If the same window size is used on an image with wider lane sets or larger empty spaces, noise may be
stretched into a grey level band which will interfere with thresholding in the
segmentation step, or with the lane set boundaries in the geometry correction step. If
the same moving window size is used on an image with narrower lane sets, or the
[image:42.556.92.505.377.639.2]window size is too big, some bands will not be enhanced well.
Figure 4.2-2 Vertically smoothed image.
A series of operations are used to enhance contrast without being limited by the band
lane set width. The series of operations for contrast enhancement work on the same
basis as BOX STRETCH, except that the maximum and minimum values are detected
Chapter 4 DNA Sequence Reading Algorithms 34
horizontal moving window, and a minimum image is obtained by BOX MINIMUM using a vertical moving window. Subtraction of the minimum image from the
maximum image gives a stretch range image. Subtraction of the minimum image from
the original image gives the proportion image. The proportion image is then divided by
the range image to get a contrast enhanced image. Figure 4.2-1 is the enhance contrast
module DFD.
(1) Vertically smooth.
An average smoothing operation BOX AVERAGE is used tofurther smooth out any noise which may be presented in the image before finding the
minima and maxima. A window size of 15x3 smooths the bands vertically with
minimal interference across the boundaries of the lane sets. Figure 4.2-2 shows the
vertically smoothed image from Figure 4.1-6.
(2) Horizontal maximum.
A maximum image is required to get a stretching rangeimage. Each pixel value of the maximum image is determined by the maximum pixel
value in the moving window (Eq.AI-5).
A horizontal 1 x80 window is used to obtain the horizontal maximum image. In fact,
the maximum image gives the intensities of the gaps between the lane sets. The width
of the window was selected at 80, assuming that at least five lane sets are captured in
the image. This ensures that the gap pixels will be included in the window even for
[image:43.556.89.504.477.739.2]centre pixels of the lane sets. Figure 4.2-3 shows a maximum image from Figure 4.2-2.
Chapter 4 DNA Sequence Reading Algorithms 35
(3) Vertical minimum. A minimum image is also required to get the stretching range
image. Each pixel value of the minimum image is determined by the minimum pixel value in the moving window (Eq.AI-6).
A vertical moving window is used to extend the bands along the length of the lane. It is
possible that no band exists in a very long distance in some lanes. For this reason, a
[image:44.556.89.504.247.515.2]large window size 400xl is used to ensure that bands are always extended with lanes.
Figure 4.2-4 shows the minimum image obtained from Figure 4.2-2.
Figure 4.2-4 Minimum image from Fig.4.2-2.
(4) Range image. The range image for contrast enhancement is obtained by subtracting
the minimum image from the maximum image (Eq.AI-12).
If resultant value is negative it is set as zero. Figure 4.2-5 shows the range image
obtained from Figure 4.2-3 and Figure 4.2-4
(5) Proportion image. The proportion image is obtained by subtracting (Eq.AI-12) the
minimum image from the original image, which gets the proportion of each pixel value in the image between the maximum image and the minimum image.
Each pixel value of the proportion image then has 5 added to prevent excessive
Chapter 4 DNA Sequence Reading Algorithms 36
enhancement of any noise in the gaps. The proportion image is shown in Figure 4.2-6
[image:45.555.90.503.131.396.2]which is obtained from Figure 4.2-4 and Figure 4.1-5.
Figure 4.2-5 Range image from Fig.4.2-3 and Fig.4.2-4.
[image:45.555.89.502.460.723.2]Chapter 4 DNA Sequence Reading Algorithms 37
(6) Contrast stretch. Then contrast stretching is performed by dividing (Eq.AI-14) the
proportion image by the range image. The contrast enhanced image is shown in Figure
4.2-7 with profile of line A-B. The amplitude of the profile is larger than that of Figure
[image:46.555.90.504.201.471.2]4.1-6. The gaps between lane sets are whiter and the bands are blacker.
Figure 4.2-7 Contrast enhanced image with profile.
4.3 Gap line detection
There are number of lane sets in a captured image, each of which represents a part of a
DNA sequence. The different sets may be from different parts of the same DNA
sequence or from different DNA sequences, depending on the samples loaded into the
reaction gel. The lane sets must be separated into subimages and then be read
individually. If there are gaps or spaces between the lane sets, the gap centre lines can
be detected for automatic separation of the lane sets. Smoothing the image vertically
makes the lane set boundaries clearer. The smoothed image is then thresholded to
obtain a gap image. The gap centre lines can be obtained by thinning the gap areas to a
single pixel wide. The gap centre lines then are coded and the separation points