The Development of a Computer
Human Interf
ace
using
Touch
Input
for Point of Sale Applications
A thesis presented in panial fullilmcnl of the requirements
for the degree of Master of Technology in Product Development at
Massey University
Katharine
Julia
O'Driscoll
199
8
This was a
joint project between P
EC (New Zealand) ltd
. and
Massey University.
Abstract
This project developed a touch screen interface for a new generation EFTPOS sales tenninal al the fuel pump in a service station.
Scenario plans and creative
obscn1ation of consumers and analysis of their exp
r
essed needs.
wants, and requirements were developed within the context of the client's specifications. This enabled the production of a physical and graphical user interface that provided initial appeal, ease of learning, high speed of user task perfonnance. low user error rate, subjective user satisfaction, and user retention over time.
Using multimedia c<,mputcr software as a rapid prototyping tool enabled realistic feedback
10 be obtained early in the development stages and facilitated the modification of prototypes to minimise the barriers to potential consumer acceptance.
The designer was able to effectively communicate the goals and details of the product 10 the ream implementing the design using flow charts and diagrams to define the stnicture and content of the interface.
The process used to develop the interface was compared with published product
development techniques that incorporated consumer testing checkpoints throughout the discrete phases of product crea1ion. It was dctcm1ined that lhc generic processes were useful in practice, but only if the checkpoints were chosen appropriately and the tests cus1omised for the developing product.
Testing at fixed stages in the design process was found 10 be detrimental to 1he project. Pulling excessive emphasis on the tes1ing of the product curbed creativity by removing valid
solutions before 1hey could
be
inves1igated fully.The touch screen interface developed will
be
used to lead customers through fuel deliveries, Electronic Funds Transfer (EFT} transactions, and the purchase of other service station related products and services. The interface allows incorporation of advertising and customisation for use in other coumrics. meets the company's specifications, and has polled well in consumer tests when incorporated in a simulated mounting.Acknowledgments
The researcher would like to acknowledge with gratitude the assistance of the following individuals and companies:
Supervisor, Pradeep Sharma, Design Management, UNITEC Institute of Technology. (Formerly - Department of Consumer Technology, Massey University). A special thanks for continuing to supervise both project and student after moving to Auckland.
Supervisor/ Project Coordinator, Ian Palmer, Electronic Hardware, PEC (New Zealand) Ltd.
Foundation for Research, Science and Technology (FRST) for funding this project through the Graduate Research in Industry Fellowship (GRIF).
Tony Bray, PEC (New Zealand) Ltd, who championed the product form the beginning, and was always available to advise on Director scripting.
Kevin Low, Director Product Development, PEC (New Zealand) Ltd.
John Corbett, School of Design, Wanganui Polytechnic, Course Controller - Time Based Media.
PEC (New Zealand) Ltd. Staff members who dedicated many hours to the testing of the product.
Consumer Technology Department, Massey University, for assistance with initial focus group and testing.
BP (Pioneer liighway), for distributing and collecting questionnaires during the initial research.
Mobil (Rangitikei St), and BP (Fitzherbert Ave) for assisting with observation testing.
The researcher's parents, who provided hours of practical assistance with proof reading.
Contents
Abstract
Acknowledgments Contents
List of Figures List of Charts
1. Introduction
2. Project Background 2.1 Sponsoring Company
2.2 Rationale 2.3 Current Product 2.4 Product Intent
3. Project Plan
3.1 Project Outline
3 .2 Development Process Plan
4. Initial Research 4.1 Literature Review
4.1. l Multimedia Literature
4.1.2 Process Development Literature
4.2 Consumer Studies
4.2. l Related Technologies Questionnaire 4.2.2 Focus Group
4.3 Observational Analysis
4.3.l Paying At the Pump using the Current FST 4.3.2 Paying Instore
4.4 Technical Studies
4.4.1 Standards and Specifications 4.4.2 Touch Screens
4.4.3 Touch Screen Interface 4.4.4 Pump Authorisation
5. Product Specification 5.1 System Overview
5.1.1 Terminal 5.1.2 Site Controller
11. Modifications and Further Work 11.1 Modifications
11.2 Interface Navigation and Flow 11.3 Further Work
11.3.1 Graphical User Interface 11.3.2 Component Development 11.3.3 Standards Approval 11.3.4 Field Testing
12. Conclusions and Recommendations
References
Appendices
Appendix i -Related Technologies Questionnaire and Responses Appendix ii - Interface Questionnaire and Responses
Appendix iii - Interface Component Results
Appendix iv - Formal Questionnaire and Responses Appendix v - Interface Testing Results
Appendix vi - Graphical User Interface - Screen Pictures
141 141 147 148 148 149 149 150
171
175
177 177 179 189 191 209 213
Lis
t
of Fig
ures
2.1 Current Forecourt Service Tenninal (FST) 4
2.2 Forecourt Service Tenninal (FSD variations 4
4.1 Client Centred Muhimedia Project Cycle 19
4.2 New Product Development Process 27
4.3 New Product Development Process 31
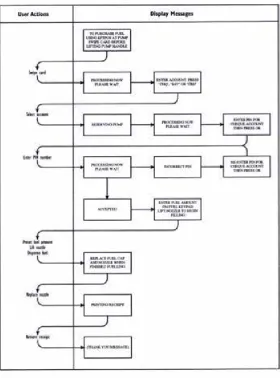
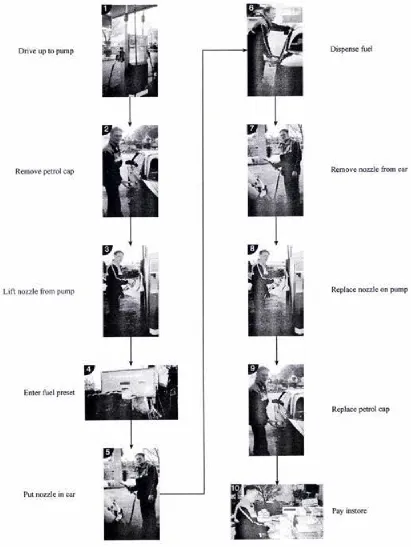
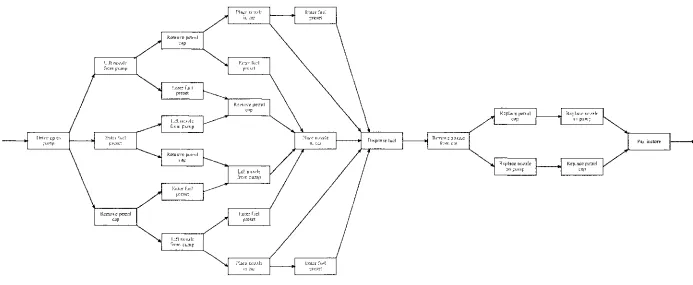
4.4 Normal message flow for EFTPOS transaction on current FST 36 4.5 Most commonly observed order used 10 make a fuel purchase 38 4.6 Possible order of tasks when purchasing fuel 39
6.1 Computer actions
54
6.2 Sample storyboard page 56
7.1 Selection of concepts for dividing interface into static and dynamic partS 76
8.1 Design concepts for the physical user interface 104
8.2 Elevations showing preferred physical user interface 105
8.3 Custom-wood models of physical user interface 106
8.4 Plan and section of current physical user interface 107
8.5 Foam model of physical user interface 108
9.1 Existing pump head 111
9.2
Rear view of lCSI rig showing location of computer 1119.3 External action buttons 113
9.4 Test rig mounted on trolley 113
9.5 Test rig 113
I 0.1 Button sizing 120
10.2 Button spacing 121
10.3 Time taken vs errors made by evaluators using purchase list I 123 10.4 Time taken vs errors made by evaluators using purchase list 4 123
List of Charts
6.1 Human Interaction Chart 59
6.2 Human Interaction and Computer Action Chart 61
6.3 Computer Action Chart - Preset Fuel Amount 63
6.4 Computer Action Chart - Pick up Pump 63
6.5 Computer Action Chart - Dispense Fuel 65
6.6 Computer Action Chart - Check Card 65
6.7 Computer Action Chart - Personal Details 67
6.8 Computer Action Chart Additional Purchases 69
6.9 Computer Action Chart - Print Receipt 69
11. l Interface Navigation Chart 151
11.2 Dynamic Screen Section - Fuel Preset 153
11.3 Dynamic Screen Section - Car Purchases 155
11.4 Dynamic Screen Section - Other Purchases 157
11.5 Independent User Action - Insert Card 157
11.6 Dynamic Screen Section Card Details 159
11. 7 Dynamic Screen Section - Extra Card Details 161
11.8 Dynamic Screen Section - Finalise Transaction 163
11.9 Independent User Action - Remove Card 165
11. l 0 Independent User Action - Pick up Pump 165
11.11 Independent User Action Start Dispensing 167
11.12 System Alert Message - Timeout 169
11.13 System Alert Message - Error Message 169
Introduction
The project was commissioned by PEC (New Zealand) Ltd, a company specialising in innovative and high technology products for the oil and security industries.
The product required was a touch screen graphical user interface that was to be incorporated into a Forecourt Service Terminal (FST) being developed by the Company. The point of sale device would be located at the petrol pump in service stations. The FST would allow customers to purchase fuel and other products using EFTPOS, fuel, or local cards at the pump. The FST builds upon another product that PEC currently have on the market that enables a customer to purchase fuel using an EFTPOS card at the pump.
The projects joint aim was to present a practical application of the theoretical product development process and to apply generic product development techniques to guide the project through the appropriate design, prototyping, and testing phases.
The theoretical product development process as applied to the interface development was as follows:
Clarify PEC's needs;
Analyse current systems and practices; Define product specifications;
Generate product concepts by creating a simple storyboard based on the specifications then develop the storyboard to incorporate innovative options;
Develop selected product concept and produce a multimedia interface to fit; Conduct initial consumer testing to canvas consumer and technical opinion, then modify the storyboard and prototype accordingly;
Develop the physical aspects of mounting the user interface and model the options;
Develop product detail and prototype the interface on the computer;
Consumer test the product to identify areas of acceptance and areas for modification;
Refine the product design and repeat testing and modification until stakeholders are satisfied with the design;
Prepare a formal project report;
The resu
l
ting touch sc
r
een interface
is
innovative,
technically
sound
,
is
inviting
to customers
and easy to use
,
allows
incorporation
of
advertising and customisat
i
on for use
in
other
count
r
ies
,
meets the companies
specificatio
n
s,
and has po
ll
ed well in consumer tests whe
n
incorporated
in a
s
imulated
mounting.
Pub
l
is
h
ed
p
r
oduct
dev
elo
pment
techniq
u
es
which incorporate co
n
sumer testing checkpointS
thr
oughou
t
discrete
phases
of p
r
oduct creation were found to
beusefu
l in practice,
but
on
l
y
if the checkpoints we
r
e chosen appropriate
l
y and
t
he
t
ests
customised for the
developing
product. Generic
methodol
ogies
need to be translated and adapted for the partic
ul
ar product
area and
type.2
Project Background
2
.
1 Sp
o
n
s
orin
g
Company
PEC (New Zealand) Lid is a company specialising in innova1ive and high lcchnology produc1s. ·n,ey have been working 10 mee1 the needs of ctistomers, including oil and securily industries, since 1947. Under the main PEC (New Zealand) Ltd umbrella
there
are
three
business units:
Reiail Solutions - world leading retail automation sysierns, Cardax - integrated security access control systems, and Pumps- sophis1ica1ed fuel dispensing equipmcn,.
All lhe bllSiness units arc based a, si1es loea1ed in Marton. where each uni, can benefi1 from the technologies used and developed by 1he company. PEC currenily houses an extensive multidisciplinary product development group consis1ing of over 100
technologists.
PEC's products include poinl of sale. fuelling, and security conirol systems. and are
sold in over JO couniries.
2
.2
R
ationa
le
In
199
1
, PEC
began 1he design and development ofa card reader system 10 be located in the head of existing petrol pumps. TI1is product would allow for the purchase and paymcm of fuel at a pump on 1he forecourt of a service swtion. Similar products combining a card reader with a pump had been available for a short time on the international market and had a small following. 11 was PEC's vision to redesign an indoor point of sale unit for mounting a, the pump 10 create a "Forecourt Service Terminal". Unlike a s1raigl11 card reader and pump, the unit would have the capability10 sell more 1han just petrol. For PEC, the development of the Forecourt Service Tem1inal (FST) was a natural progression building on their experience with both card
reading and petrol pumps in their existing product lines.
2
.
3
C
urrent
Product
In 1993 tooling for a prototype run of Forecoun Service Terminal (FST) units was
completed. The first FST units were then produced for customers in Brazil and Hong
Kong. The units were purchased by the cus10mers for very different reasons. For
Brazil the purchase of around 60 units came at a time where policy changes meant
that service stations were being upgraded. The fitting of the FST units added an extra
feature for the service station at a minimal extra cost. For Hong Kong, with extremely
busy roads, the installation of the FST units increased productivity at service stations
while de<:reasing fraud. Each pump and FST could
be
assigned to a different attendant(attendant tagging), with all sales being run through the FST by either the customer or
the attendant. FST units have since been installed in New Zealand, Australia, South
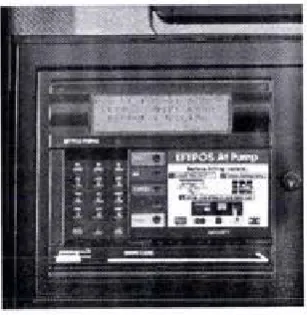
[image:19.574.189.343.309.467.2]Africa, and Malaysia.
Figure
2.I
:
Current Forecourl Service Terminal
(FS1)
Figure 2
.
2
:
Forecourt Service
Terminal (FS1)
variations
The FST is produced in three different colours of plastic, which is then pad printed with the appropriate text. There are currently around 15 variants of the FST front. Each customer has their own combination of colours and text, making the front end of the unit a costly item to produce, and an item which can only be sold to the one customer. Due to the high level of customisation of the FST front, holding the unit in stock is not cost effective.
The FST has been very successful. The tooling, which was intended to cover a prototype run of no more than 500 units, has produced around 14 OOO units to date.
The first major break in technology for the FST came from a need to include Smart Card transactions in the South African market. The use of different types of card was not envisaged in the initial design of the FST, but a successful solution was found.
2.4 Product Intent
The FST had always been sold as a unit with the capabilities to sell other products, however, in reality when a customer wanted to be able to sell oil from the FST, it required extensive input from software engineers to add that one function.
Changing the original design to include today's additional requirements is becoming harder and more time consuming. The cost of customisation is inhibitive.
In 1994, PEC began work on a model upgrade for the FST. The reasoning behind the upgrade was to provide a system that required less support from PEC staff. This upgrade would be achieved by producing an FST that was driven more by the software than the hardware, allowing the unit to be customised more easily.
The development of concepts for the new FST were based around known strengths and weaknesses within PEC's existing range of products. The major strengths identified for the current FST unit included:
The ability to be mounted into the majority of existing petrol pumps, The ability to be combined with another PEC product, a site controller, to supply a complete service station solution.
The new product had to be easily customised, with functionality that was flexible to meet the needs of individual markets. It was decided that using a flat panel Liquid
6
Crystal Display (LCD) screen with a touch overlay in the FST mark 3 would provide
a suitable solution to facilitate customisation. The physical user interface would
be
able to remain the same throughout all the models, while the screen would contain the
3
P
roject
Plan
3.1 Project Outline
PEC (New Zealand) Ltd approached Messey University with a potential Graduate Research in Industry Fellowship (GRIF) project. The project was the development of a computer human interface using touch input for point of sale applications.
The idea behind the project at the stan was to produce a touch screen interface that could
be
used to lead customers through fuel deliveries and Electronic Funds Transfer(EFT) transactions. The interface would also be used 10 perfonn other transactions, service station related services such as car washes and dry stock sales, and non service station related services such as fast food sales from an attached franchise outlet.
Massey University accepted the idea and identified a possible student. Following the selection of a student, a joint submission by Massey University, PEC (New Zealand) Ltd and the student was made 10 the Foundation for Research. Science and Technology (FRST) for GRIF project funding.
The project was accepted by FRST to receive GRI F funding, and
a
job description andbasic plan were compiled for the student by PEC. The basic plan summary follows:
Deve/opme111
of a Storyboard
Duration 8 weeks;Research areas - Background on current system and project requirements, rc1cvam banking requirements, understanding the technology to be used, and research in operating background.
Output - Flow diagram, Storyboard, Repon, Working model on computer.
Display lnvestigatlon Duration
12
weeks;Research area - Operating environment, capability of LCD displays, research into colour combina1ions suitable for application, means or reproducing the viewing angle of screen for security modes.
Output - Repon, working demonstration model.
Icon
Research
Duration
Sweeks;
Research and design areas - design icons that will negate the need for words to use the product, research other graphical interfaces such as EFT, information kiosks, web sites, and other unmanned interfaces.
Output - Repon, updated computer model.
Touch
Int
erface
Duration5
weeksResearch and design areas - Research and design button/touch including visual feedback, audio feedback, speed, and how they should work.
Output· Working prototype on computer.
Human Reaction Duration 12 weeks
Research and design area - Extensive research into personal reaction 10 different types of interface, colours, graphics, animations, sounds, prompts, help needs, and information flow.
Output - Report and working prototype on computer of best solution.
Help Definition
Duration8
weeksResearch and design areas - An extension of the human reaction studies concentrating on help requirements.
Output - Report of help requirements of the interface.
Finalisation
Duration I O weeks
Output - Finalise working computer prototype.
3
.
2 Development Process
Plan
8
Using the job description and the PEC proposed project plan as a guide, the following
plan for a development process based on the style of Ulrich and Eppinger (1993) and
Moore and Pessemier (1996) was prepared.
Clarify Companies
Needs
As identified by PEC in the project outline.
Analyse
C
urr
ent Syste
m
s
and Practices
Familiarise with company, personnel, and company products.
Familiarise with related technologies and similar products.
Service station users s
u
rvey,
Focus group,
Observationa
l
anal
ysis.
Ident
i
fy
techn
i
cal
facto
r
s
that would
i
mpact on the product
specifications.
Identify and
address
additional persona
l
skills
r
equi
r
ed 10
carry out
all aspects of the projec
t.
Create Product Specification
List a precise description of
what the p
r
oduct needs to do and comply
with.
Generate Producl Concepls
Create a simple storyboard based on
the spec
i
fications.
Develop the storyboard to
i
nclude further identified options.
Technical Content Testing
Interview company expens in areas of component processes as
ident
i
fied
in the storyboard.
Develop Product Concept
Develop an interface to tit the selected storyboard.
Initial Concept Testing
Assess consumer reaction
co
the storyboard using the developed interface.Modify
s
t
oryboard
and
interface in
direction required by
consumer
samp
l
e and company technical experts.
Physical User Interface
Investigate ways to mount components in a forecoun environment.
Deve
l
op company's choice of mounting.
Model
alternat
i
ves fo
r
the chosen mounting location.
Detail Development
Refine, modify, and add 1
0graphical user imerface.
Proto
t
ype
i
nterface o
n
com
p
uter.
Consumer Testing
Assess individual aspects of
the i
n
terface co
nt
enL
Construct tes
t
a
r
ea to house interface prototype.
Fom1ally
t
est G
r
aphical User Interface (GUI):
Study ofconsunters
i
nteraction w
i
th p
r
oduct,
User questionnaire,
I
dentificat
i
on of
a
r
eas of cxecllcnce and a
r
eas for improveme
n
t
.
10
Modifica1io11 of
Pro101ype
Improve aspecis or areas oflhe interface identified during testing.
Refine
Product Design
Repeat con.sumer testing and modification until the company is satisfied with the product design.
Prepare
Report
Submit Product
4
Initial Research
The overall project was separated into four main aspects:
Multimedia Technologies Content
Consumer Observation Survey
Ergonomics Physical Cognitive
Product Development Process Theoretical
Applied
Initial research in the form of a literature review, consumer survey and observation, and a technical review was carried out. The research aimed to determine existing knowledge and applications of the identified aspects, in order to form a basis with which the development of the Forecourt Service Terminal could structured around.
4.1 Literature Search
4.
I.I Multimedia Literature
Defining Multimedia
Multimedia has been defined as the simultaneous use of more than one media type on a computer (Murie, 1993). The basic types of media available on computers are:
Text, Graphics, Animation, Video, and Sound.
12
1t has similarly been defined as 1he seamless integration of text, sound, images,
and control software within a single digilal information environment (England
and Finney, 1996).
England and Finney (1996) give a summary of innuencing factors for !he use of
each of1he different media l)'pes as follows:
Video
Video uses more space lhan olher media and may affect lhe interaction speed.
The display size of any video needs to be appropriate for the content, needs oflhe viewer, and platfonn.
Video graphics can be faster 10 produce but more expensive lhan computer graphics.
Video graphics can give a continuity of slyle in applications where video features.
Audio
Audio is a versatile and cheap medium.
Saves the overuse of text.
h appeals to emotions.
hs range and scope are unappreciated in most multimedia to
date.
Care is needed for sounds that become irritating when repeated in an interactive environment.
Graphics
These are versatile and have a wide range of quality.
They can offer realistic and symbolic reprcsenlalions.
Research findings indicate that graphics have value in all applications.
Text
Over time text has changed its role 10 a supponive one rather than a main component.
Allhough used less now, care needs to be 1aken 10 ensure 1hat the lexl content keeps ilS quality in line with the other media components.
Integrating text and maintaining quality can be difficult.
Layout, size and legibility are importam.
Multimedia is most often used for presentations, training and education programs, sales demonstrations, information kiosks, games, and database front-ends. It is a technology that exists in many applications, and users are now expecting it to be a part of what a computer 'does' rather than some unusual feature (Murie, 1993).
Multimedia Tools
Icons
Research on icons can be linked with that on signs and symbols.
The use of symbols probably began fifty thousand years ago when man made his mark using simple abstract strokes cut into rock or bone. A symbol stands for something. It is visually precise. A symbol attempts to get at the essence of an idea either by being a literal miniature drawing or by being a non-literal visual metaphor. A symbol can give an identity to a subject and, by repeated use, can come to equal it (Holmes and DeNeve, 1990).
The elements used to create a quickly understood symbol are the basic graphic shapes: circles, squares, diamonds, triangles and so forth. Each element comes with its own meanings, and when put together with each other in different combinations, the shapes can become very potent. Adding colour to the elements increases the range of possibilities. However, reliance on colour can be dangerous (Holmes and DeNeve, 1990).
In multimedia any pictorial representation that a user can select is called an icon. But in the theory of signs, icons are images that are readily recognisable. They are not symbolic, but realistic to the extent that they are recognisable without explanation. Commonly, icons in multimedia encompass the complete range of images from abstract symbols to realistic representations. The user quite often has to learn what the symbols mean to use the icons effectively (England and Finney, 1996).
Dreyfuss (1972) separates symbols into three different types:
Representational
Representational symbols present fairly accurate, if simplified, pictures of objects.
14
Abstract
Abstract symbols reduce essential elements of a message into a graphical form. These may once have been representational but have become simplified by design or degrees over many years, to the point where they now only exist as symbolic indications.
Arbitrary
Arbitrary symbols are those that have been invented, and accordingly must also be learned.
England and Finney (1996) indicate that there is no equivalent to the miniature moving images sometimes used in multimedia interfaces, as sign theory relates only to static images.
Interactive media allows for the combination and manipulation of information in new ways, with icons forming a part of the new vocabulary. Icons show that the user has choices and try to indicate what sort of information could be activated if the icon is selected.
It is important that any new symbols used are suitable for the markets the product is intended for. According to England and Finney (1996) there have been many examples of cross-cultural misinterpretation of symbols.
It is also important to limit the number of icons in use on an interface. If there are many icons, it will take the users a longer time to learn their meaning (England and Finney, 1996). This problem is accentuated in multimedia applications where the users are not expected to spend much time on the systems (ie. Kiosks).
According 10 England and Finney (1996), a lot of progress has been made in
multimedia design due lo the use of icons. Overall icons provide better access
10 the systems functionality despite their limitations. Instead of having to
remember sets of symbols and codes like computer languages, icons provide
prompts 10 help anyone activate the power hidden in the application.
S01111d
Sound refers to any type of audio use. This can include speech, warning bleeps,
alann bells and so on. As sounds became easier 10 digitise,
ii
became apparentthat overuse was unwise. People became irritated by repeated sounds (England
and Finney. 1996). Some sounds that are initially attractive or entertaining pall
quickly.
Schuck ( 1994), investigated the use of auditory feedback in the design of touch input devices. In an experimem performed using a touch screen keyboard to
type random characters and English words, testers were timed with and without
auditory responses 10 their key presses. The results indicated that the addition of
auditory feedback had a significant effect upon typing perfonnance in the use
of touch screen input devices. Speed of response was shortened with the
addition of auditory feedback with the number of errors made not being
affe<:ted.
Colours
There can
be
seve
ral
uses
for
colour s
u
ch as ancntion
cues. ae
st
hetics
.
s
t
yHng
and branding (England and Fi11ney, 1996). As with the use of sound. colour can
please initially then become annoying for users.
Colour displays arc attractive to users and can often improve task perfonna11ce,
but the degree of misuse is high. According to Shneidennan ( 1992) colour can:
Soothe or strike to the eye,
Add accents to an uninteresting display,
Facilitate subtle discriminations in complex displays,
Emphasise the logical organisation of infonnation,
Draw attenti
o
n
to warni
ngs,
Evoke strong emotional reactions of joy, excitement, fear or
anger.
16
The use of background colours, the colour of text against a coloured
background, colour linked with layout and the awareness of colour-blindness in
a percentage of the audience were all factors that were researched before the
availability of high-resolution screens and high quality colour. The main
problems arose from poor selection of colours in relation 10 each other causing
difficulties in reading and legibility (England and Finney, 1996).
According to England and Finney ( 1996) one of the problems that still prevails
is the changes in colour that occur due to their origins, the platform, the
software, and the encoding process. Even with good planning colour shifts can
occur
.
There are cross-cultural associations in the use of colour. This is pan of the
aesthetic appeal of colours but it may become important
as
applicarions need toreach international audiences. Some cultures respond better to bright, strong,
primary colours and other cultures prefer pastels (England and Finney, 1996).
For applications that are intended to sell products, this could be more of a factor
than other types of application.
Some common examples of Western colour psychology are:
Red
Blue
Green
= stop, danger, heat
cold, water, sky
go, environmentally friendly
Research in the area of colour psychology is ongoing.
Multi.media Products
England and Finney (1996) have divided multimedia products into the
following categories:
Pr
es
emarion
- This is a growing source of business multimedia. Applications
of this type of presentation include conference presentations
and presentations for corporations 10 help project an
internationally competitive company image.
- Tools for computer based presentations are now making it
possible for many people to produce the lower-level forms of
Point of information (POi)
There are a wide range of applications that fit this category, from tourist information systems to applications in museums that give specific information about exhibits. These systems are often intended for use by the general public.
Point of sale (POS)
These are retail projects where the application needs to sell products. These systems are often confused with Point of Information since the customer can usually get information on the products before requesting a sale. The deciding factor determining the success of a POS is whether the customer will commit to buying an article on the spot.
Kiosks, of which POi and POS are types, are a significant area for multimedia. These require sophisticated and attractive user interfaces to encourage public use. Since kiosks are usually specially designed systems, the hardware configuration can be chosen so as to be the best for the task with few constraints other than cost.
Training
The training market has in the past been one of the strongest for multimedia. There is a strong emphasis on defining the expected changes in the users behaviour as a result of using an application.
Advertising
Advertising agencies are beginning to recognise the potential that multimedia might offer. This sector is likely to grow as advertisements are made more interactive.
Education
The standardising of curricula means that this is a potentially large market.
The Internet is one such technology. It started as a text-driven method of communication, and is changing rapidly into a distributed multimedia channel for not only higher education but for business as well.
Publishing
Included in this category are record, audio-visual, and book. Some of the more popular examples of multimedia titles developed in this area include atlases, road maps and encyclopaedias.
Multimedia has been described as having "a chameleon-like ability to pretend to be many things" (England and Finney, 1996, p2). The developer has the freedom to use any number of media types and techniques. For the end user, the
18
use of multimedia in the intended environment can improve the flow of ideas
and information.
A secondary side to multimedia is interactivity. Interactivity being, the
capability for the user to interact with the multimedia production, causing
things 10 happen or interrupting the flow of information. Interactive multimedia
descends from computer-based training by way of interactive video. Good
interactive video using videodiscs is only now being surpassed by all-digital
multimedia (England and Finney, 1996).
Design
i
ng a Multimedia Pro
du
ct
According to Murie (1993), designing and producing a multimedia project
involves three major tasks:
Design
- The process of coming up with the idea.
Produ
c
tion of
elements
- Creating the different media elements that will be used in the project.
Implementation
- Taking the elements and puning them together based on the original design.
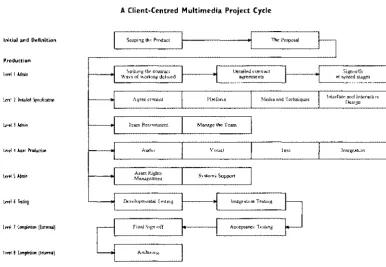
A comprehensive breakdown of the project cycle has been covered by England
and Finney (p6, 1996) in figure 4.1 reproduced on pi 8.
Funher description of the England and Finney ( I 996) project cycle is
summarised below:
Th
e
definition stag
e
- Gaining an understanding of what the clients want - 'scoping the project';
Project timescale;
Definition of costs;
Initial and Definition Production lm!IAdmin lml2l¼tii!edipeci6otion lm!JAdmin Level4.AisetProdu<tion lmlSAdnin Lml6Tt!ting
lml 7 Com~,tion (Ext .. nal)
lml 8 Com~etioo (lntffilal)
Production
Level 1 - Defining the developer/ client relationship;
Level 2 - Defining details relating to content, platform, media and techniques;
Level 3 - Recruitment of personnel ( completed in parallel to level 2);
Level 4 - Asset creation. The production of the multimedia components;
Level 5 - Administration of rights for material used (in parallel to level 4);
Level 6 - Specificity testing of individual pieces and the integrated components;
Level 7 - Final sign-off by client;
Level 8 - Documenting and archiving project to aid with return business and upgrades.
A Client-Centred Multimedia Project Cycle
Scoping the Product
Saiking the contract Ways ofworkmg defined
Agree content
Team Recruitment
Audio
Asset Rights Management
Development.al Tesung
Final Sign--o!T Archlving Platform Del.ailed contract agreements The Proposal
Media and Techniques
Manage the T earn
Visual Text
Systems Support
Integration Testing
Acceptance Testing
Sign--offs at agreed stages
Interface and Interactive Des,gn
Integration
Fig. 4. 1: Client Centred Multimedia Project Cycle (England and Finney, 1996, p6)
Murie (1993) details the project cycle in six steps:
The idea
Every project begins with an idea, goal or purpose.
[image:34.573.87.474.342.609.2]20
Establishing the constraints
Before details of the product can be worked on, the constraints for the project need to be defined. The most obvious constraints include cost, time and materials. Some less obvious but equally important constraints include, defining who will use the product, what they will use it on, and what they expect from the product.
Planning the production
Three elements effect the planning of the production, the authoring environment, the data, and the user interface.
The authoring environment is the program used to create the multimedia production and to bring all of the media elements together.
The data is the main part of the production. It is the information that is to be conveyed to the user.
The user interface deals with how the user will interact with the data. There are two main elements in interface design, structural elements and cosmetic elements. Structural elements include items such as menus, data fields, windows and buttons. These elements must be defined early in the development process (Murie, 1993) as changing these elements involves large changes in a project. Cosmetic elements refer to items such as the background graphics and the shape of the icons.
Creating the prototype
To produce a multimedia product by building a complete prototype and then building the final product from scratch is in Murie's opinion costly on both time and resources. The alternative he proposes is to work in 'chunks'. The first chunk, which provides the framework, being the implementation of the system structure. He indicates that graphics should be designed after the system structure has been completed.
Adjusting the prototype
Throughout the prototyping, consumer testing of parts or all of the system should be carried out. This allows the developers to see what users think, and then add to or change the prototype. Murie advises that testing is most valuable when input is gathered from as many sources as possible. When testing an interface, the most useful result is gained by using someone who has never seen the project before. It is beneficial not to tell the user how to do anything, but to watch what they do. One way to insure the developer has no input into the evaluator's actions is to have tests videotaped. With a video, the developer is not in the same room as the tester and therefore cannot interfere. The other benefit of a video is that the tape can be watched over and over again.
Final delivery of the project
Assessing
the Qu
a
lity
ofMultim
edi
a P
r
o
duct
s
The quality of individual aspects of a multimedia product may
be
able to be defined specifically: for example, audio feedback being mono or stereo.Defining the quality of design is subjective (ie. every person testing a
multimedia system design looks at the aspects of the system that mean the most
to him or her). The difference in perspective among the testers makes consensus
difficult. In each project there will be some technical aspects but many
subjective aspects for design quality.
According to 1,ngland and Finney ( 1996), the best solution to date for assessing
the quality of a multimedia-based product is 10 define a set of criteria that the
product is to meet before any other decisions are made. Each project will thus
define its own 'quality' priorities according to the subject and target audience.
England and Finney (1996) used the following equation 10 define design
quality:
Design quality for media projects : content and treatment agreement
The content means the information that is going to be presented.
The treatment means which media and which techniques will be used and what it will look like.
The Mu
l
timedia User
I
nt
e
rfac
e
Each multimedia application has an infrastructure that links the component
parts together so that users understand what the application contains, how the
information is organised and what they need to do to activate the separate
pieces. This structure is more commonly referred to as the interface. The aim of
most interfaces is to provide smooth, easy access to any
pan
of the program theuser wishes (England and Finney, 1996).
Ravden and Johnson ( 1989) define the user interface as the programmable, or
software, interface that enables the end user (ie. the person using the computer)
to access and interact with a computer application system, to make use of the
22
facilities and functions which it provides, and to carry out the tasks for which
the system has been defined.
The user interface generally consists of information displayed to the user and
facilities which allow the user to enter information into the computer, to
manipulate information which is displayed, and to take control actions. It
enables the end user to access and make use of the facilities and functions that
the system provides, and to carry out the tasks for which it has been designed.
The user interface provides the user with information about the system, about
what it does, and about what the user can and should do. It enables the user to
learn about the system and to build an understanding of how it works (Ravden
and Johnson, l 989).
Ravden and Johnson ( 1989) indicate that if the interface is poorly designed, it
can severely restrict the user's ability to use the system. It can cause confusion
and frustration, difficulty in learning how to use the system, misunderstanding
of what the system is doing and of what the user should do, errors, and
difficulty in using the system to carry out tasks successfully.
For today's users, communication with a multimedia system has become at
least as important as the computation by the system. "To users, the interface is
the system" (Hix and Hartson, 1993, pi).
England and Finney (1996) explain that when text was the dominant medium
applications were strucnired through menus. The user had a choice that led to
another text menu and so on. The user went down through the levels and
returned by selecting 'exit' or the equivalent. This type of structure has become
known as a tree structure. There are variants on this structure, which allow the
As it became easier to include graphics, icon-driven menus started to become
common. England and Finney (
1
996}
identified the following advantages I.haticons have over lex1:
They may take Jess space lhan text;
They are not language specific;
They are aesthetic and appealing:
They can make access through the application easy.
Usabi
lity T
e
st
in
g
An alternative to testing the quality of I.he mullimedia system is to test the
usability of the user interface. The need for user friendliness is often heard,
however, mos1 users are not looking for a friend in the computer but rather
hassle free productivity. The real issue is usability.
The human-computer interface, or user-interface, represents the only part of I.he
application system that the end user comes into direct contact with. The
user-interface therefore plays a vital role in enabling the human to ·use· the system
(Ravden and Johnson, I 989).
Usability has been defined by Ravden and Johnson ( 1989) as the extent to
which an end-user is able to carry out tasks successfully, and without difficulty.
using the computer application system.
Tom Carey (c. 1992} (quoted in Hix and Hartson, 1993} a lecturer in the
department of Computer Science at Virginia Tech. USA had the following to
say on usability: "If your computer were a person, how long 'til you punch it in
the nose?u
Shneiderman (1992} divides usability into the following user-orientated
characteristics:
Ease of
learning,High speed of user task pcrfom1ance,
Low user error rate,
Subjective user satisfaction. and
User retention over time.
24
England and Finney (1996) indicate that multimedia does not have a strong tradition of testing. It has not developed a clear relationship with the methods of testing from other disciplines and has not devised its own.
The importance of usability testing to ensure the best interface design is reinforced by Ravden and Johnson (1989). The programmable, or software, interface that allows interaction between end users and the computer plays a vital role in the effectiveness with which a human-computer system functions.
It is therefore essential that the user interface meets the needs of those using the system to carry out tasks.
The importance of user interface design should not be underestimated, and its evaluation should be expected to take some time and effort (Ravden and Johnson, 1989). In the longer term the benefits which are likely to result from the evaluation may outweigh the costs.
Ravden and Johnson ( 1989) gave the following examples of benefits resulting from a well-designed and tested user interface:
Reduced training time for end users;
Reduced support costs, due to fewer and less significant difficulties;
Reduced need for amendments, modifications and revisions after implementation;
Where relevant increased sales, as a more useable, well-designed and acceptable product is produced;
A greater willingness among end users to accept the system and to use it effectively;
Greater efficiency and utilisation of computer resources;
A greater awareness, amongst those developing computer application systems, of the requirements for 'user-centred' design.
The Use of Touch Screens in Multimedia
According to Keister (1997), it was not long ago that touch screens were specialised tools limited to applications such as process control, military command, and air-traffic control. Reasons for using touch technology in these areas were defined by Shneiderman ( 1992) in the following list:
Space is at a premium in these systems, Touch screens have no moving parts, Users can be guided through complex tasks.
In early studies, direct pointing devices, such as the light-pen or touch screen, were often the fastest but the least accurate devices (Stammersand Bird, 1980; Albert, 1982; Haller et al., 1984). The speed appears to accrue from the directness of pointing, and the inaccuracy from problems with feedback, physical design, and use strategies.
Over time, touch screen technologies have improved. The improved technologies used in the devices have made it feasible to build high precision touch screens and pens. Costs have dropped and parallax errors have decreased with the integration of touch screens during the display-construction process (Shneiderman, 1992).
Up until the l 990's few of the general public had actually seen an operating touch screen (Keister, 1997). This has changed during the l 990's with supermarkets, post offices, restaurants, shopping malls, libraries, gaming establishments, and a variety of other enterprises now employing touch screen technology.
According to Daniel Shore (quoted in Keisler, 1997), General Manager of the AccuTouch Business Unit of Elo Touch Systems, Inc. (Oak Ridge, TN), touch screen suppliers sell solutions to the following four primary markets:
Point of Sale (POS)
Touch screens simplify cash registers; Operator errors are reduced;
Useful in areas with high employment turnover.
Point of Information (PO!)
Provide access to data in public environments; Give fast, easy information in users native language;
26
Used in computer-based training systems.
Gaming Systems
Touch screens are used to make games into more intuitive systems;
Unlike their fixed button counterpans, 1ouch screen terminals
are not limited to one game.
Process Control Operations
Can simplify man/machine interface;
Stand up to coniaminant-rich environments like factory floors; Can be sealed to become watertight, making touch screens
more durable than keyboards, buttons, and dials.
Keister (1997) highlighted the following areas where touch screens have advantages over other input devices:
Easily customised (ie. easy to switch between languages used to display commands);
Able to be sealed and made water-tight;
The user
has
direct contact with the interactive information;No computer literacy is required to use a touch-based system. Carroll Touch ( 1998), adds to Keister's list with the following points:
As pointing or touching is a natural means of indicating
choice, touch systems are ideal for selection-based
applications;
Selections are made by pointing al the screen, 1herefore no special software commands are required;
Hand-eye movements do not need to be coordinated as the user does not need to look away from lhe screen to a separate input device (ie. a keyboard);
Many graphic effects are possible. Touch targets can be
different shapes, colours, and styles.
Touch screens lend themselves to stand alone displays such as kiosks, and Keister (1997) indicates that the largest market by far for touch screens is lhe
4.1.2 Process Development Literature
Generic Product Development Process
"A product development process is a sequence of steps or activities that enterprise employs to conceive, design, and commercialise a product" (Ulrich and Eppinger, 1995, pl4)
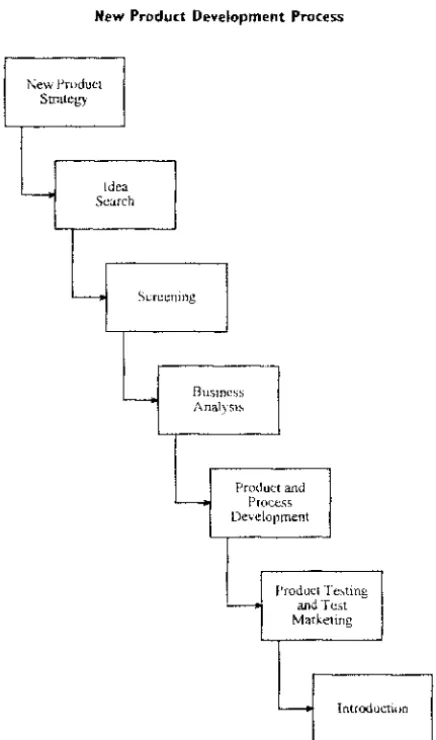
Moore and Pessemeir in "Product Planning and Management" (1993) have identified the steps in the new product development process based on work done by Booz-Allen (1982) as those shown in figure 4.2:
New Product Development Process
New Product Strategy
-
IdeaSearch
Screening
Business Analysis
Product and '----" Process
Development
Product Testing __,. and Test
Marketing
'---i Introduction
Fig. 4.2: New Product Development Process (Moore and Pessemier, 1993, p95)
Some of these steps will be seen to be intellectual and organisational rather than physical, as described by Ulrich and Eppinger ( 1995). These researchers also
[image:42.577.178.396.278.648.2]28
note that while some companies follow very precise and detailed process steps
others are quite random in their approach. This reinforces the idea that
approaches are individualised 10 match company needs and work practices. Moore and Pessemier (1993) also agreed that the best approach may not be
known in advance and defined processes need flexibility.
A well defined process however can be useful where it:
Defines checkpoints against which to measure the quality or the developing product,
Coordinates team roles,
Times phases of the project,
Compares actual events with established process thus aiding early problem identification,
Promotes ongoing process improvement over time (Ulrich and Eppinger, 1995).
The five phases or generic development processes put forward by researchers
Ulrich and Eppinger (1995) are:
C
o
n
ce
pt D
e
v
e
l
o
pm
e
/11
Identification of target market needs;
Evaluation of alternative product concepts;
Selection or product for further development;
Specification of product description;
Analysis of competing produclS;
Economic justification.
Sys
t
e
m Level De
s
ign
Definition of product architecture, sub-sys1ems, componenlS, and layout;
Preparation of a preliminary process flow diagram.
Detail Design
Complete specification of geometry and materials, tolerances, and paru sourcing;
Established process plan for fabrication is developed.
T
e
sting and R
e
fineme/11
Construction and evaluation including early proto1ypes, progressing 10 later prototype using actual parts;
Performance and reliability testing of the later prototype;
Production
Product preparation using the intended manufacturing system; Eliminating final flaws in manufacturing system and/or product.
Managing the New Product Process
Providing the new product in a timely fashion is important if value is to be created in the perception of the customer. Moore and Pessemier (1993) warn of the need to focus on development cycle time and cost management.
Management tools such as planning and process improvement can expedite a products return on investment.
Success of a New Product
Moore and Pessemier (1993) state that the most important factor determining the success of a new product is a superior value in the eyes of the customer. Superior offers are based on a new product idea that meets the needs of the market and a product that lives up to that concept.
To ensure that a new product is given every possible chance of succeeding, Moore and Pessemier (1993) have indicated that the following areas are of importance:
Initial market research to identify unfilled needs or latent problems.
An efficient product development process.
New products that fit within the company's marketing and technical capabilities.
Selection of a suitable target market.
Well-directed and funded introduction of the product into the market.
A study of failures in new products made by Cooper (1984) indicated that the reason for most failures is that several marketing activities ( eg, detailed marketing study, product testing, and test marketing) are inadequately carried out. A later study by Cooper and Kleinschmidt (1996) relates the success of individual new products to the completeness of the new product development process, and how well each of the steps were executed. Deficiencies in
30
preliminary market studies, initial screening, and detailed market analysis were
cited most frequently.
Hoo and McDonald (1983) asked respondents to indicate which activities
needed more effort in order 10 improve the new product success rate. The
activities highlighted were (in order of importance):
Market analysis and opportunity identification;
Strategy formulation;
Concept and positioning developmem;
Basic research and development (R&D);
Idea generation;
Product development and testing;
Pre-test market sales estimation;
Concept test.
During studies of companies with successful new product records, Booz-Allen
( 1982) found that they were more likely to have a formal new product
development process in place. Moore and Pessemier indicate ,hat a new product
process should act as a road map, providing direction to new product efforts. II
should remind people to go through the relevant steps in the proper order.
In figure 4.2, the process has been made to look linear and orderly. In reality,
the process is "usually quite messy" (Moore and Pesscmier, 1993, p I 03). The
linear process can also convey the false impression that one functional area
works on a part of the process and then hands its contribution off to the next
group. However, Moore and Pessemier indicate that an interfunctional group
should
be
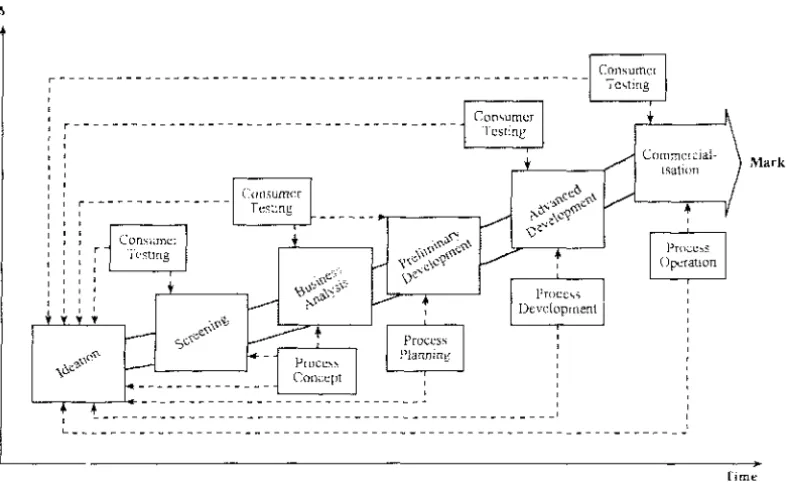
assigned to a project from start to lini.sh (ie. preliminary studies should be going on at the same time Iha, technical work is being carried out).The Booz-Allen chart shown in figure 4.3 is more consistent with the views
expressed in Moore and Pessemier (1993). The diagram shows that there is
continuous consumer testing and the manufacturing concept is being developed
New Product Development Process r--- --- r---1 I I r---r I I I I I I Consumer Testing
~~~---
---Process Planning Process Development---
---·
I isation Process Operation IL--- ---
---Fig. 4.3: New Product Development Process (Moore and Pessemier, 1993, pl03)
4.2 Consumer Studies
Market
Time
A number of studies were conducted prior to the commencement of the new FST product design in order to establish some potential user parameters. These studies were:
A related technologies questionnaire, and A focus group.
4.2.1 Related Technologies Questionnaire
A questionnaire was compiled and left in a service station for customers to complete (see appendix i). The questionnaire was targeted at potential users of the new FST. It asked them to indicate their interest and degree of use in technologies related to the proposed FST. The related technologies included:
EFTPOS,
EFTPOS at the service station, ATM (Automatic Teller Machine), Computer,
Computer based catalogues, Internet,
Self service petrol fill-up,
[image:46.575.86.479.75.316.2]32
Automatic snack/drink dispensers, Drive through at restaurants.
From the questionnaires returned, the following results were noted:
The majority of respondents expressed a high degree of both interest and use with EFTPOS and EFTPOS at service stations; The respondents were less interested in automatic teller machines than they were with EFTPOS machines, and the use of ATM's was lower than the use ofEFTPOS;
The majority of respondents indicated that they were either very interested or not interested at all in computers, the Internet, and self-service filling;
Most of the respondents indicated a high degree of interest in drive through restaurants but a low degree of use;
The degree of use for the three computer based technologies was low.
Based on the results of the questionnaire profiles of four main types of potential user were compiled as follows:
Attendant
It is assumed that an attendant will have been trained to use the equipment and technologies provided at the service station.
Keen
Confident with dispensing fuel;
Conversant with different methods of payment; Has tried to use the EFTPOS at the pump;
Would rather complete purchase themselves than let an attendant help;
Inquisitive.
Average
Are able to dispense fuel;
Has used the different methods of payment available instore; Doesn't mind if an attendant helps.
Reluctant either
or
Not conversant with all methods of payment; Able to dispense fuel;
or
4 .2.2 Focus Group
Doesn't like to dispense fuel;
A voids going to a service station if possible; Lets the attendant dispense fuel;
Conversant with different methods of payment.
Doesn't like to dispense fuel;
Avoids going to a service station if possible; Lets the attendant dispense fuel;
Not conversant with all methods of payment.
A focus group of potential users was organised. The aims behind the focus group were as follows:
To identify areas where the FST mark 3 could be used to improve the current service station environment, and
To gauge the market acceptance of the proposed FST upgrade.
Initially the group was asked if there was anything in particular that they liked or disliked at the current service stations. The comments made included:
There is a huge difference between the service they say they offer and the service they give;
Don't necessarily want the services they provide (windscreen wash, attendant...);
Waiting in a queue to pay is one of the most annoying things; Need better sign-posting of the pump numbers - when going instore to pay, you need to know what pump you used.
The group was then asked what they would like to see in their ideal service station. These were some of the responses:
Portable EFTPOS machine - don't have to get out of the car; No pumps on court, just overhead nozzles;
A parking base with mobile bowser for orders of fuel; Petrol pumps in supermarket car parks;
A service to wash hands after filling up;
Go inside and take what you want from the store, as you exit through the door the products are automatically scanned and added to your total.