Object-Oriented and Structured Methodologies
A thesis presented in partial fulfilment of the requirements for the degree of
Master of Business Studies in Information Systems at
Massey University
Michael Andrew Bailey
ABSTRACT
Maintenance has been found to be one of the most expensive phases in the life of an information system. It has been suggested that the use of object-oriented methods instead of traditional structured methods may be one way of reducing the cost of maintenance required for an information system.
This thesis is an attempt to determine whether the object-oriented approach does in fact undergo a relatively smaller increase in complexity when subjected to a change in specifications than a similar system that is developed using a "structured methodology'', and is therefore easier to maintain.
The methodologies used in this study were Yourdon's (1989) Modem Structured Methodology and Booch's (1994) Object-Oriented methodology. The analysis phase of both methodologies were applied to the same case study twice in order to evaluate the effects of a change in the system's specifications.
Once the two models for each methodology were complete, various metrics were applied to the structured system and a separate set of metrics were applied to the object-oriented system. The results of the models and the metrics were then analysed and validated in order to determine which system suffered a smaller proportional increase in complexity as a result of the changes to the system.
ACKNOWLEDGEMENTS
Firstly, I would like to thank my Thesis Supervisor, Dr. Richard (Dick) Whiddett for providing invaluable assistance and support throughout the entire preparation of this Thesis. I am very grateful for his input into this thesis.
I would like to thank Mr. Barry Jackson for letting me borrow a guide on how to use Oracle's CASE tool. Without this I would not have been able to complete the structured models. I am also grateful for being able to use the Trusty Furniture Company case study.
I would also like to thank the students who provided the two structured systems used in the validation of this study.
A special thanks to my family for putting up with me for yet another year.
Finally, I would like to thank everyone else who has helped me during the preparation of this thesis who I haven't specifically mentioned (you know who you are).
TABLE OF CONTENTS
ABSTRACT
ACKNOWLEDGEMENTS
TABLE OF CONTENTS
LIST OF FIGURES
LIST OF TABLES
1. CHAPTER 1: INTRODUCTION
2.
1.1 Background 1.2 Thesis 1.3
1.4
Methodology
Structure of the Thesis
CHAPTER 2: OVERVIEW OF MAINTENANCE AND MEASUREMENT
2.1 Introduction
2.2 Definitions of Maintenance 2.3 Definitions of Maintainability 2.4 Overview of Maintenance
2.4.1 Cost of maintenance 2.4.2 Concepts of maintenance 2.4.3 Obsolescence and maintenance
2.4.4 Strategies to remedy obsolescence 13
2.4.4.1 Restoration 14
2.4.4.2 Expansion 14
2.4.4.3 Elimination 14
2.4.4.4 Replacement 15
2.4.5 Non-monetary costs of maintenance 15
2.4.6 Types of maintenance 16
2.4.6. l Corrective maintenance 17
2.4.6.2 Adaptive maintenance 17
2.4.6.3 Perfective maintenance 18
2.4.6.4 Preventive maintenance 18
2.4.7 An alternative categorisation of maintenance 19
2.4. 7.1 Corrective maintenance 19
2.4. 7.2 Deferred maintenance 20
2 .4. 7. 3 Preventive maintenance 20
2.4. 7.4 Emergency maintenance 21
2.4. 7.5 File maintenance 21
2.4.7.6 Program maintenance 22
2 .4. 7. 7 Scheduled maintenance 22
2.5 Systems Maintenance Lifecycle 23
2.5.1 Record and assign 25
2.5.2 Analyse and approve 26
2.5.3 Design and code 26
2.5.4 Test and train 27
2.5.5 Implement and monitor 28
2.6 Measuring Maintenance 29
2.6.1 Methodology independent metrics 29
2.6.1. l Number of changes 29
3.
4.
2.7 Measuring Object-Oriented Systems 2.7.1 MOOSE
2. 7 .1.1 Weighted methods per class 2.7.1.2 Depth of inheritance tree 2. 7.1.3 Number of children 2. 7 .1. 4 Coupling between objects 2. 7.1.5 Response for a class
2. 7 .1.6 Lack of cohesion in methods 2.8 Measuring Structured Systems
2.8.1 McCabe's cyclomatic complexity 2.9 Comparisons Between the Metrics 2.10 How this Overview Relates to the Thesis 2.11 Summary
CHAPTER 3. THE CASE STUDY 3.1
3.2 3.3
Introduction
The Trusty Furniture Company Case Study
Description of the Changes Made to the Case Study
CHAPTER 4. STRUCTURED ANALYSIS DEFINITIONS AND TECHNIQUES
4.1 Introduction
4.2 Advantages of Structured Methods 4.3 Disadvantages of Structured Methods 4.4 Structured Analysis Definitions
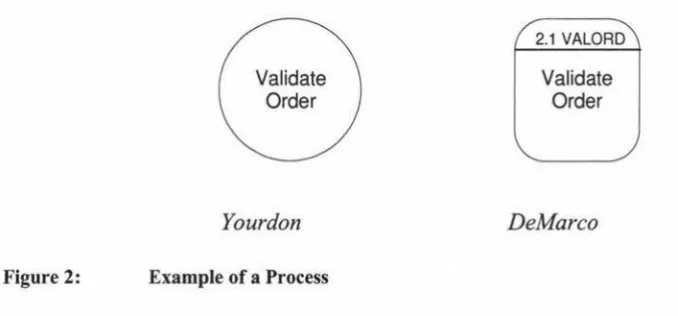
4.4.1 Processes 4.4.2 Dataflows 4.4.3 Datastores 4.4.4 Terminators 4.4.5 Entities 4.4.6 Relationships
4.5 Overview ofYourdon's (1989) Modem Structured Methodology 61
4.5.1 The dataflow diagram 62
4.5.1.1 Processes 63
4.5.1.2 Terminators 64
4.5.1.3 Datastores 65
4.5.1.4 Dataflows 65
4.5.2 The entity relationship diagram 67
4.5.2.1 Entities 67
4.5.2.2 Relationships 69
4.6 Summary 69
5. CHAPTER 5. THE CREATION OF A STRUCTURED MODEL 70
5.1 Introduction 70
5.2 Statement of Purpose 70
5.3 Event List 71
5.4 Development of an Entity Relationship Diagram 71
5.4.l Identifying the entities 72
5.4.2 Identifying the relationships 72
5.4.3 Identifying the attributes 73
5.5 Development of a Context Diagram 73
5.5.1 Identifying the external entities 73
5.5.2 Identifying the dataflows 74
5.6 Development of the Event Response Diagrams 74
5.6.l Identifying datastores 75
5.6.2 Creation of an unlevelled dataflow diagram 75
5.7 Levelling the Dataflow Diagram 76
5.7.1 Level 0 76
5.8 Implementing Changes to the System 78
5.8.1 Creating a new event 78
5.8.2 Modifying the entity relationship diagram 78
5.8.3 Modifying the dataflow diagram 79
5.8.4 Completing the changes 79
5.9 Application of Metrics to the System 80
5.9.1 Applying McCabe's cyclomatic complexity metric 80 5.9.2 Applying the coupling between objects metric 81
5.10 Summary 82
6. CHAPTER 6. OBJECT-ORIENTED DEFINITIONS AND
TECHNIQUES 84
6.1 Introduction 84
6.2 What Does Object-Oriented Mean? 84
6.3 Advantages of Object-Oriented Methods 86
6.4 Disadvantages of Object-Oriented Methods 88
6.5 Basic Object-Oriented Concepts 89
6.5.1 Objects 90
6.5.2 Classes 92
6.5.3 Types 94
6.5.4 Abstraction 95
6.5.5 Encapsulation 96
6.5.6 Inheritance 98
6.5.7 Polymorphism 99
6.6 Overview ofBooch's Methodology 100
6.6.1 Dimensions of analysis and design 101
6.6.2 Class diagrams 105
6.6.3 Object diagrams 107
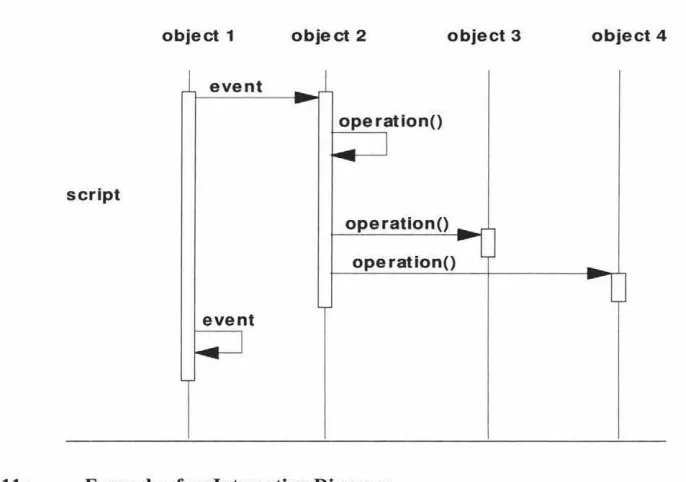
6.6.4 Interaction diagrams 109
6.7 Booch: The Rational Approach 111
6.7.1 Requirements analysis 111
6.8 Summary 113
7. CHAPTER 7. THE PROCESS OF CREATING AN OBJECT-ORIENTED
MODEL 115
7.1 Introduction 115
7.2 Development of the Initial Class Diagram 115
7.2.1 Identifying the key classes 115
7.2.2 Identifying the relationships between classes 116 7.2.2.l Identifying inheritance relationships 116 7 .2.2.2 Identifying uses relationships 117 7.2.2.3 Identifying has relationships 118 7 .2.2.4 Identifying association relationships 119
7.2.3 Defining classes and relationships 120
7.3 Development of the Interaction Diagrams 120
7.3. l Identifying classes and objects 120
7.3.2 Identifying methods 121
7.3.3 Adding scripts to the diagram 121
7.4 Development of the Object Diagrams 122
7.5 Why the Module and Process Diagrams Were Not Done 122
7.6 Checking the Model for Consistency 123
7.7 Making Changes to the Object-Oriented System 123 7.7.1 Modifying the system function statement 123 7.7.2 Identifying the new classes and relationships 124
7.7.3 Creating a new interaction diagram 125
7.7.4 Generating a new object diagram 125
7.8 Applying the MOOSE Metric Set 126
7.8.1 Depth of inheritance tree 126
7.8.2 Number of children 127
7.8.3 Weighted methods per class 128
7.8.4 Coupling between objects 129
7.8.5 Response for a class 130
8.
7.9 Applying MOOSE to the Modified System 7 .10 Summary
CHAPTER 8. RESULTS 8.1 Introduction
8.2 How Comparisons Were Made 8.3 Structured Results
8.3. l Complexity of the dataflow diagram
8.3.1.1 Analysis of the dataflow diagram results 8.3.2 Complexity of the entity relationship diagram
8.3.2.1 Analysis of the entity relationship diagram results 8.4 Object-Oriented Results
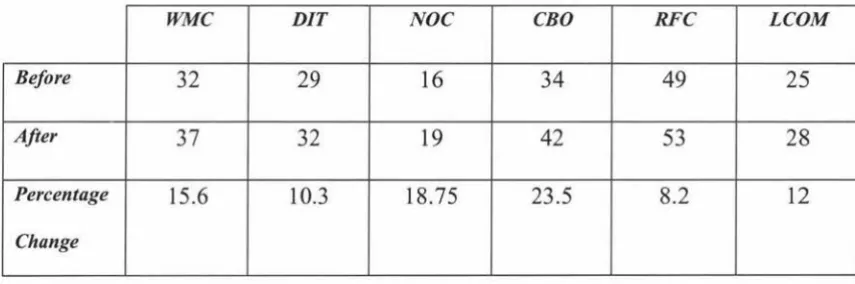
8.4.1 Analysis of the weighted methods per class results 8.4.2 Analysis of the depth of inheritance tree results 8.4.3 Analysis of the number of children results 8.4.4 Analysis of the coupling between objects results 8.4.5 Analysis of the response for a class results
8.4.6 Analysis of the lack of cohesion in methods results
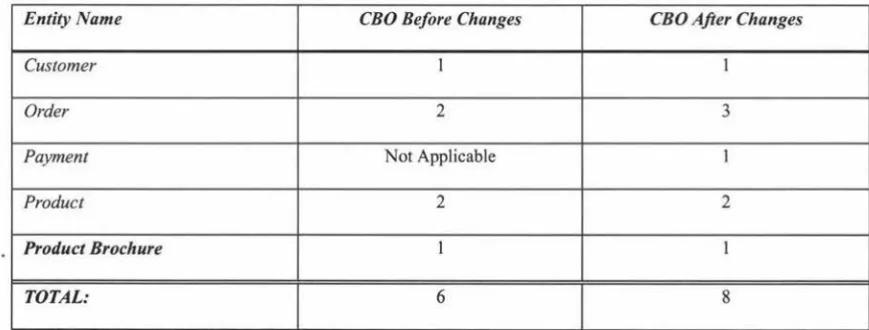
8.5 Comparisons Between the Structured and Object-Oriented Models 8.5.1 Comparisons between the coupling between objects results 8.5.2 Comparing coupling between objects on an individual basis 8.6 Validation of the Metrics Used in this Study
8.6.1 Structured metrics validation 8.6.1.1 Dataflow diagrams
8.6.1.2 Entity relationship diagrams 8.6.2 Object-oriented metrics validation 8.7 Model Validation
8.7.1 Structured model validation
8. 7 .1.1 Dataflow diagram validation
8. 7 .1.2 Entity relationship diagram validation 8.7.2 Object-oriented model validation
8.8 Summary
9. CHAPTER 9. DISCUSSION 9.1 Introduction
9.2 Depth of Model Development
9.3 Weighting Many-to-Many Relationships
9.4 GQM
9.4.1 Goal 9.4.2 Question 9.4.3 Metric 9.5 Alternative Metrics
9.5.l Token counts
9.5.2 Information flow complexity 9.6 Problems With the Study
9.7 Discussion of Results 9.8 Summary
10. CHAPTER 10. CONCLUSIONS AND FUTURE WORK 10.1 Conclusions
10.2 Future Work
11. APPENDICES
APPENDIX A: Outputs from Structured Model Before Changes APPENDIXB: Outputs from Structured Model After Changes APPENDIXC: Structured Model Metric Results
APPENDIXD: Structured Model Validation Results
APPENDIXE: Outputs from Object-Oriented Model Before Changes
APPENDIXF: Outputs from Object-Oriented Model After Changes
APPENDIXG: Object-Oriented Model Metric Results APPENDIXH: Object-Oriented Model Validation Results APPENDIX I: Comparison of CBO Results on an Individual
LIST OF FIGURES
Figure 1: The Systems Maintenance Life Cycle 23
Figure 2: Example of a Process 63
Figure 3: Example of an External Entity 64
Figure 4: Example of a Datastore 65
Figure 5: Example of a Dataflow 66
Figure 6: Example of a Composite Dataflow 66
Figure 7: Example of an Entity 68
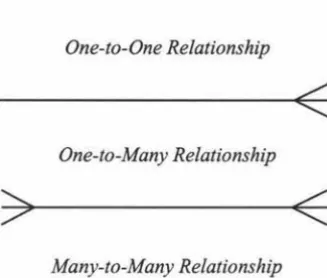
Figure 8: Example of the Notations Used to Represent a Relationship in
this Study 69
Figure 9: The Models of Object-Oriented Development 101
Figure 10: Class Icon 106
Figure 11: Example of an Interaction Diagram 110
Figure 12: The Inheritance Relationship 117
Figure 13: The Uses Relationship 118
Figure 14: The Has Relationship 119
Figure 15: The Association Relationship 120
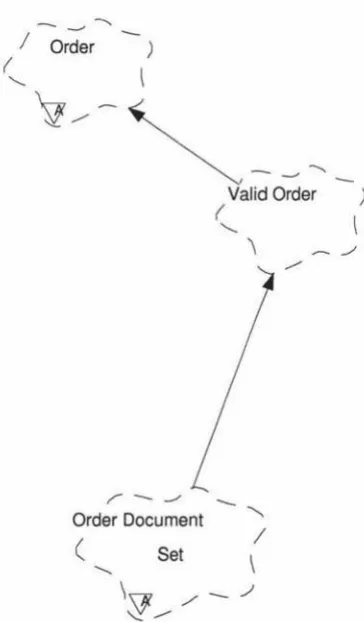
Figure 16: Depth oflnheritance Tree for the class Order Document Set 127
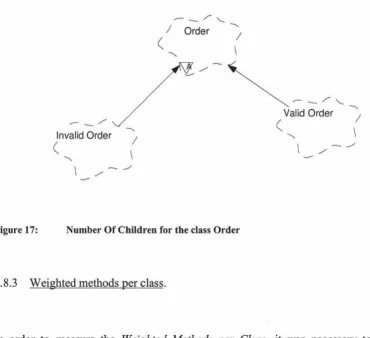
Figure 17: Number Of Children for the class Order 128
Table 1: Table 2: Table 3: Table 4: Table 5: Table 6: Table 7: Table 8: Table 9: Table 10:
LIST OF TABLES
Results of McCabe's Complexity Metric Before and After Changes
Were Made to the Structured Model 136
Results of the Coupling Between Objects Metric Applied to the Entity Relationship Diagram Before and After Changes Were Made to the
Structured System 138
Summary of the Results From the MOOSE Metric Set Before and After Changes Were Made to the Object-Oriented Model 142
Results of McCabe's Complexity Metric After Being Applied to the Student Models in Comparison to the Trusty Furniture Company's
Order Processing System 158
Results of the Coupling Between Objects Metric After Being Applied to the Student Models in Comparison to the Trusty Furniture Company's
Order Processing System 160
Summary of the Results From the Application of the MOOSE Metrics to Booch's (1994) Ordering System in Comparison to the Trusty Furniture Company's Order Processing System 161
Summary of the Terminators Used on the Context Diagram 164
Summary of the Processes Used on the Lowest Level of the Dataflow
Diagrams 166
Summary of the Entities Used in the Entity Relationship Diagrams 170
1.1. Background
A common idea among many authors in the object-oriented field is the claim that an object-oriented system should be more maintainable since object-oriented systems are generally less complex than similar systems developed using a structured methodology. For example, Meyer (1981) says that "apart from its elegance, such modular object-oriented programming yields software products on which modifications and extensions are much easier to perform than with programs structured in a more conventional procedure-oriented fashion" (p.178). A further illustration is provided by Henry and Humphrey (1994) who showed that ''building applications with object-oriented languages (like C++ or Objective C) results in final systems that are much more maintainable than systems constructed with procedural languages (like Pascal or C)" (p.2).
1.2. Thesis
This project is designed to find out whether an object-oriented system does in fact undergo a relatively smaller increase in complexity when subjected to a change in
specifications than a similar structured system, and is therefore easier to maintain.
Thus, this study is more interested in the models of the system that are developed as a result of the analysis using both an object-oriented methodology and a structured methodology. The reason that this study was limited to the systems analysis phase rather than including the design phase is because the analysis phase is capable of showing a view of the system that is unaffected by physical implementation issues. Had the design phase been included, then these physical problems with the implementation of the system could colour the results. Thus, by using only the analysis phase it was possible for this study to effectively show the effects of a change on the systems complexity.
1.3. Methodology
The hypothesis was tested by applying a number of different metrics that were designed to measure the complexity of a system to an initial model and then to a model which has been modified. It was decided to use Yourdon's (1989) Modem Structured methodology to model the structured system and Booch's (1994) Object-Oriented methodology to model the object-oriented system. The reason that these methodologies were chosen was due to previous experience in both methodologies.
One set of metrics was applied to the structured models, and another set of metrics was then applied to the equivalent object-oriented models of the same system.
McCabe's (1976) Cyc/omatic Complexity metric and a modified version of Chidamber and Kemerer's (1994/1991) Coupling Between Objects metric were used to measure the complexity in the structured model because both of these metrics were capable of being applied to either a dataflow diagram or an entity relationship diagram.
Similarly, Chidamber and Kemerer's (1994/1991) MOOSE metric suite was used to measure the complexity of the object-oriented models. The ability of the metric to be applied to a diagram rather than to program code was an important consideration in this study, since only the diagrams produced as a result of the analysis phase were studied.
The reason that different metrics were used is that currently there are no specific metrics that can be applied to both structured and object-oriented systems. That is, the metrics are methodology specific, so a structured metric cannot be applied to an object-oriented system for example. Thus, it is necessary to convert the change in complexity results into a percentage value to facilitate comparisons between the structured and the object-oriented models.
Furthermore, an attempt was made to validate the models that have been developed in this study since the actual models were not implemented. Each of the models were validated by comparing the similarities between the models developed in this study to the models developed by the extramural students and Booch (1994).
Finally, the results of the change in complexity from the structured system were compared with the object-oriented results on a percentage change basis. The results of this comparison helped to enable a conclusion to be reached as to whether the structured system or the object-oriented system underwent a relatively smaller increase in complexity when subjected to modification, and therefore which approach delivered systems that are easier to maintain on a long term basis.
Since this study followed a case study approach it is fair to say that the results obtained here are specific to the case study used to develop the models in this study. Despite this, it may be possible to draw some general con~lusions which may be able to be applied to other systems.
1.4. Structure of the Thesis
The following chapter will focus on what was done in order to create the structured models in this study as well as how the metrics were applied to the structured models.
Many of the object-oriented definitions and techniques will be introduced in the next chapter along with an overview of Booch's (1994) methodology. Following this, a discussion on what was done in order to create the object-oriented models will be given, along with an overview of how the MOOSE metric set was applied to the object-oriented models.
CHAPTER 2: OVERVIEW OF MAINTENANCE AND MEASUREMENT
2.1. Introduction
This chapter is intended to give an overview of maintenance, the methods of measuring maintenance, and some of the concepts covered by both of the methodologies which were used to create the system which was used to test maintainability. In addition, this chapter attempts to define and justify the purpose of this thesis.
2.2. Definitions of Maintenance
Software maintenance appears to have several similar meanings. The previous statement is supported by the number of similar definitions of software maintenance in the literature. One such definition is given by Schneidewind (1987), who defines maintenance as the "modification of a software product after delivery to correct faults, to improve performance or other attributes, or to adapt the product to a changed environment" (p.303).
It can be seen from the definitions given by Schneidewind (1987) and the United States
National Bureau of Standards (1993) that some similarities exist in these two definitions. For instance, both Schneidewind (1987) and the United States National Bureau of Standards (1993) refer to the idea of making changes to the software after it has been accepted. Both authors also refer to the idea of modifying the software in order keep it operational and responsive to changes in the system's environment. While this is not an exhaustive list of definitions, it does demonstrate that there are a number of similar definitions that exist for software maintenance.
In comparison to the previous definitions of maintenance, Booch ( 1994) argues that "it is maintenance when we correct errors; it is evolution when we respond to changing requirements" (p.6). Thus, many definitions of maintenance including the above definitions, describe what should really be known as evolution as they are concerned with improving the software over time rather than fixing errors.
2.3. Definitions of Maintainability
Maintainability is another concept which needs to be defined as it differs from the concept of maintenance. Maintainability is defined by Schneidewind ( 19 8 7) as being "the ease with which a software system can be corrected when errors or deficiencies occur, and can be expanded or contracted to satisfy new requirements" (p.303). Based on Schneidewind's (1987) definitions of maintenance and maintainability, it appears that the main area in which maintainability differs from maintenance is that maintenance refers to the actual process of modifying the software, whereas maintainability appears to refer to the ease with which these modifications take place. Thus, Schneidewind (1987) implies that maintainability is concerned with the level of maintenance that is needed in order to modify the software in such a way as to meet the new requirements.
Sharble and Cohen (1993) state that "a software system is maintainable if it can be modified to adapt to external changes, such as changes in hardware or operating systems, or to correct deficiencies and improve performance" (p.61 ). Further to this, in order "to achieve a high degree of maintainability, a system should have weak coupling between parts and have interactions that rely only on the external interfaces of those parts" (Sharble and Cohen, 1993, p.61). This definition is similar in many ways to the previous definitions of maintenance as put forward by Schneidewind (1987) and the United States National Standards Bureau (1993) especially in terms of the ideas relating to the ability to modify the system to adapt to changes and to improve performance. Sharble and Cohen's (1993) definition of maintainability also shares some similarities with those of Schneidewind (1987) and Card and Glass (1990) in that it refers to the processes which are synonymous with maintainability. An example of one of these processes is the process of modifying the system.
Pickard and Carter (1993), claim that "the consensus seems to be that maintainability can
be thought of as consisting of three attributes: understandability, modifiability, and
testability" (p.A-36). Such a statement appears to include most of the aspects that the
other definitions discussed here covered.
2.4. Overview of Maintenance
This section will give a brief overview of a number of important areas in maintenance.
2.4.1 Cost •f maintenance.
Maintenance is an important part of a system's lifecycle, however it is also one the most
expensive areas of a system's lifecycle. The previous statement is supported by Harrison
et al. ( 1982) who state that "recent estimates suggest that about 40 to 70 percent of
annual software expenditures involve maintenance of existing systems" (p.65). A further example of the cost of maintaining a system is given by Yau and Collofello ( 1985) who
say that the cost of maintenance activities ranges "from 40 percent to 80 percent of the
total cost during the lifecycle of a large scale software system" (p.849).
Burch (1992) says that "the cost of maintenance has increased steadily in the past 25
years.... Some organisations spend 80 percent or more of their systems budget on
software maintenance" (p. 786). Thus, it is generally agreed that maintenance contributes
Burch (1992) gives one reason as to why maintenance costs so much of an organisations system budget. "One of the major reasons why systems maintenance takes such a large bite out of the systems budget is because of the excessive effort spent on trying to maintain poorly structured and documented software" (Burch, 1992, p. 789).
Such a statement suggests that if an organisation wants to reduce the amount that it spends on systems maintenance, then it would be wise to spend more time structuring and documenting the software during the development of the system. Thus, rather than viewing maintenance as an afterthought, developers need to build maintainability into the analysis and design phases of the Systems Development Life Cycle (SDLC) rather than waiting till after the system is implemented.
2.4.2 Concepts of maintenance.
Thus, the extra time which is needed to enhance the systems results in further maintenance costs. Developers could follow an approach similar to Total Quality Management (TQM) whereby they attempt to do things "right the first time", thus lessening the need for costly maintenance at a later stage in the information system's life. In this case, it would be necessary to extensively involve the users in the development process in order to reduce the number of changes that may be needed at a later stage.
2.4.3 Obsolescence and maintenance.
Despite the previous statement, it must be noted that it is not possible to completely eliminate the need for maintenance as a result of changing user needs, as to do so would lead to an obsolete system that would be of no value to the users. While maintenance may be a burden on an information system's budget, it is a necessary burden, as without maintenance, an information system would cease to evolve.
Further to the previous point, Fournier ( 1991) goes on to say that "this might be especially true if the maintenance process has not been performed in a controlled and rigorous manner" (p.230). Thus, it is important to control and monitor the maintenance process in order to limit the effects of obsolescence on the information system.
Obsolescence is inevitable for all information systems no matter how good their maintenance programme is. According to Fournier (1991) "there are two types of obsolescence: functional and technological" (p.230). In order to better understand obsolescence it is necessary to define both types of obsolescence. "Functional obsolescence arises when the system no longer adequately fulfils its mission or the business environment has evolved so drastically that the original mission no longer holds true in light of the new business functions that must now be supported" (p.230). In comparison, "technological obsolescence occurs when the technology that was used to implement the system becomes inefficient, unreliable, and outdated" (Fournier, 1991, p.230). Thus, it can be seen from these two definitions that there are a large number of factors which can contribute to the obsolescence of an information system.
2.4.4 Strategies to remedy obsolescence.
2.4.4.1 Restoration.
Restoration "entails correcting technical deficiencies while maintaining the status quo on the functions supported by the system" (Fournier, 1991, p.230). Thus, the restoration process is used to optimise the system in order to help it make more efficient use of the technology that the system was implemented with.
2.4.4.2 Expansion.
According to Fournier (1991) "the expansion process entails the addition of new functions around or as a front end to the current system while maintaining the status quo on the technical architecture surrounding the system" (p.230). Thus, the expansion process is used in order help the information system evolve as a result of changing user requirements. Unlike, the restoration process which concentrates on making changes to the technology, the expansion process is more concerned with making changes to the functions in the system. Therefore, the expansion process is an attempt to reduce the problem of functional obsolescence.
2.4.4.3 Elimination.
Such a strategy is of obvious use when a system is considered to be obsolete and it no longer supports the business functions of the organisation.
2.4.4.4 Replacement.
The final strategy which was put forward by Fournier (1991) is that of the replacement strategy. According to Fournier (1991), "the existing system is replaced by acquiring a commercial package or building a new application in-house" (p.231 ). Such a replacement strategy would be of use to an organisation where the existing system has evolved to such an extent that the entire system needs to be replaced. Thus, the use of this strategy would effectively mean the end of the current systems life.
Both the elimination and the replacement strategies appear to be designed to combat both technological and functional obsolescence as they both lead to the end of the current systems useful life.
2.4.5 Non-monetary costs of maintenance.
In a situation such as the one described in the previous sentence, "any change has unforeseen consequences which often cause problems elsewhere, annoy users, and waste precious personnel resources" (Martin and McClure, 1983, p.8). The opportunity cost in this situation is that by choosing to forego the maintenance, the organisation does not get the full benefit of its system. Thus, it can be said that, "computers offer the promise of enormous improvements in business efficiency.... However, the promise will not be fulfilled unless the best techniques are used for achieving maintainability" (Martin and McClure, 1983, p.8).
2.4.6 Types of maintenance.
A common theme in much of the literature written on software maintenance is the distinction between several specialised types of maintenance. An example of this distinction is given by Burch (1992) who categorises maintenance "into the following four types:
• Corrective maintenance • Adaptive maintenance
2.4.6.1 Corrective maintenance.
The first type of maintenance that will be defined is that of corrective maintenance. According to Burch (1992), "corrective maintenance is the less noble and more burdensome part of systems maintenance, because it corrects design, coding, and implementation errors that should never have occurred" (p.786). The need for such maintenance can usually ''be traced back to poor application of the Systems Development Life Cycle" (Burch, 1992, p.786). Swanson (1976) on the other hand, provides a simpler definition of corrective maintenance by saying that it deals "with failures in processing, performance, or implementation" (p.4).
2.4.6.2 Adaptive maintenance.
2.4.6.3 Perfective maintenance.
Perfective maintenance is the third type of systems maintenance that is performed. In simple terms, "perfective maintenance enhances performance or maintainability" (Burch,
1992, p. 787). Perfective maintenance also allows the system to meet user requirements that were unrecognised before (Burch, 1992). Thus, this type of maintenance is an
attempt to "perfect" the system, so that it is easier to maintain in the future as well as
making the system perform better both in the present and in the future. An example of what activities take place during this type of maintenance is given by Burch (1992), who
says that "this maintenance activity may take the form of reengineering or restructuring software, rewriting documentation, altering report formats and content, defining more
efficient processing logic, and improving equipment operating efficiency" (p. 787).
2.4.6.4 Preventive maintenance.
The final type of maintenance is preventive maintenance. This type of maintenance is an attempt to purge any potential problems from the system before they occur. According to Burch (1992) "preventive maintenance consists of periodic inspections and reviews of
the system to uncover and anticipate problems" (p. 788). Further to this, Burch (1992)
2.4.7 An alternative categorisation of maintenance.
An alternative to Burch's (1992) categorisation of maintenance is given by Perry (1981).
Perry's (1981) defines seven different types of maintenance. The seven types of
maintenance are:
•
Corrective maintenance•
Deferred maintenance•
Preventive maintenance•
Emergency maintenance•
File maintenance•
Program maintenance•
Scheduled maintenance .2.4. 7 .1 Corrective maintenance.
As with Burch (1992) and Swanson (1976), Perry (1981) includes corrective
maintenance in his classificatic:m of the types of maintenance. Perry ( 1981) defines
corrective maintenance to be "maintenance that is conducted for the purpose of
eliminating and existing error or problem" (p.1 ). This definition is similar to the
definitions given by Burch (1992) and Swanson (1976), in that it deals with the concept
2.4.7.2 Deferred maintenance.
Deferred maintenance is "maintenance that is needed but is postponed until appropriate resources are available" (Perry, 1981, p.1 ). This is one of the classification which does not seem to have an equal in the types of maintenance put forward by Burch (1992) and Swanson (1976). Such a categorisation takes into account that an organisation may not be able to afford to use valuable resources to fix small problems due to various constraints at a particular point in time. Thus, the organisation's management are able to make a decision to defer the maintenance until the necessary resources are available. It is important to note that such maintenance must be done at some time in the future and not just left to be forgotten about. The reason for the previous statement is that otherwise the system will end out with of a lot of smaller problems that tum into a larger problem which may require what Perry ( 1981) calls emergency maintenance.
2.4.7.3 Preventive maintenance.
The example given by Perry (1981) suggests that the problem can be identified by similar problems occurring in other systems. Such problem identification can be seen as a way of learning from the mistakes of others. This definition of preventive maintenance is indeed the same as that put forward by Burch (1992) as it tries to remove the possibility of the problem occurring in the system. Thus, it appears as though there is a general agreement amongst the authors in this area of maintenance, as there is a standard definition for preventive maintenance.
2.4.7.4 Emergency maintenance.
Emergency maintenance is defined by Perry (1981) as being ''unscheduled maintenance that is designed to eliminate a current problem situation which has stopped or otherwise affected successful operation of the application" (p.1 ). Emergency maintenance is in some ways similar to parts of Burch's (1992) and Swanson's (1976) corrective maintenance. An example of this is given by Burch (1992), who says that "corrective maintenance usually involves an urgent or emergency condition that calls for immediate attention" (p. 786).
2.4.7.5 File maintenance.
This type of maintenance can be compared to perfective maintenance as described by Burch (1992) and Swanson (1976) because it is concerned with trying to "perfect" the system so that it will work without any problems at all. However, Perry (1981) considers maintenance of the system specifications as a separate form of maintenance as will be seen in the next definition.
2.4.7.6 Program maintenance.
Program maintenance is defined as "the addition, modification, or deletion of program instructions" (Perry, 1981, p.l). This form of maintenance is similar to Perry's (1981) file maintenance category except it is more concerned with "perfecting" the actual program
rather than the specifications of the system. It is important to note that Perry (1981) makes a distinction between these two forms of maintenance rather than grouping them together under the title of perfective maintenance, as is the case with Burch ( 1992) and Swanson (1976).
2.4.7.7 Scheduled maintenance.
Scheduled maintenance appears to be similar to what Burch (1992) calls preventive maintenance as scheduled maintenance also involves the inspection of the system in order to anticipate any problems that might occur. Where these two types of maintenance differ, is that according to Burch (1992), preventive maintenance only inspects and reviews the system in order to uncover problems, whereas scheduled maintenance appears to involve both the inspection and the review as well as the correction of the problem. Thus, preventive maintenance does not appear to try to correct any of the problems that it finds. Instead, preventive maintenance is designed to identify the problems rather than fix them.
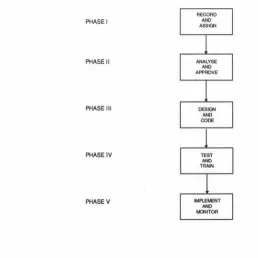
2.5. Systems Maintenance Lifecycle
The systems maintenance lifecycle is a series of five steps that are designed to "improve systems maintenance" (Perry, 1981, p.58). An example of the systems maintenance lifecycle is given below in figure 1.
PHASE I
PHASE II
PHASE Ill
PHASE IV
PHASEV
RECORD AND
ASSIGN
[image:38.564.141.400.472.730.2]IMPLEl.ENT AHO MJNITOR
According to Perry (1981), the "main advantages of the life cycle concept are that the process is subdivided into identifiable and measurable parts .... Prior to the development of the life cycle concept, systems maintenance frequently flowed unchecked.... There were no clear checkpoints; thus, it was difficult to measure progress" (p.58).
While the previous statement suggests that using the systems maintenance life cycle helps an organisation to monitor the maintenance which is being carried out, Perry (1981) notes that "a major argument against using the life cycle concept in systems maintenance is that the size of the change may not warrant the administrative effort" (p.58). Thus, the argument against the use of the lifecycle concept is that if only a small amount of maintenance is required, then it may not be worth the effort of the organisations management to implement the systems maintenance life cycle.
Such a statement suggests that no matter how small and insignificant the maintenance appears to be, it is always a good idea to use the systems maintenance life cycle concept which was put forward by Perry ( 1981) as it will help an organisation to monitor the progress of the maintenance which is being carried out. Such monitoring will also help to reduce costs, as the monitoring of the maintenance will help to ensure that resources are efficiently and effectively spent.
In order to be able to understand the systems maintenance life cycle it is necessary to define the processes which occur in each of the five phases. The first of these phases to be defined is phase one which is to record and assign changes.
2.5.1 Record and assign.
2.5.2 Analyse and approve.
Following the first phase, the second phase of the systems maintenance life cycle consists of analysing and approving the solution to the problem previously identified in phase one. According to Perry (1981), "the analysis process identifies the solution and estimates the time and effort required to implement that solution" (p.60). Once this analysis has been conducted, then the proposed solution is presented to the organisation's management. "At this point management must decide whether or not to implement the proposed solution" (Perry, 1981, p.60).
2.5.3 Design and code.
2.5.4 Test and train.
The fourth phase in the systems maintenance life cycle is to test the solution and train those end-users that will be affected by the changes to the system. Perry (1981) says that, "traditionally, management has been concerned about testing during systems maintenance .... The dilemma confronting project personnel is making a tradeoff between testing in ideal circumstances and not testing at all" (p.60). Therefore, management must make clear policies for the organisation in regard to their position on testing during systems maintenance. Such policies will empower the project personnel to make decisions on how much testing is needed for specific maintenance jobs.
However, despite the previous point, Perry (1981) states that "too frequently, individual programmers have made testing decisions without referring to department policy" (p.60). Thus, individuals have made important decisions that affect the outcome of the maintenance without consulting the other members of the project personnel. Therefore, it is important for an organisations management to actively encourage all members of the project personnel to discuss how much testing should be done in accordance with the guidelines that have been provided by management.
Thus, if the application that is being maintained causes a change in the reports that are produced or the procedures that need to be followed, then it is desirable that those personnel who are affected by the changes receive some form of training. Such training will enable these personnel to perform their functions at an optimum level.
2.5.5 Implement and monitor.
The final phase in the systems maintenance life cycle is to implement and monitor the changes that have been made during the previous phases. "Implementation of a change subjects an organisation to some new risks .... The first risk is that the change will not be implemented correctly and thus will not produce the necessary results; the second risk is that once implemented the change will also impact the unchanged segment of this or another application system, resulting in unanticipated new problems" (Perry, 1981, p.60).
2.6. Measuring Maintenance
There are several possible ways of measuring the level of maintenance needed by a system. The methods used to measure maintainability vary depending on the type of development method used. Thus, systems developed using a structured methodology will use a metric for measuring maintainability in a structured system, whereas a system developed with an object-oriented methodology will generally use an object-oriented maintainability measure. There are some exceptions to this rule however.
2.6. l Methodology independent metrics.
These particular types of metrics are able to be used on a wide variety of systems without having to be concerned with the methodology used to develop these systems.
2.6.1.1 Number of changes.
The idea of measuring maintainability by making comparisons based on the number of changes is also put forward by Clapp et al. (1995). However, unlike Eid and Rose (1996), Clapp et al. (1995) expand this idea further by making a wide variety of comparisons. Clapp et al. (1995) note that "metrics that were used during development may be used again during maintenance for comparison purposes (e.g., measuring the complexity of a module before and after modification)" (p.279). By using such metrics it is possible to find where the maintenance problems are originating from. Thus, it would be possible to highlight specific areas that needed improvement during the development of the system.
2.6.1.2 Other methods.
In terms of metrics used to measure changes made during maintenance, Clapp et al.
2.7. Measuring Object-Oriented Systems
In terms of metrics for object-oriented systems, Sharble and Cohen (1993) state that
"metrics could be based on either objects or classes" (p.67). The first reason for this is
that "since objects are the components of the system that exist when the system is
actually running, metrics based on objects would be influenced by the conditions of
execution, and therefore the measurements must be made empirically" (Sharble and
Cohen, 1993, p.67). Thus, by observing and experimenting with an object-oriented
system, it is possible to make a series of measurements relating to the way that the
system runs under a variety of conditions. Such a method could also be applied to a wide
variety of structured systems as well, thus, enabling some level of comparison between
the two types of systems in terms of performance.
Sharble and Cohen (1993) also argue that metrics that are based on classes, do not
measure any particular execution of the system, instead they produce a measurement that
applies to all possible scenarios of execution. Further to the previous statement, Sharble
and Cohen (1993) state that "since classes are formal descriptions, measurements can be
produced deductively from an analysis of the design of the system .... Whereas, objects
are the components that exist at run-time, classes are the components that exist during
maintenance, and are the units of extension and reuse" (p.67). Thus, it can be concluded
that it is better to use classes as a basis for measuring maintainability in an
object-oriented system as the use of classes help to give a result which is unaffected by the
2.7.1 MOOSE.
The most common metric for object-oriented systems is the Metric for Object-Oriented
Software Engineering (MOOSE) metric as proposed by Chidamber and Kemerer (1994,
1991 ). The MOOSE metric suite consists of six design metrics which have been designed
to measure a number of common areas in the design of an object-oriented system. The
six metrics proposed by Chidamber and Kemerer (1994) are as follows:
• Weighted Methods per Class (WMC)
• Depth of Inheritance Tree (DIT)
• Number of Children (NOC)
• Coupling between Object Classes (CBO)
• Response for a Class (RFC)
• Lack of Cohesion in Methods (LCOM)
In order to be able to fully understand the relevance of these metrics to maintenance it is
necessary to explain each of the metrics in the MOOSE metric suite.
2. 7 .1.1 Weighted methods per class.
The first of the metrics described by Chidamber and Kemerer (1994) is that of the
According to Chidamber and Kemerer (1994) "since methods are properties of object classes and complexity is determined by the cardinality of its set of properties.... The number of methods is, therefore, a measure of class definition as well as being attributes of a class, since attributes correspond to properties" (p.482).
An alternative definition of this metric is given by Sharble and Cohen (1993) who state that "the complexity of a class is given by the complexity of its attributes and its methods .... Weighted methods per class is the sum of the complexities of the methods of a class" (p.67).
There are a number of reasons why the Weighted Methods per Class metric is important. The first of these reasons is that "the number of methods and the complexity of methods involved is a predictor of how much time and effort is required to develop and maintain the class" (Chidamber and Kemerer, 1994, p.482). This is the main reason that this metric is important to maintenance. Because it is possible to predict the level of maintenance needed on a class by using the Weighted Methods per Class metric, it is
therefore possible to modify the class in order to minimise the level of maintenance needed.
Thus, the Weighted Methods per Class metric is useful in determining the number methods in a class and therefore, the effects that any maintenance will have on a class and its children.
Finally, the third reason is that "classes with large numbers of methods are likely to be more application specific, limiting the possibility of reuse" (Chidamber and Kemerer, 1994, p.482). In terms of maintenance, such a metric is important because it can be used to determine the level of maintenance needed by each class as well as the effect of any maintenance on other classes (children) that inherit the characteristics of that class (parent).
2. 7 .1.2 Depth of inheritance tree.
The second metric proposed by Chidamber and Kemerer (1994) is the Depth of
Inheritance Tree (DIT). According to Chidamber and Kemerer (1994), "depth of
Chidamber and Kemerer (1994) give several reasons why the Depth of Inheritance Tree
· metric is used. The first of these reasons is that "the deeper the class is in the hierarchy, the greater the number of methods it is likely to inherit, making it more complex to predict its behaviour" (Chidamber and Kemerer, 1994, p.483).
Another reason that the Depth of Inheritance Tree metric is used is that "deeper trees constitute greater design complexity, since more methods and classes are involved" (Chidamber and Kemerer, 1994, p.483). Finally, the third reason that the Depth of Inheritance Tree metric is used is that "the deeper a particular class is in the hierarchy, the greater the potential reuse of inherited methods.
2.7.1.3 Number of children.
The third metric which is described by Chidamber and Kemerer ( 1994) is that of the Number of Children (NOC). Chidamber and Kemerer (1994) state that the Number of
Children metric "is a measure of how many subclasses are going to inherit the methods
of the parent class" (p.485).
In comparison, Sharble and Cohen (1993) say that the "Number of Children for a class is the number of its immediate sub-classes" (p.67). Further to the previous point, "this is an indication of the potential influence a class can have on the system" (Sharble and Cohen, 1993, p.67). Thus, both of these definitions complement each other, as Sharble and Cohen's (1993) definition expands on Chidamber and Kemerer's (1994) definition by stating the influence that the number of children can have on the system as a whole.
The viewpoints discussed above help to demonstrate a number of points that will affect the eventual maintenance of the system. The main point that is mentioned by Chidamber and Kemerer is that of an increased use of reuse. More reuse will help to reduce the level of maintenance needed over time as the number of faults in a class are eventually fixed.
Further to the previous point, the Number of Children metric "is a measure of the breadth of the inheritance hierarchy, and the Depth of Inheritance Tree metric is a measure of its depth .... Generally, it is better to have depth than breadth, since this promotes reuse and reduces redundancy in the system" (Sharble and Cohen, 1993, p.72).
This comparison with the Depth of Inheritance Tree metric shows that the use of the Number of Children metric can help developers avoid a wide breadth in the inheritance
hierarchy, thus allowing the developers to design systems that increase the level of reuse. The other major point is that the greater the number of children the greater the need for testing, which could also translate into a greater need for maintenance as an increased number of children will increase the complexity of the system.
2. 7 .1.4 Coupling between objects.
The fourth metric provided by Chidamber and Kemerer (1994) is that of the Coupling Between Object classes (CBO). "Coupling between objects for a class is a count of the
This definition is expanded on by Sharble and Cohen (1993) who say that "coupling can exist between classes that are not related through inheritance .... One class is coupled to another if its methods use the methods or attributes of the other class" (p.67).
According to Chidamber and Kemerer (1994) "excessive coupling between object classes is detrimental to modular design and prevents reuse .... The more independent a class is, the easier it is to reuse it in another application" (p.486). Further to the previous statement, Chidamber and Kemerer ( 1994) also state that "in order to improve modularity and promote encapsulation, inter-object class couples should be kept to a minimum .... The larger the number of couples, the higher the sensitivity to changes in other parts of the design, and therefore maintenance is more difficult" (p.486). The previous statement reinforces the idea that changes made in a parent class will have an effect on any of the parents children as a result of inheritance. In addition, it is obviously to the developers benefit if the system is designed to be reusable as it means that any subsequent systems can be built from components which have been thoroughly tested and are therefore less likely to require extensive maintenance.
2. 7 .1. 5 Response for a class.
The fifth metric proposed by Chidamber and Kemerer (1994) is that of the Response For a Class (RFC) metric. Sharble and Cohen (1993) state that "the response for a class is
Chidamber and Kemerer (1994) propose several reasons why the Response For a Class metric is needed. The first of these reasons is that "if a large number of methods can be invoked in response to a message, the testing and debugging of the class becomes more complicated since it requires a greater level of understanding on the part of the tester" (Chidamber and Kemerer, 1994, p.487). The second reason is that "the larger the number of methods that can be invoked from a class, the greater the complexity of the class" (Chidamber and Kemerer, 1994, p.487).
The above reasons show that the more methods are involved, the more complicated the class gets. Therefore, as the complexity of the class increases, maintenance will become more difficult.
2.7.1.6 Lack of cohesion in methods.
The final metric proposed by Chidamber and Kemerer (1994) is that of the Lack of
Cohesion in Methods (LCOM) metric. Sharble and Cohen (1993) say that "this metric
Further to the previous point, "the cohesion of the methods in a class increases with the degree of their similarity.... Methods are more similar if they operate on the same attributes" (Sharble and Cohen, 1993, p.67). Chidamber and Kemerer (1994) expand this definition further by saying that the Lack of Cohesion in Methods metric is "tied to the instance variables and methods of a class, and therefore is a measure of the attributes of an object class" (p.489). Thus, this metric differs from the previous metrics as it concentrates on measuring the attributes rather than the class itself.
One of the main reasons that the Lack of Cohesion in Methods metric is important is that
2.8. Measuring Structured Systems
2.8.1 McCabe's cyclomatic complexity.
One of the methods used for measuring the maintainability in a structured system is described by McCabe (1976), who puts forward the idea of a metric based on a graph-theoretic complexity measure. According to Martin and McClure (1983), McCabe's "strategy is to measure program complexity by computing the number of linearly independent paths through a program .... McCabe refers to this number as the cyclomatic number" (p.57).
In terms of structured programs, "cyclomatic complexity can be measured simply by
counting the number of compares: cyclomatic complexity
=
compares + I" (Martin and McClure, 1983, p.57). Compares refers to statements in the program that
According to Martin and McClure (1983) "complexity evaluation is applied at the module level in a program .... McCabe uses the cyclomatic number to control the "size" of a program and hence its understandability by limiting the cyclomatic complexity of each module in the program to a maximum of 10.. .. McCabe arrived at l 0 as a reasonable limit for cyclomatic complexity after examining several FORTRAN programs" (p.57).
The reason for limiting the cyclomatic number to 10 is that, McCabe "found that modules (and indeed programs containing modules) whose cyclomatic complexity was greater than 10 were generally more troublesome and less reliable .... McCabe suggests that modules with a cyclomatic number greater than l 0 should be redesigned and perhaps subdivided into a group of modules" (Martin and McClure, 1983, p.57). While McCabe (1976) originally tested his metric with FORTRAN programs, it can also be used with a wide variety of other programming languages, such as COBOL.
2.9. Comparisons Between the Metrics
Trying to make a direct comparison between McCabe's (1976) metric and any of the metrics in Chidamber and Kemerer's (1993) suite is difficult due to the fact that both have been designed to measure maintainability in systems that were developed using different paradigms, that is the structured approach and the object-oriented approach. It is the revolutionary nature of the object-oriented approach which frustrates any possible comparisons between the two. While it may be possible to make some comparisons in terms of what each metric is attempting to measure, such an exercise is ultimately very difficult due to the inherent complexity in the object-oriented approach. One of the advantages of the object-oriented approach is due to the way that it handles this complexity. Despite the previous problems some comparison can be made between McCabe's (1976) cyclomatic number metric and Chidamber and Kemerer's (1994) weighted methods per class metric.
The similarity between these two metrics is the fact that both have been designed to measure the complexity of their respective systems. McCabe's (1976) metric is designed to measure the complexity of modules in a program, whereas, Chidamber and Kemerer's ( 1994) metric is designed to measure the complexity of a class.
McCabe (1976) attempts to measure the complexity of a program in terms of the number
of conditional statements present in a given program, whereas Chidamber and Kemerer
(1994) attempt to measure the depth of inheritance within a given object-oriented
system. McCabe's (1976) metric is harder to apply to a diagram than any of the metrics
in Chidamber and Kemerer's (1994) object-oriented metrics suite. In Chidamber and
Kemerer's (1994) case, it is possible to check the level of inheritance in an
object-oriented system just by looking at one of the design diagrams.
While the previous two examples of metrics in Chidamber and Kemerer's (1994) metric
suite show that it is difficult to compare an object-oriented metric with a structured
metric, they are by no means the only metrics in the MOOSE metric suite that measure
complexity to some extent. Other metrics such as the Response for a Class and the Lack
of Cohesion in Methods metrics also measure some complexity as well.
Overall, it can be said that it is very difficult to make direct comparisons between
Chidamber and Kemerer's (1994) metric suite and McCabe's (1976) metric. This is
despite the fact that several of the components of Chidamber and Kemerer' s metric suite
are designed to measure complexity, as is McCabe's (1976) metric. The main problem is
that it is difficult to make direct comparisons between the metrics as the output obtained
from each metric means different things in terms of the level of complexity present in a
This similarity is the fact that both sets of metrics can be used to predict the complexity of a system in the future. Thus, the results of these metrics do not show the actual complexity of a system, rather they show a prediction of the complexity at a particular point in time.
2.10. How this Overview Relates to the Thesis
As can be seen in the preceding overview there are a lot of different problems related to measuring the level of maintenance in an information system. One of the aims of this thesis is to find out if an object-oriented system is more maintainable than an equivalent system built with a structured approach.
By determining which approach leads to more a maintainable system it is hoped that this thesis will help to clarify some of the problems involved in measuring the level of complexity. One such problem which needs to be clarified is how to make meaningful measurements that can easily be compared no matter what approach to systems development is used. This is one area that needs further investigation as current maintainability metrics are predominantly designed to measure either structured or object-oriented systems but not usually both.
2.11. Summary
CHAPTER3: THE CASE STUDY
3 .1. Introduction
The purpose of this chapter is to give an overview of the case study used in this study as
well as the changes that were made to the case study. The case study used is taken from
57.221 Information Systems Analysis Project Guidelines and Scenario booklet (Jackson,
1996). For the purposes of this study the scope of the case study only includes the order
processing system. Therefore, only an outline of the order processing system will be
given.
3.2. The Trusty Furniture Company Case Study
The case study is based around a fictional furniture company in Palmerston North called
the Trusty Furniture Company Limited. The Trusty Furniture Company is a small private
company located in the lower part of the North Island that was founded in 1946
(Jackson, 1996). This furniture company specialises in " 'reproduction' dining and living
room furniture" (Jackson, 1996, p.9).
The Trusty Furniture Company supplies approximately 100 furniture stores as well as
providing a mail order service. The mail order service uses a catalogue that currently
In terms of distribution, the Trusty Furniture Company divides "New Zealand into 12
areas of roughly equal population" (Jackson, 1996). The purpose of this division is to
enable the orders for each region to be delivered in a full van, so that the Trusty
Furniture Company can make economical deliveries to their customers.
"When the orders are received they are first stamped with a received date .... The orders
are then passed to Accounts for entry on the computer .... After being entered they are
then returned to Sales were they are filed in folders corresponding to the 12 distribution
areas" (Jackson, 1996, p.l 0).
"After the original order is fed into the computer, a printout produces a six-part
document set consisting of:
• Acknowledgement of Order (sent to customer)
• Salesperson's Copy (sent to salesperson via Sales)
• Office Copy (kept in Accounts)
• Despatch Instruction (sent to the Despatch Manager Initially)
• Despatch Note (sent to the Despatch Manager Initially)
"At the time of despatch the items actually loaded are recorded on the despatch
instruction which copies through onto the Despatch Note and Van Copy .... The Van
Copy goes with the Driver to obtain the customer's acknowledgement ofreceipt .... After
an order is loaded, the Despatch Note is sent to Sales who forward it to the customer,
noting any shortages from the original customer order on the original order .... Daily and
weekly summaries are available of orders received, analysed by product" (Jackson, 1996,
p.11).
The main activity that the Sales Director has in the order processing system is to produce
a delivery plan which show the areas to be delivered to and the orders that need to be
loaded on each van (Jackson, 1996). These delivery plans are "usually issued on Friday
Nth for the week Monday (N + 9)th/Friday (N + 14)th" (Jackson, 1996, p.22).
The Orders Clerk is responsible for handling customer requests. "New customers generally telephone the company seeking information .... However, a substantial number
do write .... A brochure an copies of the order form are then posted to the prospective
customer" (Jackson, 1996, p.30).
Orders are generally received on the standard order form, however, existing customers
may place an order via telephone. Currently, new customers are not allowed to place an
Once the order has been placed, the Orders Clerk checks the order. "If there are format problems the Orders Clerk either makes the necessary adjustment or contacts the customer by telephone and occasionally by fax .... The customer is always contacted if the furniture selected is no longer offered or if there has been a price change" (Jackson,
1996, p.30).
"At the end of the day the Orders Clerk 'posts' all the order forms to the Accounts Department. ... The following day computer generated copies of the forms are returned" (Jackson, 1996, p.30).
Those customers who pay on credit and have a bad credit history must receive approval from the Finance Director. The Finance Director checks the customer's credit rating and then makes a decision as to whether the order should be accepted or rejected. Any orders which do not meet the Company's criteria are declined. Cash-On-Delivery is not accepted due the problems which it can cause.
3 .3. Description of the Changes Made to the Case Study