loci for esophageal adenocarcinoma and Barrett's esophagus.
.
White Rose Research Online URL for this paper:
http://eprints.whiterose.ac.uk/105073/
Version: Accepted Version
Article:
Levine, D.M., Ek, W.E., Zhang, R. et al. (31 more authors) (2013) A genome-wide
association study identifies new susceptibility loci for esophageal adenocarcinoma and
Barrett's esophagus. Nature Genetics, 45 (12). pp. 1487-1493. ISSN 1061-4036
https://doi.org/10.1038/ng.2796
eprints@whiterose.ac.uk
Reuse
Items deposited in White Rose Research Online are protected by copyright, with all rights reserved unless indicated otherwise. They may be downloaded and/or printed for private study, or other acts as permitted by national copyright laws. The publisher or other rights holders may allow further reproduction and re-use of the full text version. This is indicated by the licence information on the White Rose Research Online record for the item.
Takedown
If you consider content in White Rose Research Online to be in breach of UK law, please notify us by
A Genome-Wide Association Study Identifies New Susceptibility
Loci for Esophageal Adenocarcinoma and Barrett’ s Esophagus
David M. Levine1, Weronica E. Ek2, Rui Zhang1, Xinxue Liu3, Lynn Onstad4, Cassandra
Sather5, Pierre Lao-Sirieix3, Marilie D. Gammon6, Douglas A. Corley7, Nicholas J.
Shaheen8, Nigel C. Bird9, Laura J. Hardie10, Liam J. Murray11, Brian J. Reid4,12, Wong-Ho
Chow13, Harvey A. Risch14, Olof Nyrén15, Weimin Ye15, Geoffrey Liu16, Yvonne
Romero17,18, Leslie Bernstein19, Anna H. Wu20, Alan G. Casson21, Stephen Chanock22,
Patricia Harrington23,24,25, Isabel Caldas25, Irene Debiram-Beecham3, Carlos Caldas25,26,
Nicholas K. Hayward27, Paul Pharoah23,24,25, Rebecca Fitzgerald3, Stuart MacGregor2,
David C. Whiteman28, and Thomas L. Vaughan4
1Department of Biostatistics, University of Washington, School of Public Health, Seattle, WA,
USA
2Statistical Genetics, QIMR Berghofer Medical Research Institute, Queensland, Australia
3MRC Cancer Cell Unit, Hutchison-MRC Research Centre and University of Cambridge,
Cambridge, UK
4Division of Public Health Sciences, Fred Hutchinson Cancer Research Center, Seattle, WA, USA
5Genomics Shared Resource, Fred Hutchinson Cancer Research Center, Seattle, WA, USA
Users may view, print, copy, download and text and data- mine the content in such documents, for the purposes of academic research, subject always to the full Conditions of use: http://www.nature.com/authors/editorial_policies/license.html#terms
Correspondence should be addressed to: T.L.V. (tvaughan@u.washington.edu).
URLs
BEACON, http://beacon.tlvnet.net;
eQTL resources, http://eqtl.uchicago.edu/cgi-bin/gbrowse/eqtl;
GWASTools, http://www.bioconductor.org/packages/devel/bioc/html/GWASTools.html; HaploReg, http://www.broadinstitute.org/mammals/haploreg;
MaCH, http://www.sph.umich.edu/csg/abecasis/mach/index.html; METAL, http://www.sph.umich.edu/csg/abecasis/metal/index.html; R, http://www.R-project.org;
RegulomeDB, http://www.regulomedb.org/index;
SNPRelate, http://cran.r-project.org/web/packages/SNPRelate/index.html; The Wellcome Trust Case Control Consortium, http://www.wtccc.org.uk; UCSC Genome Resources, httsp://genome.cse.ucsc.edu;
COMPETING FINANCIAL INTERESTS
The authors declare no competing financial interests.
AUTHOR CONTRIBUTIONS
LB, NB, CC, AC, SC, WHC, DC, RF, MG, LH, NH, GL, LM, ON, PP, BR, HR, YR, NS, TV, DW, AW, WY planned the study. PP, TV, DW obtained funding.
CC, RF, DL, TV, DW oversaw the study.
LB, NB, IC, AC, DC, IRB, RF, MG, LH, NH, GL, LM, ON, BR, YR, NS, TV, DW, AW, WY recruited participants. PH, PLS, CS processed samples.
PH, PLS, CS undertook genotyping. WE, DL, XL, SM, LO, PP, RZ analyzed data. WE, RF, DL, SM, LO, TV, DW drafted manuscript.
HHS Public Access
Author manuscript
Nat Genet. Author manuscript; available in PMC 2014 June 01.
Published in final edited form as:
Nat Genet. 2013 December ; 45(12): 1487–1493. doi:10.1038/ng.2796.
Author Manuscript
Author Manuscript
Author Manuscript
6Department of Epidemiology, University of North Carolina School of Public Health, Chapel Hill,
NC, USA
7Division of Research and San Francisco Medical Center, Kaiser Permanente Northern
California, CA, USA
8Division of Gastroenterology and Hepatology, UNC School of Medicine, University of North
Carolina, Chapel Hill, NC, USA
9Department of Oncology, The Medical School, University of Sheffield, UK
10Division of Epidemiology, University of Leeds, Leeds, UK
11Centre for Public Health, Queen’ s University, Belfast, UK
12Division of Human Biology; Fred Hutchinson Cancer Research Center; Seattle, WA, USA
13Department of Epidemiology, MD Anderson Cancer Center, Houston, TX, USA
14Yale University School of Medicine, Department of Epidemiology and Public Health, New
Haven, CT, USA
15Department of Medical Epidemiology and Biostatistics, Karolinska Institutet, Stockholm,
Sweden
16Pharmacogenomic Epidemiology, Ontario Cancer Institute, Toronto, ON, Canada
17Division of Gastroenterology and Hepatology, Mayo Clinic, Rochester, MN, USA
18On behalf of the Romero Registry, Mayo Clinic, Rochester, MD, USA
19Department of Populations Sciences, Beckman Research Institute and City of Hope
Comprehensive Cancer Center, Duarte, CA, USA
20Department of Preventive Medicine, University of Southern California/Norris Comprehensive
Cancer Center, Los Angeles, CA, USA
21Department of Surgery, University of Saskatchewan, Saskatoon SK, Canada
22Division of Cancer Epidemiology and Genetics, National Cancer Institute, Bethesda, MD, USA
23Department of Public Health, University of Cambridge, Cambridge, UK
24Department of Primary Care, University of Cambridge, Cambridge, UK
25Department of Oncology, University of Cambridge, Cambridge, UK
26Cancer Research UK Cambridge Institute, University of Cambridge, Cambridge, UK
27Oncogenomics, QIMR Berghofer Medical Research Institute, Queensland, Australia
28Cancer Control, QIMR Berghofer Medical Research Institute, Queensland, Australia
Esophageal adenocarcinoma is a cancer with rising incidence and poor survival. Most such cancers arise in a specialized intestinal metaplastic epithelium, which is diagnostic of Barrett’ s esophagus. In a genome-wide association study, we compared esophageal adenocarcinoma cases (n=2,390) and patients with precancerous Barrett’ s esophagus
Author Manuscript
Author Manuscript
Author Manuscript
(n=3,175) with 10,120 controls in two phases. For the combined case group we identified three new associations. The first is on 19p13 (rs10419226, P=3.6×10⁻¹⁰) in CRTC1 (CREB-regulated transcription co-activator), whose aberrant activation has been associated with oncogenic activity. A second is on 9q22 (rs11789015, P=1.0×10⁻⁹) in BARX1, which
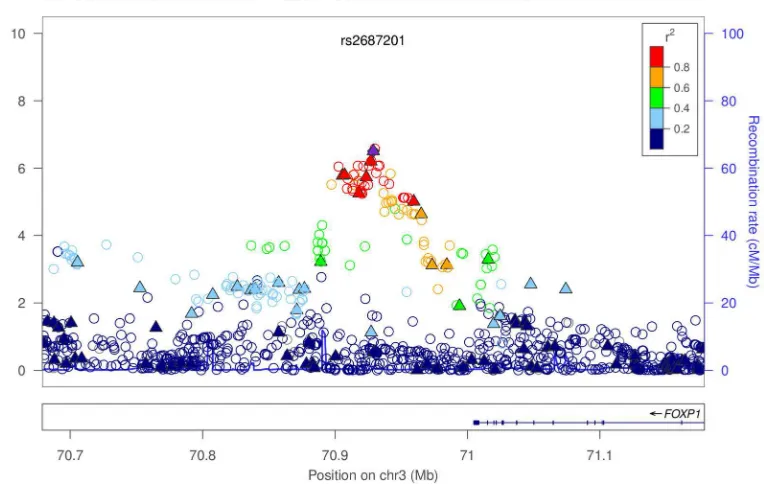
encodes a transcription factor important in esophageal specification. A third is on 3p14 (rs2687201, P=5.5×10⁻⁹) near the transcription factor, FOXP1, which regulates esophageal
development. We also refine a previously-reported association with Barrett’ s esophagus near the putative tumor suppressor gene, FOXF1, on 16q24, and extend our findings to now include esophageal adenocarcinoma.
A genetic component to the development of Barrett’ s esophagus and esophageal
adenocarcinoma has long been suspected based on prior studies in unrelated individuals and familial disease clusters.1–9 This study leverages the resources of the Barrett’ s and
Esophageal Adenocarcinoma Consortium (BEACON), and combines high-quality largely population-based epidemiologic studies of esophageal adenocarcinoma and Barrett’ s esophagus conducted over two decades.
For the discovery phase, we used 1,516 EA cases, 2,416 Barrett’ s esophagus cases and 3,209 controls, all of European ancestry, after rigorous quality control (QC) procedures (Online Methods) were applied to the genotyping data. The cases and 2,187 of the controls were collected by investigators in BEACON from cohort and case-control studies conducted in Western Europe, Australia, and North America. An additional 1,022 cancer-free controls were obtained from a study of melanoma10 and included to increase statistical power. All cases were histologically confirmed. The distribution of samples by study is given in Supplementary Table 1 and their demographic characteristics in Supplementary Table 2. All samples were genotyped on the Illumina HumanOmni1-Quad platform.
We performed association analyses on the 922,031 autosomal and X chromosome SNPs that passed QC using an additive logistic regression model implemented in GWASTools11 including as covariates age, sex and the first four eigenvectors from principal component analysis (PCA). To assess variants not present on the Illumina HumanOmni1-Quad, we performed imputation for each region of interest (Tables 1 and 2). To identify shared genetic susceptibility loci for the two conditions, we treated the esophageal adenocarcinoma and Barrett’ s esophagus cases as a single phenotype. The results are shown in a Manhattan plot in Figure 1. We also compared Barrett’ s esophagus and esophageal adenocarcinoma separately against the controls (Supplementary Figure 1). QQ plots are shown in
Supplementary Figure 2. The genomic inflation factor for analysis of the combined case group was 1.039 (1.084 excluding the first four principal components); no evidence for population stratification in our data set is indicated.
We selected 94 associated (p < 10−4) SNPs for replication. Of these, 87 were genotyped in 874 histologically confirmed esophageal adenocarcinoma cases from the Stomach and Oesophageal Cancer Study (SOCS), 759 histologically confirmed Barrett’ s esophagus cases from the UK Barrett’ s Oesophagus Gene Study (UK Gene Study) and 6,911 controls, of which 1,711 were from the SEARCH Study and 5,200 from the Welcome Trust Case Control Consortium 2 (WTCCC2).12 All SOCS, UK Gene Study and SEARCH samples
Author Manuscript
Author Manuscript
Author Manuscript
self-identified as Caucasians and were genotyped on a Fluidigm 96.96 Dynamic Array IFC. WTCCC2 subjects were of European ancestry as determined by projection onto the first two principal components of a PCA of HapMap individuals and were genotyped on a custom version of the Illumina Human1.2M-Duo array. Replication analysis was done using an additive logistic regression model with sex as a covariate. METAL software 13 was used for meta-analysis of the discovery and replication data sets.
The three loci that reached genome-wide significance (P < 5 × 10⁻⁸) in the combined case group meta-analysis are given in Table 1 and results for all replicated SNPs are given in Supplementary Table 3. The most strongly associated SNP for each of the three loci had similar ORs in Barrett’ s esophagus and esophageal adenocarcinoma. None of the top imputed SNPs showed substantially stronger association than the genotyped SNPs.
The most significant locus was at 19p13 (Figure 2a); rs10419226, PMETA(BE+EA) =
3.55×10⁻¹⁰, odds ratio (OR) = 1.18, 95% confidence interval (CI) = 1.12 – 1.24. Five imputed SNPs in high LD with rs10419226 (r2 > 0.85) were genome-wide significant in the combined discovery data set and two were also significant in the Barrett’ s esophagus discovery set (Supplementary Table 4). A second significant locus was at 9q22.32 (Figure 2b) for rs11789015 PMETA(BE+EA)= 1.02 × 10⁻⁹, OR(CI) = 0.83 (0.79–0.88). The third
genome-wide significant locus was at 3p13 (rs2687201) near FOXP1 (Figure 2c) with PMETA(BE+EA)= 5.47 × 10⁻⁹, OR(CI) = 1.18 (1.12 – 1.25)
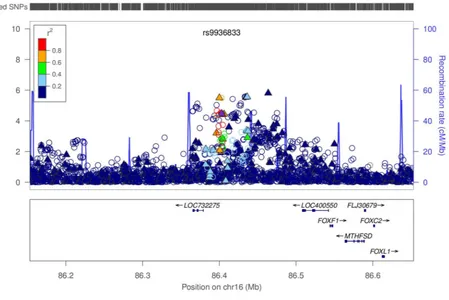
A previous study of Barrett’ s esophagus identified the SNP rs9936833, near the putative tumor suppressor gene FOXF1.14 A subset of the BEACON samples from the present study
(2,398 Barrett’ s esophagus cases, 2,167 controls) were used in the replication analysis of rs9936833 (P = 5.13 × 10⁻⁴, OR(CI) = 1.16 (1.07 – 1.27)). With the additional samples used here (18 Barrett’ s esophagus cases and 1,042 controls) the p-value was more significant (PDISCOVERY(BE) = 1.69 × 10⁻⁴), but with no change in the odds ratio (OR(CI) = 1.16 (1.07
– 1.26)). This SNP was associated with esophageal adenocarcinoma (PDISCOVERY(EA) =
2.06 × 10⁻³, OR(CI) = 1.16 (1.05 – 1.27)) (Table 2).
Examining the regional association plot of chromosome 16 near rs9936833 for the combined data (Figure 2d) we identified four nearby SNPs that had more significant P-values than rs9936833. To test the independence of these associations, this region was fine-mapped using conditional analysis to assess whether the associations were due to one or multiple variants. The discovery and replication results are shown in Table 2, with conditional analysis results in Table 3. Our results indicate that these markers define a set of complex susceptibility alleles; with between two and four independent loci.
The previous study of Barrett’ s esophagus also identified rs9257809 in the major histocompatibility complex (HLA) as being associated with increased risk of Barrett’ s esophagus.14 The significance in our extended data set (PDISCOVERY(BE) = 0.11, OR(CI) =
1.11 (0.99 – 1.29)) is not substantially different from the original replication results (P = 0.083, OR(CI) = 1.13 (0.98 – 1.30)). We found a similar OR for esophageal adenocarcinoma as in Barrett’ s esophagus, suggesting the previously identified genome-wide significant Barrett’ s esophagus association also plays a role in esophageal adenocarcinoma risk
Author Manuscript
Author Manuscript
Author Manuscript
(PDISCOVERY(EA) = 0.09, OR(CI) = 1.14 (0.97 – 1.32); PDISCOVERY(BE+EA) = 0.06, OR(CI)
= 1.12 (1.01 – 1.27)).
A previous report using BEACON data showed that Barrett’ s esophagus and esophageal adenocarcinoma risk is influenced by a large number of common genetic variants, and that a large proportion of the genes affecting risk of these two conditions are shared between them.15 These findings informed our choice of analysis approach with a primary focus on the combined esophageal adenocarcinoma and Barrett’ s esophagus samples. The utility of this approach was borne out in the results presented here. The ORs after meta-analyses comparing esophageal adenocarcinoma cases vs. controls and Barrett’ s esophagus cases vs. controls for our top five loci are very similar, whereas direct comparison of the two case types revealed no significant differences (data not shown). Combining the two case types allows these SNPs to clearly achieve genome-wide significance in the combined data sets (Table 1).
The SNPs in 19p13.11, rs10419226 and rs10423674, are intronic CRTC1 (CREB-regulated transcription co-activator) variants associated with oncogenic activity.16 Phosphorylation of CRTC1 is regulated by the tumor suppressor kinase LKB1. Down-regulation or loss of LKB1
expression in human esophageal cancer cell lines and patient samples resulted in activated
CRTC1 signaling and the transcriptional activation of downstream targets including LYPD3,
which is associated with cancer metastasis leading to the promotion of esophageal cancer cell migration and invasion.16
rs10419226 has been shown to be an expression quantitative trait loci (eQTL) for PIK3R2 in lymphoblastoid cell lines.17 PIK3R2 is known to be involved in cancer18 and is expressed in gastrointestinal tumors.19 PIK3R2 is also known to interact with epidermal growth factor (EGF), which plays an important physiological role in the maintenance of esophageal and gastric tissue integrity. The biological effects of salivary EGF includes healing of oral and gastroesophageal ulcers and inhibition of gastric acid secretion.20 Furthermore the EGF receptor has been found in gastrointestinal tissue and demonstrates increased expression in BE and esophageal adenocarcinoma.21 The G/G genotype for the SNP EGF A61G is associated with a two- to four-fold increased risk of esophageal adenocarcinoma.22,23 There are several SNPs in high LD (r2 > 0.9) with rs10419226. Three of these, rs200331191, rs139340769 and rs8102046, lie in a region of probable promoter and enhancer activities across multiple cell lines.24 The intronic CRTC1 SNP rs10423674 influences age at menarche.25 The basis of this pleiotropic effect is unclear, but may be related to obesity as
CRTC1−/− mice are hyperphagic and obese.26 rs10423674 is an eQTL for PBX4 in lymphoblastoid cell lines.
The nearest gene to the peak SNP on chromosome 3 (rs2687201) is FOXP1. The transcription factors FOXP1 and FOXP2 cooperatively regulate lung and esophagus development and FOXP1 is a therapeutic target in cancer.27,28 The FOX family is overexpressed in esophageal cancer.14 There are several SNPs in high LD (r2 > 0.8) with rs2687201 which lie within enhancer histone marks. One of them, rs7626449, is at a site
Author Manuscript
Author Manuscript
Author Manuscript
where there is also evidence from DNase-seq for transcription factor binding in esophageal epithelial cells.29
The SNP rs11789015 lies in an intron of BARX1, a homeobox transcription factor known to be involved in esophageal and trachea differentiation in developing mouse embryos and associated with down-regulation of Wnt pathway activity in stomach morphogenesis and specification.30 The BARX1 promoter region is hypermethylated in gastric cancer (GC) cell lines and patient samples, with BARX1 mRNA expression in GC tissues and cell lines reduced.31 rs11789015 lies in a region where histone marks denote likely promoter activity. rs11789015 also alters a known regulatory motif for the transcription factor FOXP1. A correlated SNP, rs62574346 (r2=0.97 with rs11789015), resides where there is also evidence from DNase-seq for transcription factor binding in esophageal epithelial cells.29
A subset of the BEACON data presented here (Supplementary Figure 3a) formed part of the replication arm of a recent Barrett’ s esophagus GWAS.14 A primary finding from that work was a Barrett’ s esophagus association at 16q24 SNP rs9936833. Here we found clear evidence this locus is also associated in esophageal adenocarcinoma (PDISCOVERY(EA) =
2.06 × 10⁻³, OR(CI) = 1.16 (1.05 – 1.27), as did a recent small study (316 esophageal adenocarcinoma cases, 602 controls; OR(CI) = 1.21 (0.99 – 1.47)).32 Two other SNPs near rs9936833, rs2178146 and rs3111601, have stronger and more significant associations in esophageal adenocarcinoma cases (Table 2 and Supplementary Figure 3b).
Since the size and direction of effect of the Barrett’ s esophagus-associated SNPs at 16q24 were similar in esophageal adenocarcinoma, we used the combined Barrett’ s esophagus and cancer data to identify other SNPs which are more significantly associated in 16q24 than rs9936833 (Table 2). One of these is rs3111601, which is in high LD (r2 = 0.75) with rs9936833. All of the SNPs in high LD with rs3111601 are intergenic, although rs1979654 (r2=0.64 with rs3111601) stands out as having excellent regulatory potential across a wide range of cell types and is likely to affect protein binding, chromatin structure and histone modification.29 There was evidence for additional independent signals in the region at rs3950627 (38kb nearer to FOXF1) and rs2178146 (64kb nearer to FOXF1), where both had similar P-values to rs3111601 (Table 2 and Figure 2d), but were in only modest LD (r2 < 0.2) with rs3111601. Neither are good regulatory candidates, although rs8045253 (imputation association PDISCOVERY(BE+EA) = 8.04 × 10⁻⁵), in r2=0.63 with rs3950627,
changes a motif for the transcription factor FOXP1. Changing the way that FOXP1 binds to this region is particularly interesting in light of our association findings on chromosome 3.
In summary, we report the first genome-wide association study of esophageal
adenocarcinoma, and the first to examine this cancer together with its precancerous lesion, Barrett’ s esophagus. Consistent with our findings showing extensive polygenic overlap between esophageal adenocarcinoma and Barrett’ s esophagus,15 our most significant results were for cancer and pre-cancer combined. Together, these findings suggest that much of the genetic basis for esophageal adenocarcinoma lies in the development of Barrett’ s esophagus, rather than progression from Barrett’ s esophagus to esophageal adenocarcinoma. We found three novel genome-wide significant loci for esophageal adenocarcinoma and Barrett’ s esophagus combined, and extended existing findings at the FOXF1 and HLA loci. One of the
Author Manuscript
Author Manuscript
Author Manuscript
novel regions is chromosome 3p13, near FOXP1, a gene encoding a transcription factor which regulates esophageal development. Interestingly, two of the other regions
(BARX1/9q22.32 and FOXF1/16q24.1) contain risk associated SNPs which disrupt binding of FOXP1. Further dissection of these loci is likely to lead to insights into the etiology of this rapidly fatal cancer.
Online Methods
DISCOVERY
Study subjects—Cases of Barrett’ s esophagus and esophageal adenocarcinoma, together
with associated population controls, were collected by investigators in the BEACON consortium. A subset of these individuals with European ancestry from epidemiologic studies conducted in Western Europe, Australia, and North America over the past twenty years were used in the Barrett’ s and Esophageal Adenocarcinoma Genetic Susceptibility Study (BEAGESS) study. To increase the statistical power of the study we included additional controls from a hospital based case-control study of melanoma.10 These controls (“ MD Anderson controls” ) were cancer-free friends or acquaintances of European ancestry who had accompanied melanoma patients to their clinical visits at the MD Anderson Cancer Center in Houston, Texas. The distribution of samples by study is given in Supplementary Table 1.
Histological confirmation of esophageal adenocarcinoma was carried out for all esophageal adenocarcinoma studies. Similarly, Barrett’ s esophagus was histologically confirmed via identification of goblet cells in metaplastic columnar epithelium in a biopsy taken from the esophagus. Age, sex (Supplementary Table 2) and other esophageal adenocarcinoma/ Barrett’ s esophagus risk factors were collected by all of the included studies via
standardized questionnaires, usually through personal interviews. All recruited participants gave informed consent and this project was approved by the ethics boards of each
participating institution.
Genotyping—BEAGESS specimens were shipped to the Fred Hutchinson Cancer
Research Center (Seattle, WA) where they were processed and genotyped in three batches. In each batch, samples on each genotyping plate were stratified and balanced according to case/control status, study, and gender with samples assigned to plates randomly within those strata. Genotyping of DNA from buffy coat or whole blood was performed using the Illumina HumanOmni1-Quad platform. MD Anderson controls were genotyped using the Illumina HumanOmni1-Quad platform at the Johns Hopkins University Center for Inherited Disease Research (CIDR). SNP annotations were based on version H of the Illumina product files and corresponded to the Genome Reference Consortium GRCh37 release.
Quality control—Quality assurance and quality control (QA/QC) of the BEAGESS and
MD Anderson data sets were carried out independently by the Genetics Coordinating Center at The University of Washington following standard procedures33. QA/QC of the MD Anderson data set was described previously10. BEAGESS samples with call rate < 95%, admixture of more than one DNA source, or unexpected relatedness (including unexpected duplicates) or misannotated sex that could not be explained were removed from the data set.
Author Manuscript
Author Manuscript
Author Manuscript
We looked for batch and plate effects using intensity data and allelic frequency and checked for case control associations with different experimental factors. No important batch or plate effects or case control associations with experimental factors were found. We used
heterozygosity, sex chromosome intensity data, identity by descent (IBD) analysis and visualization of B allele frequency (BAF) and log R ratio (LRR) plots to identify samples that had one or more of misannotated sex, unexpected relatedness or were sample
mixtures.34 Two additional sample mixtures were removed from the data set. After further sample filtering to keep only unrelated European ancestry samples (see next section), 2,416 Barrett’ s esophagus cases, 1,516 esophageal adenocarcinoma cases and 2,187 controls remained. These samples were combined with 1,022 European ancestry controls from the MD Anderson data set for discovery analysis.
SNPs were clustered using Illumina’ s GenomeStudio software and defining SNP clusters using all samples with a call rate > 95%. SNPs that had either a GenTrain score < 0.6 or a cluster separation value < 0.4 had their genotypes set to missing. Additionally, we filtered SNPs that were intensity only, had a missing call rate > 5%, had a Hardy Weinberg equilibrium p-value over controls >= 10−4, had a discordance among any of the duplicate pairs, or had a Mendelian error in either BEAGESS families or HapMap trios. These filters were combined with similar filters calculated for the MD Anderson data set.10 Additionally, we removed a further 344 SNPs that were discordant in the same HapMap control samples (n=3) run in both the BEAGESS and MD Anderson data sets. After QA/QC a total of 926,923 SNPs remained for analysis.
Principal Components Analysis—We performed Principal Component Analysis (PCA)
as a two-step process using the SNPRelate software. First, we used PCA to define a homogeneous set of European ancestry samples in the BEAGESS data set. We did this by running PCA on a set of 6,248 unrelated (except for six two-person families) subjects each of which was an EA case, a BE case, or a control. A majority of these subjects (~98%) self-identified their race as “ White” and a scatterplot of all subjects along the axes of the first two eigenvectors showed the majority of samples formed a tight cluster (Supplementary Figure 4). Therefore, we computed the means and standard deviations (SD) of the first two eigenvectors and defined any sample that fell within a two SD rectangle of both eigenvector means to be of homogeneous European ancestry (n=6,125).
Second, we ran PCA on the combined data set (n=7,147) consisting of the BEAGESS European ancestry samples (n=6,125) and the similarly defined set of MD Anderson controls (n=1,022). The intent here was to identify eigenvectors to include as covariates in our model to adjust for population differences that were present in the remaining European-ancestry-only samples.35,36 For this analysis we selected 65,774 SNPs that were non-monomorphic, autosomal, passed quality control, had missing call rate < 5%, minor allele frequency > 5%, did not have an LD value > 0.2 between any two SNPs in a sliding window of 500K bases, and were not in the LCT gene (2q21), HLA region or polymorphic regions on chromosomes eight (8p23) and seventeen (17q21.31). We included the first four eigenvectors as covariates in the association test model to account for population stratification by ancestry since they were significantly correlated with case-control status and a scree plot showed that the variance accounted for by each eigenvector flattened out
Author Manuscript
Author Manuscript
Author Manuscript
after these four eigenvectors (data not shown). To check that only genome-wide variation was detected we computed the absolute value of the correlation coefficient of each eigenvector against the genotypes for each SNP. We observed one small region of high correlation ( = ~0.4) between eigenvector one with chromosome two which may indicate long-range LD with the LCT gene.
Statistical Analysis—After excluding six related samples and six other samples that had
missing call rate > 2%, we ran a case-control analysis of the remaining 7,135 samples: 3,928 cases (1,514 EA and 2,414 BE) vs. 3,207 controls. We used an additive logistic regression model with case status regressed on each SNP’ s genotype score (coded as 0, 1, or 2 for BB, AB and AA) including covariates age, sex and the first four PCA eigenvectors to compute the odds ratios (OR) and 95% confidence intervals (95% CI) relating risk of EA or BE to a given SNP variant. To test SNPs on the X chromosome, male genotypes were coded as 0 and 2 and female genotypes as 0, 1 and 2. After filtering SNPs that did not pass quality control and SNPs with a minor allele frequency < 1% the value was 1.04. The QQ plot is shown in Supplementary Figure 2. We also compared Barrett’ s esophagus and esophageal adenocarcinoma cases separately against the controls using the same model. The
corresponding Manhattan and QQ plots are shown in Supplementary Figures 1 and 2, respectively. Analysis was carried out in the R statistical programming language37 using the Bioconductor packages GWASTools11 and SNPRelate.38
Using the combined BE + EA discovery data set we performed a step-wise series of nested logistic regression analyses to test the independence of the associations in 16q24 near rs9936833. We used the same logistic regression model and covariates as in our primary analysis, and also fitted rs3950627 as a covariate since it was the most significant SNP 100kb up or downstream of rs9936833. This conditional analysis identified rs2178146 as the most significant SNP 100kb up or downstream of rs9936833. We repeated this analysis four more times identifying and adding to each successive model rs2178146, rs3111601, rs1490865, and rs13332095, respectively, stopping when the p-value of the most significant remaining SNP had P > 0.01 (Table 3).
Imputation—To assess the impact of variants not present on the Illumina
HumanOmni1-Quad, we imputed genotypes using the MaCH39 software and a European reference panel from the 1000 Genomes project. At each region in Tables 1 and 2 imputation was done in two steps. First, haplotypes were estimated in a pre-phasing step. Second, missing alleles for additional SNPs were imputed onto these phased haplotypes using Minimac39 and a publicly available reference panel of haplotypes from European ancestry populations. SNPs with very different allele frequencies (a Chi Square statistic > 40 in a test for difference in allele frequency) between the BEACON data and the reference panel were removed prior to the second step. SNPs with MACH imputation r2 < 0.3 (a measure of imputation quality) and SNPs with a minor allele frequency < 1% were also removed. Association analysis between imputed SNPs and disease status was performed using the same regression model as for genotyped SNPs, but with dosage probabilities as predictors, rather than the actual genotype calls. All association tests were two-sided. Linkage disequilibrium (LD) calculations (r2) were computed with the discovery data when the two SNPs being compared were both
Author Manuscript
Author Manuscript
Author Manuscript
genotyped, otherwise the European ancestry samples from Phase 1 of the 1000 genomes project were used.
REPLICATION
SNP selection—We selected post-QA/QC SNPs for replication that had a p-value from
discovery < 10−4 and a minor allele frequency > 1%. This yielded 406 SNPs: 179 from Barrett’ s esophagus and esophageal adenocarcinoma vs. controls, 105 from esophageal adenocarcinoma vs. controls and 122 from Barrett’ s esophagus vs. controls, of which 321 were unique. A subset of these SNPs (n=111) were selected via LD pruning with PLINK using the command clump40; if a SNP was in LD > 0.5 with any other SNP(s) in the list, the SNP with lowest p-value was selected for replication. For each of the ten SNPs on this list with the smallest p-value, we selected an extra “ proxy” SNP to include in case the top SNP was not successfully genotyped in the replication set. These proxy SNPs were ones in high LD with the top SNP, but with a less significant p-value. We visually examined cluster plots of all SNPs and kept only those that were high quality. SNPs were rank ordered by p-value and replication attempted for the top 94.
Study Subjects—The replication cohort consisted of Barrett’ s esophagus cases,
esophageal adenocarcinoma cases and two control sets. Barrett’ s esophagus cases were identified at endoscopy with a confirmed histopathological diagnosis of intestinal metaplasia from the UK Barrett’ s Oesophagus Gene Study. esophageal adenocarcinoma cases were selected from the Stomach Oesophageal Cancer Study and had an ICD coding of malignant neoplasm of the esophagus (C15) and a pathological diagnosis of adenocarcinoma. One set of controls came from the SEARCH study which ascertains eligible cases of breast, ovary, prostate, colorectal, melanoma and endometrial cancer from the UK Eastern Cancer Registration and Information Centre. Controls were ascertained by frequency matching on age (five-year age bands) and sex to the esophageal adenocarcinoma and Barrett’ s esophagus cases excluding individuals with a past history of cancer (excluding non-melanoma skin cancer). All recruited participants gave informed consent and the studies have been approved by the relevant institutional ethics review board. The other set of controls was from the Wellcome Trust Case Control Consortium 2 (WTCCC2).
Genotyping—Barrett’ s esophagus cases, esophageal adenocarcinoma cases and SEARCH
controls were genotyped using the FluidigmTM high-throughput platform and Fluidigm 96.96 Dynamic ArraysTM according to the manufacturer’ s instructions and read using the Fluidigm EP1TM. Each array is capable of running 96 samples against 96 SNP assays. Cases and controls were plated out in sets of 96 samples and combined into 384-well arrays for genotyping with the cases and controls mixed on each 384-well plate. Genotypes were automatically called using the BioMark Genotyping AnalysisTM software, but all cluster plots were also checked manually and adjusted as necessary. The WTCCC2 controls were genotyped on a custom version of the Illumina Human1.2M-Duo array.
Quality Control—We filtered Barrett’ s esophagus cases, esophageal adenocarcinoma
cases and SEARCH controls with low call rate, inconsistent gender, were duplicates or had self-reported ethnicity of “ non-white” or “ missing” . This left 759 Barrett’ s esophagus cases,
Author Manuscript
Author Manuscript
Author Manuscript
874 esophageal adenocarcinoma cases and 1711 SEARCH controls. We excluded SNPs with missing call rate ≥ 5%, with significant differential missing call rates in cases and controls (p < 5×10⁻⁴), with low minor allele frequency (defined as <1%), and with significant departure from Hardy-Weinberg equilibrium (p<0.0005), leaving 87 post-QC SNPs. We applied standard sample and SNP exclusion criteria to the WTCCC2 controls keeping 5,190 post-QC European ancestry samples. There were 67 post-QC SNPs in the WTCCC2 controls in common with the 87-post QC SNPs from the BE cases, EA cases and SEARCH controls.
Statistical analysis—Each of the 87 SNPs was run using an additive logistic regression
model with case status regressed on the SNPs genotype and including sex as a covariate. The analysis focus was on the comparison of BE and EA cases against controls, but we also ran each case type separately against the controls. The final data set used for replication consisted of 759 BE cases and 874 EA cases. For 67 SNPs the control set consisted of 6,911 samples; 1711 SEARCH controls and 5200 WTCCC2 controls. For 20 SNPs that were not genotyped in the WTCCC2 data only the 1,711 SEARCH controls were used. The R statistical programming language was used for all analyses.
META-ANALYSIS
We used the inverse variance-based method in the METAL software13 to perform a meta-analysis of the discovery and replication data sets. This approach weights the effect size estimates ( -coefficients from the discovery and replication regression models) by their standard error estimates and calculates an overall Z-score and p-value. This was done separately for each sample set.
BIOINFORMATICS/FUNCTIONAL GENOMICS
Each region of interest was interrogated using the tools eQTL browser, HaploReg, RegulomeDB, and the UCSC Genome Browser.
Supplementary Material
Refer to Web version on PubMed Central for supplementary material.
Acknowledgments
We thank Patricia Christopherson, Paul Hansen, Lorna Nolan, and Terri Watson for their efforts in project management and organization of biospecimens and data; and Cathy Laurie, Cecelia Laurie and Bruce Weir for helpful suggestions regarding analyses.
This work was primarily funded by a US NIH grant (R01CA136725) to TV and DW. TV is also supported by grant K05CA124911. DW is supported by a Future Fellowship (FT0990987) from the Australian Research Council. SM is supported by an Australian NHMRC Career Development Award. NKH is supported by Research Fellowships from the National Health and Medical Research Council of Australia. YR is supported in part by a grant from the National Institutes of Health (NIDDK 02956), the Robert Wood Johnson Foundation Harold Amos Medical Faculty Development Program, and the Fraternal Order of the Eagles.
The Swedish Esophageal Cancer Study was funded by grants (R01 CA57947-03) from the National Cancer Institute, and the Swedish Cancer Society (4559-B01-01XAA, 4758-B02-01XAB). The Kaiser Permanente Study was supported by US NIH grants R01DK63616, R01CA59636) and from the California Tobacco Related Research Program (3RT-0122 and 10RT-0251). The UK Barrett’ s oesophagus gene study was funded by a Medical Research Council Programme grant, the UK SOCS study was funded by CRUK as well as funding from the Cambridge
Author Manuscript
Author Manuscript
Author Manuscript
NIHR biomedical research centre and the Cambridge Experimental Cancer Medicine Centre. The SEARCH grant was funded by CRUK grants C490/A10119 and C490/A10124.
Genotyping of MD Anderson controls (C. Amos, PI) were performed through the University of Texas MD Anderson Cancer Center (UTMDACC) and the Center for Inherited Disease Research (CIDR), supported in part by NIH grants R01CA100264, P30CA016672, and R01CA133996, the UTMDACC NIH SPORE in Melanoma 2P50CA093459, as well as by the Marit Peterson Fund for Melanoma Research. CIDR is supported by contract HHSN268200782096C.
This study made use of data generated by the Wellcome Trust Case Control Consortium: Funding for the project was provided by the Wellcome Trust under award 076113; a full list of the investigators who contributed to the generation of the data is available from the website (see URLs).
The Romero Registry is supported in part by the American Digestive Health Foundation “ Endoscopic Research Award,” the American College of Gastroenterology “ Junior Faculty Development Award,” the Glaxo Wellcome Inc. Institute for Digestive Health “ Clinical Research Award,” and the Miles and Shirley Fiterman Center for Digestive Diseases at Mayo Clinic, Rochester, Minnesota. The Romero Registry also has charitable gifts from five industry partners (Affymetrix, AstraZeneca, Santarus, Takeda and Wyeth); The US Multicenter Study was funded by U01CA57949, U01CA57983, and U01CA57923.
Members of the Romero Registry: (1Mayo Clinic Florida, 2Mayo Clinic Rochester, 3Mayo Clinic Arizona): Sami R.Achem, M.D.1, Yvonne Romero, M.D.2, David A. Ahlquist, M.D.2, Steven R. Alberts, M.D.2, Jeffrey A. Alexander, M.D.2, Mark S. Allen, M.D.2, Amindra S. Arora, MBBChir2, Jonathan B. Ashman, M.D., Ph.D.3, Pamela J. Atherton2, Lisa A. Boardman, M.D.2, Ernest P. Bouras, M.D.1, Vicki A. Bryhn2, Patrick A. Burch, M.D.2, George E. Burdick, M.D.2, Navtej S. Buttar, M.D.2, John K. Camoriano, M.D.3, John R. Cangemi, M.D.1, Stephen D. Cassivi, M.D.2, Frances K. Cayer1, Amy C. Clayton, M.D.2, Michael D. Crowell, M.D., Ph.D.3, Julie M. Cunningham, Ph.D.2, Mariza de Andrade, Ph.D.2, Piet de Groen, M.D.2, Giovani De Petris, M.D.3, Claude Deschamps, M.D.2, Kenneth R. DeVault, M.D.1, Robert B. Diasio, M.D.2, John K. DiBaise, M.D.3, Eric S. Edell, M.D.2, Sharon Elcombe2, Charles Erlichman, M.D.2, Douglas O. Faigel, M.D.3, Tom R. Fitch, M.D.3, David E. Fleischer, M.D.3, Jean C. Fox, M.D.2, Amy E., Foxx-Orenstein, D.O.2, Dawn Francis, M.D.2, Mary B. Fredericksen2, Evanthia Galanis, M.D.2, Debra M. Geno2, Axel Grothey, M.D.2, Michael G. Haddock, M.D.2, Kevin C. Halling, M.D., Ph.D.2, Denise M. Harnois, D.O.1, Tracy W. Hilton1, Timothy Hobday, M.D.2, Lesley A. Houghton, Ph.D.1, Prasad A. Iyer, M.D.2, Dawn E. Jaroszewski, M.D.3, Aminah Jatoi, M.D.2, Robert B. Jenkins, M.D., Ph.D.2, Elizabeth A. Johnson, M.D.1, Rajni Katipamula, M.D.2, David A. Katzka, M.D.2, Sharon F. Kaufman2, Andrew P. Keaveny, M.D.1, Daniel A. Keller2, George P. Kim, M.D.1, Benjamin R. Kipp, Ph.D.2, Dora M. Lam-Himlin, M.D.2, Stephen M. Lange, M.D.1, Louis Lanza, M.D.3, Shauna N. Legrand1, Paul J. Limburg, M.D.2, Wilma L. Lingle, Ph.D.2, Wanguo Liu, Ph.D2, G. Richard Locke, III, M.D.2, David S. Loeb, M.D.1, Lori S. Lutzke2, James A. Martenson, Jr., M.D.2 Robert R. McWilliams, M.D.2, Robert C. Miller, M.D.2, Joseph A. Murray, M.D.2, Cuong C. Nguyen, M.D.3, Francis C. Nichols, III, M.D.2, John A. Odell, M.D.1, Rahul Pannala, M.D.3, Harshita R. Paripati, M.D.2, Alexander S. Parker, Ph.D.1, Shabana F. Pasha, M.D.2, Bret T. Petersen, M.D.2, Gloria M. Petersen, Ph.D.2, Michael F. Picco, M.D.1, Henry C. Pitot, M.D.2, J. Fernando Quevedo, M.D.2, Massimo Raimondo, M.D.1, Elizabeth Rajan, M.D.2, Francisco (Pancho) C. Ramirez, M.D.2, Renee M. Root2, Helen J. Ross, M.D.3, Joseph Rubin, M.D.2, Schuyler O. Sanderson, M.D.2, Daniel J. Sargent, Ph.D.2, Daniel J. Schaid, Ph.D.2, K. Robert Shen, M.D.2, Qian Shi, Ph.D.2, Frank A. Sinicrope, M.D.2, Jeff A. Sloan, Ph.D.2, Dan C. Smith, M.D.1, David I. Smith, Ph.D.2, Thomas C. Smyrk, M.D.2, Mark E. Stark, M.D.1, Nicholas Talley, M.D., Ph.D.2, Stephen N. Thibodeau, Ph.D.2, Michael D. Van Norstrand, M.D., Ph.D.2, Michael B. Wallace, M.D.1, Kenneth K. Wang, M.D.2, Richard M. Weinshilboum, M.D.2, Dennis Wigle, M.D., Ph.D.2, Herbert C. Wolfsen, M.D.1, Louis M. Wong Kee Song, M.D.2, Timothy A. Woodward, M.D.1, Tsung-The Wu, M.D., Ph.D.2, Harry H. Yoon, M.D.2, Alan R. Zinsmeister, Ph.D2.
References
1. Jochem VJ, Fuerst PA, Fromkes JJ. Familial Barrett’ s esophagus associated with adenocarcinoma. Gastroenterology. 1992; 102:1400–1402. [PubMed: 1551547]
2. Crabb DW, et al. Familial gastroesophageal reflux and development of Barrett’ s esophagus. Ann Intern Med. 1985; 103:52–54. [PubMed: 4003988]
3. Poynton AR, Walsh TN, O’ Sullivan G, Hennessy TP. Carcinoma arising in familial Barrett’ s esophagus. Am J Gastroenterol. 1996; 91:1855–1856. [PubMed: 8792715]
4. Romero Y, et al. Familial aggregation of gastroesophageal reflux in patients with Barrett’ s esophagus and esophageal adenocarcinoma. Gastroenterology. 1997; 113:1449–1456. [PubMed: 9352846]
5. Melzer E, Shtoyerman R, Appelman Z, Kashtan H. Familial Barrett’ s adenocarcinoma. Am J Gastroenterol. 2006; 101:677. [PubMed: 16542304]
Author Manuscript
Author Manuscript
Author Manuscript
6. Groves C, Jankowski J, Barker F, Holdstock G. A family history of Barrett’ s oesophagus: another risk factor? Scand J Gastroenterol. 2005; 40:1127–1128. [PubMed: 16211720]
7. Trudgill NJ, Kapur KC, Riley SA. Familial clustering of reflux symptoms. Am J Gastroenterol. 1999; 94:1172–1178. [PubMed: 10235188]
8. Chak A, et al. Identification of Barrett’ s esophagus in relatives by endoscopic screening. Am J Gastroenterol. 2004; 99:2107–2114. [PubMed: 15554988]
9. Fitzgerald RC. Complex diseases in gastroenterology and hepatology: GERD, Barrett’ s, and esophageal adenocarcinoma. Clin Gastroenterol Hepatol Off Clin Pr. J Am Gastroenterol Assoc. 2005; 3:529–537.
10. Amos CI, et al. Genome-wide association study identifies novel loci predisposing to cutaneous melanoma. Hum Mol Genet. 2011; 20:5012–5023. [PubMed: 21926416]
11. Gogarten SM, et al. GWASTools: an R/Bioconductor package for quality control and analysis of Genome-Wide Association Studies. Bioinforma Oxf Engl. 201210.1093/bioinformatics/bts610 12. Strange A, et al. A genome-wide association study identifies new psoriasis susceptibility loci and
an interaction between HLA-C and ERAP1. Nat Genet. 2010; 42:985–990. [PubMed: 20953190] 13. Willer CJ, Li Y, Abecasis GR. METAL: fast and efficient meta-analysis of genomewide
association scans. Bioinforma Oxf Engl. 2010; 26:2190–2191.
14. Su Z, et al. Common variants at the MHC locus and at chromosome 16q24.1 predispose to Barrett’ s esophagus. Nat Genet. 2012; 44:1131–1136. [PubMed: 22961001]
15. Ek WE, et al. Large genetic component and overlap in Barrett’ s esophagus and esophageal adenocarcinoma. JNCI. Forthcoming.
16. Gu Y, et al. Altered LKB1/CREB-regulated transcription co-activator (CRTC) signaling axis promotes esophageal cancer cell migration and invasion. Oncogene. 2012; 31:469–479. [PubMed: 21706049]
17. Montgomery SB, et al. Transcriptome genetics using second generation sequencing in a Caucasian population. Nature. 2010; 464:773–777. [PubMed: 20220756]
18. Cheung LWT, et al. High frequency of PIK3R1 and PIK3R2 mutations in endometrial cancer elucidates a novel mechanism for regulation of PTEN protein stability. Cancer Discov. 2011; 1:170–185. [PubMed: 21984976]
19. Cortés I, et al. p85 phosphoinositide 3-kinase subunit regulates tumor progression. Proc Natl Acad Sci U S A. 2012; 109:11318–11323. [PubMed: 22733740]
20. Venturi S, Venturi M. Iodine in evolution of salivary glands and in oral health. Nutr Health. 2009; 20:119–134. [PubMed: 19835108]
21. Jankowski J, Hopwood D, Wormsley KG. Expression of epidermal growth factor, transforming growth factor alpha and their receptor in gastro-oesophageal diseases. Dig Dis Basel Switz. 1993; 11:1–11.
22. Menke V, et al. Functional single-nucleotide polymorphism of epidermal growth factor is associated with the development of Barrett’ s esophagus and esophageal adenocarcinoma. J Hum Genet. 2012; 57:26–32. [PubMed: 22129558]
23. Lanuti M, et al. A functional epidermal growth factor (EGF) polymorphism, EGF serum levels, and esophageal adenocarcinoma risk and outcome. Clin Cancer Res Off J Am Assoc Cancer Res. 2008; 14:3216–3222.
24. Dunham I, et al. An integrated encyclopedia of DNA elements in the human genome. Nature. 2012; 489:57–74. [PubMed: 22955616]
25. Elks CE, et al. Thirty new loci for age at menarche identified by a meta-analysis of genome-wide association studies. Nat Genet. 2010; 42:1077–1085. [PubMed: 21102462]
26. Altarejos JY, et al. The Creb1 coactivator Crtc1 is required for energy balance and fertility. Nat Med. 2008; 14:1112–1117. [PubMed: 18758446]
27. Koon HB, Ippolito GC, Banham AH, Tucker PW. FOXP1: a potential therapeutic target in cancer. Expert Opin Ther Targets. 2007; 11:955–965. [PubMed: 17614763]
28. Shu W, et al. Foxp2 and Foxp1 cooperatively regulate lung and esophagus development. Dev Camb Engl. 2007; 134:1991–2000.
Author Manuscript
Author Manuscript
Author Manuscript
29. Boyle AP, et al. Annotation of functional variation in personal genomes using Regulome DB. Genome Res. 2012; 22:1790–1797. [PubMed: 22955989]
30. Woo J, Miletich I, Kim BM, Sharpe PT, Shivdasani RA. Barx1-mediated inhibition of Wnt signaling in the mouse thoracic foregut controls tracheo-esophageal septation and epithelial differentiation. PloS One. 2011; 6:e22493. [PubMed: 21799872]
31. Agarwal R, et al. Abstract LB-384: BARX1, CYGB, and other epigenetic targets of gastric cancer. Cancer Res. 2012; 72:LB–384–LB–384.
32. Dura P, et al. Barrett associated MHC and FOXF1 variants also increase esophageal carcinoma risk. Int J Cancer J Int Cancer. 201310.1002/ijc.28160
33. Laurie CC, et al. Quality control and quality assurance in genotypic data for genome-wide association studies. Genet Epidemiol. 2010; 34:591–602. [PubMed: 20718045]
34. Peiffer DA, et al. High-resolution genomic profiling of chromosomal aberrations using Infinium whole-genome genotyping. Genome Res. 2006; 16:1136–1148. [PubMed: 16899659]
35. Price AL, et al. Principal components analysis corrects for stratification in genome-wide association studies. Nat Genet. 2006; 38:904–909. [PubMed: 16862161]
36. Novembre J, et al. Genes mirror geography within Europe. Nature. 2008; 456:98–101. [PubMed: 18758442]
37. R Development Core Team. R: A language and environment for statistical computing. R Foundation for Statistical Computing; 2006. at <http://www.R-project.org>
38. Zheng X, et al. A High-performance Computing Toolset for Relatedness and Principal Component Analysis of SNP Data. Bioinforma Oxf Engl. 201210.1093/bioinformatics/bts606
39. Li Y, Willer CJ, Ding J, Scheet P, Abecasis GR. MaCH: using sequence and genotype data to estimate haplotypes and unobserved genotypes. Genet Epidemiol. 2010; 34:816–834. [PubMed: 21058334]
40. Purcell S, et al. PLINK: a tool set for whole-genome association and population-based linkage analyses. Am J Hum Genet. 2007; 81:559–575. [PubMed: 17701901]
Author Manuscript
Author Manuscript
Author Manuscript
Figure 1.
Plot of genome-wide association results from the discovery data for the combined Barrett’ s esophagus and esophageal adenocarcinoma cases using an additive logistic regression model with age, sex and the first four eigenvectors from principal components analysis as
covariates. Results are shown for 3,928 cases (2414 Barrett’ s esophagus, 1514 esophageal adenocarcinoma) and 3,207 controls for 801,552 autosomal and X chromosome SNPs that passed quality control and have a minor allele frequency > 1%. Chromosomes are delineated by alternating colors, as labeled on the x-axis. The y-axis shows the −log10 P-values.
Author Manuscript
Author Manuscript
Author Manuscript
Figure 2.
Regional association plots showing genotyped and imputed SNPs from the discovery data for the combined Barrett’ s esophagus + esophageal adenocarcinoma cases for three newly discovered loci (a–c) and one previously identified locus (d). Genotyped SNPs are indicated by solid triangles, and imputed SNPs are indicated by hollow circles. The top-ranked SNP at each locus is shown as a solid purple diamond, except in (d) where it is rs9936833. SNPs are ordered by genomic location. The color scheme indicates linkage disequilibrium between the top ranked SNP and other SNPs in the region using the r2 value calculated from the 1000 genomes project. The y-axis is the −log10 p-value computed from 3,928 cases (2414
Barrett’ s esophagus, 1514 esophageal adenocarcinoma) and 3,207 controls. Imputation P values for all SNPs are plotted. Note that imputed and genotyped P-values for genotyped SNPs differ slightly because for the imputed result, the analysis was based on dosage scores, whereas with genotyped SNPs, the hard genotype calls are used. The recombination rate from CEU HapMap data (right side y axis) is shown in light blue. (a) Chromosome 19p13 region. (b) Chromosome 9q22 region. (c) Chromosome 3p13 region. (d) Chromosome 16q24 region.
Author Manuscript
Author Manuscript
Author Manuscript
Figure 3.
Author Manuscript
Author Manuscript
Author Manuscript
Figure 4.
Author Manuscript
Author Manuscript
Author Manuscript
Figure 5.
Author Manuscript
Author Manuscript
Author Manuscript
Levine et al.
[image:21.612.107.737.150.522.2]Page 20
Table 1
Top five newly identified SNPs associated with Barrett’ s esophagus (BE) and esophageal adenocarcinoma (EA). Shown are the discovery, replication and meta-analysis results for Barrett’ s esophagus v. controls, esophageal adenocarcinoma v. controls and the combined Barrett’ s esophagus and esophageal adenocarcinoma (BE+EA) v. controls. Each cell contains the association p-value, the odds ratio (OR) and 95% confidence interval (CI) for the minor allele, and the frequency of the minor allele in cases and controls. The slight variation in the number of discovery controls reflects the use of only unrelated samples for analysis, although six two-person families are present in the data set.
Cases/Cntrls
SNP rs2687201 rs11789015 rs6479527 rs10419226 rs10423674
Chr. 3 9 9 19 19
Position 70928930 96716028 96858411 18803172 18817903
CytoBand 3p13 9q22 9q22 19p13 19p13
Nearest Gene FOXP1 BARX1 PTPDC1 CRTC1 CRTC1
Minor*/Major plus
strand allele T/G G/A T/C A/C T/G
Barrett’ s Esophagus
Discovery 2,416/3,206
PDISCOVERY(BE) OR (95% CI) MAF Case/Cntrl
2.27 × 10⁻⁵ 1.19 (1.10 – 1.29) 0.335/0.300
2.34 × 10⁻⁴ 0.85 (0.78 –
0.93) 0.264/0.292
9.16 × 10⁻⁵ 0.86 (0.79 – 0.93) 0.468/0.505
2.32 × 10⁻⁸ 1.24 (1.15 –
1.34) 0.492/0.442
6.84 × 10⁻⁶ 0.83 (0.77 – 0.90) 0.303/0.338
Replication 759/6,911
PREPLICATION(BE) OR (95% CI) MAF Case/Cntrl
2.48 × 10⁻² 1.14 (1.02 – 1.28) 0.336/0.305
6.60 × 10⁻³ 0.84 (0.74 –
0.95) 0.247/0.279
1.29 × 10⁻¹ 0.92 (0.82 – 1.02) 0.461/0.481
1.22 × 10⁻¹ 1.09 (0.98 –
1.21) 0.486/0.462
5.67 × 10⁻² 0.89 (0.80 – 1.00) 0.312/0.338
Meta-analysis 3,175/10,117
PMETA(BE) OR (95% CI) MAF Case/Cntrl
2.00 × 10⁻⁶ 1.18 (1.10 – 1.26) 0.335/0.303
5.08 × 10⁻⁶ 0.85 (0.79 –
0.91) 0.260/0.283
4.74 × 10⁻⁵ 0.88 (0.82 – 0.93) 0.467/0.489
5.54 × 10⁻⁸ 1.19 (1.12 –
1.26) 0.491/0.456
1.92 × 10⁻⁶ 0.85 (0.80 – 0.91) 0.306/0.338
Esophageal Adeno-carcinoma
Discovery 1,516/3,209
PDISCOVERY(EA) OR (95% CI) MAF Case/Cntrl
3.27 × 10⁻⁶ 1.26 (1.14 – 1.39) 0.343/0.300
1.96 × 10⁻⁴ 0.83 (0.75 –
0.91) 0.257/0.292
1.30 × 10⁻⁴ 0.84 (0.77 – 0.92) 0.463/0.504
1.20 × 10⁻⁵ 1.23 (1.12 –
1.34) 0.486/0.442
3.15 × 10⁻³ 0.86 (0.78 – 0.95) 0.316/0.338
Replication 874/6,911
PREPLICATION(EA) OR (95% CI) MAF Case/Cntrl
2.31 × 10⁻² 1.14 (1.02 – 1.27) 0.335/0.305
2.11 × 10⁻⁴ 0.80 (0.71 –
0.90) 0.238/0.279
4.43 × 10⁻³ 0.86 (0.77 – 0.95) 0.445/0.481
1.20 × 10⁻² 1.14 (1.03 –
1.26) 0.497/0.462
7.59 × 10⁻⁵ 0.80 (0.71 – 0.89) 0.289/0.338
Meta-analysis 2,390/10,120
PMETA(EA) OR (95% CI) MAF Case/Cntrl
5.76 × 10⁻⁷ 1.20 (1.12 – 1.29) 0.335/0.303
1.80 × 10⁻⁷ 0.81 (0.75 –
0.88) 0.254/0.283
2.03 × 10⁻⁶ 0.85 (0.79 – 0.91) 0.460/0.489
8.35 × 10⁻⁷ 1.19 (1.11 –
1.27) 0.494/0.456
1.46 × 10⁻⁶ 0.83 (0.77 – 0.90) 0.298/0.338
Combined Discovery 3,928/3,207 PDISCOVERY(BE+EA)
OR (95% CI) 3.01 × 10
−7 9.88 × 10⁻⁶ 3.47 × 10⁻⁶ 2.00 × 10⁻⁹ 5.52 × 10⁻⁶
Nat Genet
Levine et al.
Page 21
Cases/Cntrls
SNP rs2687201 rs11789015 rs6479527 rs10419226 rs10423674
Chr. 3 9 9 19 19
Position 70928930 96716028 96858411 18803172 18817903
CytoBand 3p13 9q22 9q22 19p13 19p13
Nearest Gene FOXP1 BARX1 PTPDC1 CRTC1 CRTC1
Minor*/Major plus
strand allele T/G G/A T/C A/C T/G
MAF Case/Cntrl
1.21 (1.12 – 1.30) 0.338/0.300
0.84 (0.78 – 0.91) 0.261/0.292
0.85 (0.80 – 0.91) 0.466/0.504
1.23 (1.15 – 1.32) 0.490/0.442
0.84 (0.79 – 0.91) 0.308/0.338
Replication 1,633/6,911
PREPLICATION(BE+EA) OR (95% CI) MAF Case/Cntrl
2.64 × 10⁻³ 1.14 (1.05 – 1.24) 0.336/0.305
2.25 × 10⁻⁵ 0.82 (0.75 –
0.90) 0.242/0.279
3.51 × 10⁻³ 0.89 (0.82 – 0.96) 0.452/0.481
7.18 × 10⁻³ 1.11 (1.03 –
1.20) 0.492/0.462
7.75 × 10⁻⁵ 0.84 (0.77 – 0.92) 0.300/0.338
Meta-analysis 5,561/10,118
PMETA(BE+EA) OR (95% CI) MAF Case/Cntrl
5.47 × 10⁻⁹ 1.18 (1.12 – 1.25) 0.335/0.303
1.02 × 10⁻⁹ 0.83 (0.79 –
0.88) 0.257/0.283
5.84 × 10⁻⁸ 0.87 (0.82 – 0.91) 0.464/0.489
3.55 × 10⁻¹⁰ 1.18 (1.12 –
1.24) 0.492/0.456
1.75 × 10⁻⁹ 0.84 (0.80 – 0.89) 0.302/0.338
*
Coded allele.
Nat Genet
Levine et al.
[image:23.612.105.739.154.517.2]Page 22
Table 2
SNPs in region 16q24 on chromosome 16 near the FOXF1 gene associated with Barrett’ s esophagus and esophageal adenocarcinoma. Shown are the discovery, replication and meta-analysis results for SNPs 100kb up or downstream of rs9936833, a previously identified susceptibility loci for Barrett’ s esophagus.14 This table contains rs9936833, SNPs that had more significant P-values than rs9936833 in the combined Barrett’ s esophagus and
esophageal adenocarcinoma data set (PDISCOVERY(BE+EA)), or were the most significant SNP in conditional analysis, in this region after fitting other
SNPs (Table 3).
Cases/Cntrls
SNP rs1490865 rs3111601 rs9936833 rs1728400 rs3950627 rs2178146 rs13332095
Position 86387275 86400081 86403118 86434446 86436343 86463695 86465590
Minor*/Major plus
strand allele G/A G/A G/A A/C G/T G/A A/G
Barrett’ s Esophagus
Discovery 2,416/3,206
PDISCOVERY(BE) OR (95% CI) MAF Case/Cntrl
7.00 × 10⁻² 1.09 (0.99
– 1.19) 0.258/0.241
1.22 × 10⁻⁴ 1.17 (1.08
– 1.27) 0.332/0.303
1.69 × 10⁻⁴ 1.16 (1.07
– 1.26) 0.397/0.366
3.14 × 10⁻⁶ 1.20 (1.11
– 1.30) 0.473/0.434
2.88 × 10⁻⁶ 1.20 (1.11 – 1.30) 0.504/0.465
3.65 × 10⁻⁴ 0.87 (0.80
– 0.94) 0.396/0.424
1.29 × 10⁻² 1.17 (1.03 – 1.33) 0.105/0.093
Replication 759/6,911
PREPLICATION(BE) OR (95% CI) MAF Case/Cntrl
5.01 × 10⁻¹ 1.04 (0.93
– 1.17) 0.324/0.313
3.67 × 10⁻¹ 0.95 (0.85
– 1.06) 0.396/0.408
Meta-analysis 3,175/10,117
PMETA(BE) OR (95% CI) MAF Case/Cntrl
4.24 × 10⁻⁴ 1.13 (1.05
– 1.20) 0.330/0.310
6.24 × 10⁻⁴ 0.89 (0.84 – 0.95) 0.396/0.413 Esophageal Adeno-carcinoma Discovery 1,516/3,209 PDISCOVERY(EA) OR (95% CI) MAF Case/Cntrl
8.60 × 10⁻¹ 0.99 (0.89
– 1.10) 0.243/0.241
5.64 × 10⁻⁵ 1.22 (1.11
– 1.35) 0.343/0.303
2.06 × 10⁻³ 1.16 (1.05
– 1.27) 0.397/0.366
4.94 × 10⁻³ 1.14 (1.04
– 1.25) 0.460/0.434
4.70 × 10⁻³ 1.14 (1.04 – 1.25) 0.494/0.465
1.31 × 10⁻⁵ 0.81 (0.74
– 0.89) 0.380/0.424
1.42 × 10⁻³ 1.28 (1.10 – 1.48) 0.112/0.093
Replication 874/6,911
PREPLICATION(EA) OR (95% CI) MAF Case/Cntrl
1.67 × 10⁻¹ 1.08 (0.97
– 1.20) 0.330/0.313
4.22 × 10⁻² 0.90 (0.81
– 1.00) 0.385/0.408
Meta-analysis 2,390/10,120
PMETA(EA) OR (95% CI) MAF Case/Cntrl
8.49 × 10⁻⁵ 1.16 (1.08
– 1.24) 0.331/0.310
4.37 × 10⁻⁶ 0.85 (0.79 – 0.91) 0.392/0.413 Combined Discovery 3,928/3,207 PDISCOVERY(BE+EA) OR (95% CI) MAF Case/Cntrl
1.95 × 10⁻¹ 1.05 (0.97
– 1.14) 0.252/0.242
3.02 × 10⁻⁶ 1.19 (1.11
– 1.28) 0.336/0.303
3.44 × 10⁻⁵ 1.16 (1.08
– 1.24) 0.397/0.366
2.87 × 10⁻⁶ 1.18 (1.10
– 1.26) 0.468/0.434
2.07 × 10⁻⁶ 1.18 (1.10 – 1.26) 0.500/0.465
2.10 × 10⁻⁶ 0.84 (0.79
– 0.91) 0.390/0.425
7.69 × 10⁻⁴ 1.21 (1.08 – 1.36) 0.108/0.093
Replication 1,633/6,911 PREPLICATION(BE+EA)
OR (95% CI) 2.24 × 10 −1
2.24 × 10⁻¹ 5.04 × 10
−2
Nat Genet
Levine et al.
Page 23
Cases/Cntrls
SNP rs1490865 rs3111601 rs9936833 rs1728400 rs3950627 rs2178146 rs13332095
Position 86387275 86400081 86403118 86434446 86436343 86463695 86465590
Minor*/Major plus
strand allele G/A G/A G/A A/C G/T G/A A/G
MAF Case/Cntrl
1.05 (0.97 – 1.15) 0.327/0.313
0.92 (0.85 – 1.00) 0.390/0.408
Meta-analysis 5,561/10,118
PMETA(BE+EA) OR (95% CI) MAF Case/Cntrl
1.56 × 10⁻⁵ 1.13 (1.07
– 1.19) 0.331/0.310
1.14 × 10⁻⁶ 0.88 (0.83
– 0.92) 0.394/0.413
*
Coded allele.
Nat Genet
Levine et al.
[image:25.612.111.744.137.295.2]Page 24
Table 3
Step-wise conditional analysis to test for independent SNP signals in region 16q24. Each SNP is the most significant SNP 100kb up or downstream of rs9936833 after fitting all SNPs in the previous rows as additional covariates in the same logistic regression model used in the primary analysis. Starting with the most significant SNP in this region, rs3950627, this methodology fit four other SNPs (rows 2–5) before stopping when the p-value of the most significant remaining SNP had P > 0.01. The last row is the P-value of an association test of rs9936833 in each of these models.
Fitted SNP(s) rs3950627 rs3950627 + rs2178146 rs3950627 + rs2178146 + rs3111601
rs3950627 + rs2178146 + rs3111601 + rs1490865
rsID position p-value OR (CI) p-value OR (CI) p-value OR (CI) p-value OR (CI) p-value OR (CI)
rs3950627 86436343 0.0000021 1.18 (1.10 – 1.26)
rs2178146 86463695 0.0000021 0.84 (0.79 – 0.91) 0.00119 0.88 (0.82 – 0.95)
rs3111601 86400081 0.0000030 1.19 (1.11 – 1.28) 0.00225 1.13 (1.05 – 1.22) 0.00478 1.12 (1.04 – 1.21)
rs1490865 86387275 0.1949656 1.05 (0.97 – 1.14) 0.02464 1.10 (1.01 – 1.19) 0.02582 1.10 (1.01 – 1.19) 0.00140 1.15 (1.05 – 1.25)
rs13332095 86465590 0.0007695 1.21 (1.08 – 1.36) 0.00147 1.20 (1.07 – 1.34) 0.01658 1.15 (1.03 – 1.30) 0.00990 1.17 (1.04 – 1.31)
0.00490 1.18 (1.05 – 1.33)
rs9936833 86403118 0.0000344 1.16 (1.08 – 1.24) 0.01529 1.10 (1.02 – 1.19) 0.02265 1.09 (1.01 – 1.18) 0.84929 0.99 (0.86 – 1.14)
0.69573 1.03 (0.89 – 1.19)
Nat Genet


![Bis[2 (butyliminomethyl) 4 chlorophenolato]iron(II)](data:image/gif;base64,R0lGODlhAQABAIAAAP///wAAACH5BAEAAAAALAAAAAABAAEAAAICRAEAOw==)