promoting access to White Rose research papers
White Rose Research Online eprints@whiterose.ac.uk
Universities of Leeds, Sheffield and York
http://eprints.whiterose.ac.uk/
This is an author produced version of a paper published inCancer Epidemiology
White Rose Research Online URL for this paper: http://eprints.whiterose.ac.uk/id/eprint/77804
Paper:
van Laar, M, McKinney, PA, Stark, DP, Glaser, A, Kinsey, SE, Lewis, IJ, Picton, SV, Richards, M, Norman, PD and Feltbower, RG (2012)Survival trends of cancer amongst the south Asian and non-south Asian population under 30 years of age in Yorkshire, UK.Cancer Epidemiology: the international journal of cancer epidemiology, detection and prevention, 36 (1). e13 - e18. ISSN 1877-7821
Survival trends of cancer among the south Asian and non–south Asian population
under 30 years of age in Yorkshire, UK
M. van Laara, P.A. McKinneyb, D.P. Starkc, A. Glaserd, S.E. Kinseye, I.J. Lewisf, S.V.
Pictong, M. Richardsh, P.D. Normani, R.G. Feltbowerj
aPaediatric Epidemiology Group, Division of Epidemiology, Room 8.49, Worsley Building,
Clarendon Way, University of Leeds, LS2 9NL, UK; Email: m.vanlaar@leeds.ac.uk. bPaediatric Epidemiology Group, Division of Epidemiology, Room 8.49, Worsley Building,
Clarendon Way, University of Leeds, LS2 9NL, UK; Email: p.a.mckinney@leeds.ac.uk. cInstitute of Oncology, Bexley Wing, St James’s University Hospital, Beckett Street,
Leeds, LS9 7TF, UK; Email: d.p.stark@leeds.ac.uk.
dRegional Department of Paediatric Oncology and Haematology, Leeds General
Infirmary, Great George Street, Leeds, LS1 3EX, UK; Email:
adam.glaser@leedsth.nhs.uk.
eRegional Department of Paediatric Oncology and Haematology, Leeds General
Infirmary, Great George Street, Leeds, LS1 3EX, UK; Email:
sally.kinsey@leedsth.nhs.uk.
fRegional Department of Paediatric Oncology and Haematology, Leeds General
Infirmary, Great George Street, Leeds, LS1 3EX, UK; Email: ian.lewis@alderhey.nhs.uk. gRegional Department of Paediatric Oncology and Haematology, Leeds General
Infirmary, Great George Street, Leeds, LS1 3EX, UK; Email:
susan.picton@leedsth.nhs.uk.
hRegional Department of Paediatric Oncology and Haematology, Leeds General
Infirmary, Great George Street, Leeds, LS1 3EX, UK; Email:
michael.richards@leedsth.nhs.uk. i
School of Geography, University of Leeds, University Road, Leeds, LS2 9JT, UK; Email:
p.d.norman@leeds.ac.uk. j
Paediatric Epidemiology Group, Division of Epidemiology, Room 8.49, Worsley Building, Clarendon Way, University of Leeds, LS2 9NL, UK; Email: r.g.feltbower@leeds.ac.uk.
CORRESPONDENCE Marlous van Laar; Paediatric Epidemiology Group, Room 8.49,
Worsley Building, Clarendon Way, University of Leeds, LS2 9NL, UK;
ABSTRACT
INTRODUCTION: Several studies have shown differences in survival trends between
ethnic groups across adults with cancer in the UK. It is unclear whether these differences
exist exclusively in the older adult population or whether they begin to emerge in children
and young adults.
METHODS: Subjects (n=3534) diagnosed with cancer under 30 years of age in
Yorkshire between 1990 and 2005 were analysed. Differences in survival rates for
diagnostic subgroups were estimated by ethnic group (south Asian or not) using Kaplan–
Meier estimation and Cox regression.
RESULTS: When compared to non-south Asians (all other ethnic groups excluding
south Asians) a significant increased risk of death was seen for south Asians with
leukaemia (hazard ratio (HR) = 1.75; 95% confidence interval (CI) = 1.11 to 2.76) and
lymphoma (HR=2.05; 95%CI=1.09 to 3.87), whereas south Asians with solid tumours
other than central nervous system tumours had a significantly reduced risk of death
(HR=0.50 95%CI=0.28 to 0.89). This was independent of socioeconomic deprivation.
CONCLUSION: We found evidence of poorer survival outcomes for south Asians
compared to non-south Asian children and young adults with leukaemia and lymphoma,
but better outcomes for south Asian children and young adults with other solid tumours.
This needs to be explained, and carefully addressed in the on-going development of
cancer services.
INTRODUCTION
Cancer survival rates for children and young adults across Europe have improved
markedly over recent decades, yet outcomes for certain types of cancers have been
shown to vary by gender, age, treatment, place of care, geographical location and
deprivation [1-4].
Within the UK, survival trends vary according to ethnic group across the adult age range.
Worse survival rates from breast cancer have been observed amongst non-south Asian
women (65-67% 5-year survival) compared to south Asian women (70-73% 5-year
survival) [5-6]. However, it is unclear whether survival differences by ethnic group in the
UK exist exclusively in the older adult population or whether they begin to emerge in
childhood or young adults. Survival rates for UK childhood cancer have shown few
consistent patterns with ethnicity, although south Asians with acute lymphoblastic
leukaemia (ALL) had a significantly higher risk of death compared to White children in
one study [7], and a non-significantly higher risk in two studies [8-9]. In the US, the
overall five year cancer survival rate of Hispanic children (72%) was found to be lower
than for White children (84%), whilst another study shows Black children with ALL had
poorer survival than White children (75% vs. 85%) [10-11]. However, this could be as a
result of differences in socio-economic status affecting access to health care services in
the US. Recent studies in Europe and England have reported on survival trends of
teenage and young adult (TYA) cancer, however none have focused on differences by
ethnic group [1,12].
This study utilises high quality population–based data on children and young adults
diagnosed with cancer between 1990 and 2005 in combination with a validated method
of ethnicity assignment based on name analysis and linked hospital episode statistics
differences and trends in cancer survival by ethnic group (south Asian or not) across the
childhood (0–14) and young adult (15–29) age ranges.
MATERIALS AND METHODS
Case Data
The data used for this study cover a 16 year period from 1990 to 2005 including all children
and young adults under the age of 30, living in the former Yorkshire Regional Health
Authority who were diagnosed with cancer other than skin carcinomas and melanomas.
Cases were extracted from the population-based Yorkshire Specialist Register of Cancer in
Children and Young People (YSRCCYP) [13].
Diagnoses were categorised into groups according to the International Classification of
Childhood Cancer (ICCC); this histologically based classification scheme was chosen in
preference to the site based classification used for adults [14], as the majority of our cases
(54%) are aged 18 and under. In order to retain statistical power, diagnoses were grouped
into four main categories; leukaemia, lymphoma, central nervous system (CNS) tumours,
and other solid cancers, corresponding to ICCC codes I, II, III, and IV–XII. Biennial proactive
follow–up of cases was carried out to ascertain each individual’s vital status, with a
censoring date of 31st December 2009 so that all cases had a potential follow–up period of at
least four years.
The former Yorkshire region contained 11% of all south Asians under the age of 30 in
England (Census, 2001) compared to only 7.4% of all 0–29 year old non–south Asians.
Assignment of Ethnic Group
Ethnicity was assigned as either south Asian (i.e. of Pakistani, Indian, or Bangladeshi origin)
Pehchan and SANGRA) and secondly through an independent validation with linked
inpatient HES data [13,15-16].
Statistical Analysis
Survival rates were examined overall and by major histological subtype to determine
differences by ethnic group. Deprivation scores for address at diagnosis were derived using
the Townsend index based on the 2001 Census. This electoral ward based measure of
material wealth was derived as a composite score based on levels of unemployment, non–
home ownership, over-crowding, and non–car–ownership [17].
Differences were initially assessed using Kaplan–Meier (KM) estimation and univariate log–
rank tests. Cox regression modelling was used to assess the independent impact of ethnic
group on the survival time for all cancers combined and in each of the four main diagnostic
groups adjusting for age, sex, year of diagnosis, deprivation, and stage of disease. A test for
linearity was used to determine whether age and year were appropriately modelled as
continuous variables. To differentiate between the independent effect of ethnicity and the
potentially confounding effect of socioeconomic status, deprivation was adjusted for within
each Cox model. Deprivation was analysed as a continuous variable using Townsend
scores.
Stage at diagnosis was included in the analysis; instances where data on stage were
unavailable were imputed using ordered logistic regression. White blood cell count was used
as a proxy for stage when modelling leukaemia survival rates and missing values were
imputed using linear regression. White blood cell count was log transformed to an
approximately normal distribution. Missing data on stage was assumed to be missing at
random, as opposed to missing completely at random after interrogation of missing data
patterns and comparisons of individuals with observed and missing data. Separate
Each imputation model included the following variables; gender, age, year of diagnosis,
deprivation level, ethnicity, treatment type, diagnostic group/subgroup, and relapse status.
Interactions tested within the main analysis were also included within the imputation model
(deprivation and ethnicity) [18]. Additionally, the Nelson–Aalen (NA) estimate of the
cumulative hazard function and censoring indicator were included in the imputation model, to
avoid underestimation of stage and survival time [19-20]. A total of 65 imputations were
completed for each diagnostic group. The results of each imputation were modelled
individually using Cox regression and combined parameter estimates were calculated using
Rubin’s rules [21]. All imputation methods were implemented in Stata 11 using multiple
imputation by chained equations (MICE) [22-23].
Hazard ratios (HR) were taken from the Cox regression models and reported for each
covariate. In order to retain power, we considered separate Cox models for each major
diagnostic group so that they adhered to the general rule of ten or more deaths per covariate
[24]. Schoenfeld residuals were used to assess the Cox proportional hazards assumption for
each imputation [25]. Random scatters around zero on plots of the residuals against the rank
survival time by covariate validated these assumptions [26]. Furthermore, Monte Carlo (MC)
standard errors were calculated to measure the level of uncertainty in all estimated
quantities of each model, and the c–index measure of discrimination was used to assess
predictive performance [27-28]. For each model estimate, MC errors were sufficiently small
so that statistical significance remained unaltered at the upper and lower bounds and
predictive power was above 70% in all cases. Results from a complete-case analysis were
compared to those from the multiple imputation analysis (see supplementary material).
There were no important differences in terms of the direction of effects; however, there was
an overall improvement in the precision of the analysis indicated by a reduction in standard
errors.
A total of 3534 children and young adults were registered with cancer between 1990 and
2005 whilst living in the former Yorkshire region, of which 275 (7.8%) were south Asian
(Table 1). We observed a total of 896 (27%) non-south Asian deaths compared to 80 (29%)
south Asian deaths over the study period. The overall five year survival rate for both groups
together was 75% (95% confidence interval (CI) 74–76%).
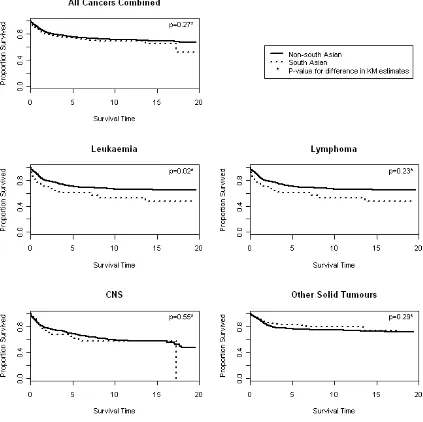
Figure 1 contains univariate KM survival estimates for each main diagnostic group. Log-rank
tests indicated no difference in survival rates between south Asians and non-south Asians
for all cancers combined (p=0.27), lymphoma (p=0.23), CNS tumours (p=0.55), or other solid
tumours (p=0.29). A significant difference was observed for leukaemia (p=0.02), with south
Asians exhibiting consistently lower survival rates. The five year survival rate for south
Asians with leukaemia was 60% (95%CI 47% to 71%) compared to 70% (95%CI 67% to
74%) for non–south Asians. Univariate log–rank tests showed evidence of a significant
difference in survival between diagnostic groups (p=0.001).
KM estimates comparing 0–14 and 15–29 year olds by diagnostic group showed 15–29 year
olds had significantly lower survival rates for leukaemia (p=0.001) and other solid tumours
(p=0.001) but very little difference in survival rates for all cancers combined or lymphoma.
No differences in survival rates were observed by gender.
Cox Regression
Data on stage of disease at diagnosis was missing in 66% overall, 66% for lymphoma cases,
28% for CNS tumours, and 69% for other solid tumours. Additionally, white blood cell count
was missing for 57% amongst leukaemia cases. There were no missing data in any of the
other variables within the analysis. Missing values for stage of disease (and white blood cell
The results of the Cox proportional hazards modelling for all cancers combined and each
main diagnostic group are given in Table 2, where each parameter estimate is mutually
adjusted for all other covariates listed in the appropriate column. Overall for all cancers
combined, there was no evidence of a significant difference in survival between south Asians
and non-south Asians. However, significant differences in survival by ethnic group were
observed amongst those with leukaemia, lymphoma, and other solid tumours. South Asians
with leukaemia were 1.8 times more likely to die than non-south Asians, this difference was
more apparent for 15–29 year olds (almost twice as likely), but was a consistent finding
across diagnostic subgroups. South Asians with lymphoma were more than twice as likely to
die compared to non–south Asians and this difference was most apparent amongst 0–14
year olds, and was observed consistently for both Hodgkin’s disease (HD) and non–
Hodgkin’s lymphoma (NHL). Ethnicity did not demonstrate any independent effect on
survival time amongst those with CNS tumours. For other solid tumours, south Asians were
less likely to die by 50% compared to non–south Asians. This difference was particularly
evident for sympathetic nervous system tumours, bone tumours, and sarcomas.
We observed no significant differences in survival rates by gender for any diagnostic group.
For all cancers combined, CNS tumours, and other solid tumours, there was a two to three
percent significant increased risk of death for each single year in increase of age at
diagnosis. We observed that older TYA diagnosed with leukaemia (aged 15–19, 20–24, and
25–29 at diagnosis) were twice as likely to die compared to those in the youngest age group
(0–4 years old). For lymphoma 10–14 year olds were half as likely to die compared to 25–29
year olds. No significant differences were observed between the other age categories
Almost all diagnostic groups showed a consistent improvement in survival over time apart
from other solid tumours. Significant improvements in survival since 1990 were observed for
lymphoma and leukaemia (five and six percent per year respectively).
There was no significant independent effect on survival by level of deprivation except for
those diagnosed with lymphoma, such that increasing deprivation is associated with better
survival rates. Since the south Asian population tends to live in more deprived areas,
interactions between ethnicity and deprivation were tested in each model; however they
were not statistically significant.
For all cancers combined, leukaemia, CNS tumours, and other solid tumours survival rates
were significantly lower in patients presenting with a more advanced stage of disease. There
was no significant difference in survival rates of those with lymphoma according to stage of
disease.
DISCUSSION
Our findings relate to a novel population-based study examining survival trends in relation to
ethnic group encompassing the childhood, teenage and young adult age range. We
observed significantly poorer survival outcomes for south Asians with leukaemia and
lymphoma compared to non-south Asians, but improved survival for south Asians with other
non-CNS solid tumours. The Yorkshire region is representative nationally in terms of its
socioeconomic and demographic profile, and therefore our results can be easily generalised
to the rest of the UK population [29]. Furthermore, an estimated 60% of the south Asian
population within the study region originates from Mirpur in rural Pakistan, making it one of
the few regions in the UK that allows for detailed analysis of a relatively homogeneous south
A few UK studies, including one from Yorkshire, have found evidence of survival inequalities
occurring between ethnic groups in children under the age of 16 years [8-9]. However, our
results describing the independent effects on survival of being south Asian ethnic origin,
provide an important benchmark from which to judge the impact of the National Institute for
Health and Clinical Excellence Improving Outcomes Guidance (IOG) for Children and Young
People, due to be implemented by 2011 [31]. The public health implications and necessity to
understand reasons for these discrepancies in survival are especially pertinent as we expect
a three-fold increase of young people to be diagnosed with cancer who are of south Asian
origin over the next 10-20 years [13].
Key observations were the statistically significant two-fold increased risk of death for south
Asians with leukaemia and lymphoma in contrast to non–south Asians, as well as the
significantly higher risk of death for non–south Asians with other solid tumours compared to
south Asians. For other solid tumours this difference was seen across all ages, whereas for
leukaemia it was most apparent amongst 15–29 year olds, and for lymphoma it appeared to
be limited to patients aged 0–14 years; in all instances the effect remained significant even
after adjustment for deprivation. For lymphoma, there was also an unexpected independent
lower risk of death for individuals from more deprived areas. This may be due to subtle
differences in the socioeconomic distribution between Indians, Pakistanis and Bangladeshis,
or the use of an area based measure which may not necessarily reflect socioeconomic
status at an individual level.
In relation to survival and age at diagnosis, the data revealed that older patients, especially
those aged 15–29 years, were significantly more likely to die than children under 15 years of
age even after allowing for diagnostic group and stage/white cell count (acting as a proxy for
stage) in the regression models. This increased mortality risk was seen for all cancers
combined, leukaemia, CNS, and other solid tumours. Taken together with the increased risk
years with leukaemia would be four times more likely to die than non-south Asian children,
under the assumption of multiplicative effects from the Cox regression modelling. Part of the
explanation for lower survival rates seen in older children and young adults could be due
either to differences in the biological or molecular characteristics of tumours occurring in this
age group or the reported smaller proportion of older TYA patients (19% in 2006/2007)
enrolled onto clinical trials than their childhood cancer counterparts (51% in 2006/2007) [32].
Efforts are underway in the UK to ensure all TYA have the opportunity to enter trials where
appropriate and are treated within Principal Treatment Centres (PTC) so that individuals can
be treated and followed-up within an environment with appropriate age and/or site-specific
expertise.
Limitations of our work included the relatively small number of south Asians in our study and
therefore some lack of statistical power. Furthermore, stage at diagnosis was missing in
two-thirds of cases overall. However, multiple imputation was considered the best available
option. Failure to include stage at diagnosis in the multivariate analysis could lead to bias in
the results, whereas multiple imputation avoids discarding non-missing stage data or case
wise deletion. Imputation for this level of missing values was considered acceptable because
values were imputed for only one variable due to the availability of complete case data for all
other variables included in the analysis. The use of multiple imputation is fast becoming an
accepted statistical technique for handling missing data [33-34]. It has led to an improvement
in precision of our estimates compared to a complete-cases analysis indicated by a
reduction in standard errors by 44% on average.
Importantly, survival rates showed a consistent improvement over the study period for
leukaemia and lymphoma. However, such an improvement was not observed for all cancers
In summary, we found evidence of poorer survival outcomes of leukaemia and lymphoma
associated with those of south Asian ethnic origin; particularly those aged over 15 years with
leukaemia and under 15 years with lymphoma. Further work should focus carefully on the
implementation and impact of the IOG for Children and Young People examining outcomes
between ethnic minority groups across the UK.
CONFLICT OF INTEREST STATEMENT
The authors have no conflicts of interest to declare.
ROLE OF THE FUNDING SOURCE
This paper presents independent research commissioned by the Candlelighters Trust [Grant
Reference Number RG.EPID.474842 to RGF] and the National Institute for Health Research
(NIHR) under its Research for Patient Benefit (RfPB) Programme [Grant Reference Number
PB-PG-1207-15237 to RGF]. The views expressed are those of the authors and not
necessarily those of the NHS, the NIHR or the Department of Health.
ACKNOWLEDGEMENTS
We acknowledge the help of Isabel dos Santos Silva from the London School of Hygiene
and Tropical Medicine for allowing the use of the SANGRA software package. We are
enormously indebted to the technical expertise of James Thomas, Eva Morris and Rebecca
Birch based at the Northern and Yorkshire Cancer Registry and Information Service for HES
data linkage; we also thank the Thames Cancer Registry for collating the HES data on
behalf of the UK Association of Cancer Registries. Finally, we are grateful to Paula
Feltbower for meticulous data collection and the co–operation of all oncologists,
REFERENCES
[1]. Steliarova-Foucher E, Stiller C, Kaatsch P, Berrino F, Coebergh J, Lacour B, et al. Geographical patterns and time trends of cancer incidence and survival among children and adolescents in Europe since the 1970s (the ACCISproject): an epidemiological study. Lancet 2004; 364: 2097-2105.
[2]. Stiller C, Bunch K. Trends in survival for childhood cancer in Britain diagnosed 1971-85. Br J Cancer 1990; 62: 806.
[3]. Birch JM, Pang D, Alston RD, Rowan S, Geraci M, Moran A, et al. Survival from cancer in teenagers and young adults in England, 1979–2003. Br J Cancer 2008; 99: 830. [4]. Gatta G, Zigon G, Capocaccia R, Coebergh J, Desandes E, Kaatsch P, et al. Survival of European children and young adults with cancer diagnosed 1995-2002. Eur J Cancer 2009; 45: 992-1005.
[5]. Farooq S, Coleman MP. Breast cancer survival in South Asian women in England and Wales. J Epidemiol Community Health 2005; 59: 402-406.
[6]. dos Santos Silva I, Mangtani P, De Stavola BL, Bell J, Quinn M, Mayer D. Survival from breast cancer among South Asian and non-South Asian women resident in South East England. Br J Cancer 2003; 89: 508-512.
[7]. Powell J, Mendez E, Parkes S, Mann J. Factors affecting survival in White and Asian children with acute lymphoblastic leukaemia. Br J Cancer 2000; 82: 1568.
[8]. McKinney PA, Feltbower RG, Parslow RC, Lewis IJ, Picton S, Kinsey SE, Bailey CC. Survival from childhood cancer in Yorkshire, UK: effect of ethnicity and socio-economic status. Eur J Cancer 1999; 35: 1816-1823.
[9]. Stiller CA, Bunch KJ, Lewis IJ. Ethnic group and survival from childhood cancer: report from the UK Children's Cancer Study Group. Br J Cancer 2000; 82: 1339-1343.
[10]. Kadan-Lottick NS, Ness KK, Bhatia S, Gurney JG. Survival variability by race and ethnicity in childhood acute lymphoblastic leukemia. JAMA 2003; 290: 2008-2014.
[11]. Linabery AM, Ross JA. Childhood and Adolescent Cancer Survival in the US by Race and Ethnicity for the Diagnostic Period 1975-1999. Cancer 2008; 113: 2575-2596. [12]. Geraci M, Eden T, Alston R, Moran A, Arora R, Birch J. Geographical and temporal distribution of cancer survival in teenagers and young adults in England. Br J Cancer 2009; 101: 1939-1945.
[13]. van Laar M, McKinney PA, Parslow RC, Glaser A, Kinsey SE, Lewis IJ, et al. Cancer incidence among the south Asian and non-south Asian population under 30 years of age in Yorkshire, UK. Br J Cancer 2010; 103: 1448-1452.
[14]. Steliarova-Foucher E, Stiller C, Lacour B, Kaatsch P. International Classification of Childhood Cancer, Third Edition. Cancer 2005; 103: 1457-1467.
[15]. Nanchahal K, Mangtani P, Alston M, dos Santos Silva I. Development and validation of a computerized South Asian Names and Group Recognition Algorithm (SANGRA) for use in British health-related studies. J Public Health Med 2001; 23: 278-285.
[16]. Cummins C, Winter H, Cheng KK, Maric R, Silcocks P, Varghese C. An assessment of the Nam Pehchan computer program for the identification of names of south Asian ethnic origin. J Public Health Med 1999; 21: 401-406.
[17]. Townsend P, Phillimore P, Beattie A. Health and deprivation: inequality and the North. Routledge Kegan & Paul 1988.
[18]. von Hippel P. How to impute interactions, squares, and other transformed variables. Sociol Methodol 2009; 39: 265-291.
[19]. Moons KGM, Donders RART, Stijnen T, Harrell FE. Using the outcome for imputation of missing predictor values was preferred. J Clin Epid 2006; 59: 1092-1101.
[20]. White IR, Royston P. Imputing missing covariate values for the Cox model. Statist Med 2009; 28: 1982-1998.
[21]. Rubin DB. Multiple imputation for non-response in surveys. New York: John Wiley & Sons 1987.
[23]. StataCorp. Stata Statistical Software Release 11. In Edition College Station: TX: StataCorp LP 2009.
[24]. Simon R, Altman DG. Statistical aspects of prognostic factor studies in oncology. Br J Cancer 1994; 69: 979.
[25]. Schoenfeld D. Partial residuals for the proportional hazards regression model. Biometrika 1982; 69: 239-241.
[26]. Collett D. Modelling survival data in medical research. CRC press 2003.
[27]. Royston P, Carlin JB, White IR. Multiple imputation of missing values: new features for mim. Stata J 2009; 9: 252-264.
[28]. Harrell Jr FE, Califf RM, Pryor DB, Lee KL, Rosati RA. Evaluating the yield of medical tests. JAMA 1982; 247: 2543.
[29]. Feltbower R, Lewis I, Picton S, Richards M, Glaser A, Kinsey S, et al. Diagnosing childhood cancer in primary care–a realistic expectation? Br J Cancer 2004; 90: 1882-1884. [30]. Turton D, Gonza´les J. (1999) Negotiating identities in a diasporic context: the Pakistani population of Bradford. In: Husband C. Cultural Identities and Ethnic Minorities in Europe. Universidad de Deusto: Bilbao, p. 93.
[31]. National Colaborating Centre for Cancer. Improving Outcomes in Children and Young People with Cancer; The Manual. National Institute for Clinical Health and Excellence, London: 2005.
[32]. Fern L, Davies S, Eden T, Feltbower R, Grant R, Hawkins M, et al. Rates of inclusion of teenagers and young adults in England into National Cancer Research Network clinical trials: Report from the National Cancer Research Institute (NCRI) Teenage and Young Adult Clinical Studies Development Group. Br J Cancer 2008; 99: 1967-1974.
[33]. Nur U, Shack LG, Rachet B, Carpenter JR, Coleman MP. Modelling relative survival in the presence of incomplete data: a tutorial. Int J Epidemiol 2009.
FIGURE LEGENDS
TABLES
Table 1: Number of cases by diagnostic group, age, and gender for those diagnosed with cancer within Yorkshire, 1990–2005
Number of Cases
South Asian Non-south Asian Total P-value
Diagnostic Group Cases (column %) Cases (column %)
Leukaemia 66 (24%) 649 (20%) 715
0.040
Lymphoma 71 (26%) 689 (21%) 760
CNS Tumours 37 (13%) 562 (17%) 599
Other Solid Tumours 101 (37%) 1359 (42%) 1460
Age at diagnosis (years)
0-4 66 (24%) 650 (20%) 716
0.743
5-9 40 (15%) 364 (11%) 404
10-14 37 (13%) 375 (12%) 412
15-19 42 (15%) 463 (14%) 505
20-24 41 (15%) 597 (18%) 638
25-29 49 (18%) 810 (25%) 859
Gender
Male 159 (58%) 1995 (61%) 2154 0.436
Female 116 (42%) 1264 (39%) 1380
[image:17.595.63.538.172.476.2]Table 2: Hazard ratios (HR) and 95% confidence intervals (CI) from a Cox regression model for those diagnosed with cancer in Yorkshire, 1990-2005.
Variable Model 1: All cancers combined
Category HR (95% CI)
Ethnicity NSA 1
SA 0.86 (0.65-1.15)
Gender Male 1
Female 1.12 (0.97-1.30)
Age at diagnosis 0-29 1.03 (1.02-1.03)**
Year of diagnosis 1990-2005 0.94 (0.91-0.97)**
Deprivation Townsend Score 1.02 (0.98-1.07)
Stage of Disease a I 1
II 2.39 (1.44-3.97)**
III 7.32 (4.61-11.60)**
IV 8.20 (5.52-12.16)**
Diagnostic Group Leukaemia 0.81 (0.59-1.09)
Lymphoma 0.61 (0.48-0.78)**
CNS tumours 1.58 (1.31-1.92)**
Other solid tumours 1
Table 3: Hazard ratios (HR) and 95% confidence intervals (CI) from Cox regression models for leukaemia, lymphoma, central nervous system tumours and other solid tumours, 1990–2005
Variable Model 1a: Leukaemia Model 1b: Lymphoma Model 1c: CNS tumours Model 1d: Other solid tumours
Category HR (95% CI) Category HR (95% CI) Category HR (95% CI) Category HR (95% CI)
Ethnicity NSA 1 NSA 1 NSA 1 NSA 1
SA 1.75 (1.10-2.76)* SA 2.05 (1.09-3.87)* SA 1.51 (0.82-2.78) SA 0.50 (0.28-0.89)*
Gender Male 1 Male 1 Male 1 Male 1
Female 1.03 (0.79-1.34) Female 1.21 (0.82-1.80) Female 1.00 (0.75-1.32) Female 0.97 (0.69-1.35)
Age at diagnosisa
0-4 1 0-4 1.28 (0.65–2.51) 0-29 1.02 (1.01-1.04)** 0-29 1.03 (1.01-1.05)**
5-9 0.70 (0.44–1.10) 5-9 0.66 (0.30–1.43)
10-14 1.11 (0.68–1.80) 10-14 0.46 (0.23–0.92)*
15-19 1.91 (1.24–2.96)** 15-19 0.77 (0.47–1.28)
20-24 2.62 (1.67–4.13)** 20-24 0.86 (0.55–1.34)
25-29 2.56 (1.62–4.03)** 25-29 1
Year of diagnosis 1990-2005 0.94 (0.92-0.98)** 1990-2005 0.95 (0.91-0.99)* 1990-2005 0.99 (0.96-1.03) 1990-2005 1.01 (0.98-1.04)
Deprivation 1.01 (0.97-1.05) 0.94 (0.89-0.99)* 1.01 (0.96-1.05) 1.03 (0.99-1.08)
Stage of Disease b Log(WCC) 1.26 (1.05-1.51)* I 1 I 1 I 1
II 1.06 (0.32–3.50) II 2.72 (1.50–4.92)** II 4.73 (1.17-19.04)*
III 1.47 (0.51–4.28) III 9.95 (5.29–18.74)** III 19.11 (6.00-60.82)**
IV 2.87 (0.93–8.83) IV 13.72 (7.76–24.26)** IV 20.10 (6.91-58.44)**
Diagnostic Subgroup ALL 1 HD 1 Ependymoma 1 Sympathetic NS 1
AML 1.98 (1.45-2.72)** NHL 2.49 (1.10-3.84)** Astrocytoma 2.36 (1.31–4.24)* Renal 0.35 (0.18-0.68)**
Other 0.87 (0.49-1.56) PNET 0.79 (0.42–1.49) Malignant bone 0.57 (0.26-1.24)
Other Glioma 3.68 (1.87–7.23)**
Soft-tissue
sarcoma 0.73 (0.40-1.32) Other 1.34 (0.64–2.81) Germ cell 0.19 (0.10-0.35)**
Other 0.45 (0.21-0.96)*