An exploratory policy analysis of electric vehicle sales competition
and sensitivity to infrastructure in Europe
Gillian Harrison
a,⁎
, Christian Thiel
b aEuropean Commission, Joint Research Centre, Directorate for Energy, Transport & Climate, Netherlands bEuropean Commission, Joint Research Centre, Directorate for Energy, Transport & Climate, Italy
a b s t r a c t
a r t i c l e i n f o
Article history:
Received 15 March 2016
Received in revised form 3 August 2016 Accepted 8 August 2016
Available online 26 August 2016
This research contributes to discussions about policy interventions to stimulate the transition of vehicle technol-ogy. Concentrating on passenger cars, an extensive system dynamics based market agent model of powertrain technology transitions within the EU up to 2050 is employed. With a focus on subsidy scenarios for both infra-structure deployment and vehicle purchase, and set within the context of the EUfleet emission regulations, wefind that there are important interactions between different powertrain types and with infrastructure provi-sion. For example, strong plug-in electric vehicle (PiEV) policy could inhibit the maturity of hydrogen fuel cell ve-hicles. Infrastructure provision is important for improving the utility of a PiEV, but wefind that in the early market it may have a weaker correlation with uptake than other policy options, until the PiEV stock share is over around 5%. Furthermore, an attempt to install a ratio of much more than one charge point per 10 PiEV may lead to little gains and high costs. PiEV sales are relatively insensitive at target levels over 25 PiEV per charge point. The results of our study can help policymakers tofind the right balance and timing of measures targeting the transition towards low carbon alternative vehicles.
© 2016 The Authors. Published by Elsevier Inc. This is an open access article under the CC BY-NC-ND license (http://creativecommons.org/licenses/by-nc-nd/4.0/). Keywords:
E-mobility
Automotive technology transition System dynamics modelling Charging infrastructure EU policy
1. Introduction
Electro-mobility is seen by many to be at the core of future mobility patterns. Electric Vehicles (EV–comprising Plug-in Hybrid Electric Vehicle (PHEV), Battery Electric Vehicles (BEV) and Fuel Cell Vehicles (FCV)), based on an electric motor powertrain, offer a potentially substantial contribution to overcoming environmental problems created by the widespread dependence on conventional automobiles. Conventional Internal Combustion Engine vehicles (ICEV), mainly fuelled with petrol or diesel, have dominated mobility for the past century. As the transport sector currently makes the third greatest contribution to global carbon emissions (IEA, 2016) and accounts for half of daily oil consumption (IEA, 2015), a paradigm shift in mobility is required. Within the context of climate change, this transition needs to occur within the next 30 years to avoid serious irreversible shifts in our climate (IPCC, 2013). In Europe, where transport is the second larg-est source of greenhouse gas (GHG) emissions, accounting for around a
quarter (EC, 2016), the European Union (EU) is committed to reduce GHG emissions economy wide by 40% (versus 1990 levels) by 2030 with road transport playing an important role towards achieving these targets (EC, 2014). Furthermore, the 2011 EC White Paper on Transport set a target of reducing road transport emissions by 60% of 1990 levels by 2050, and within this to“halve the use of‘conventionally fuelled’ cars in urban transport by 2030 and phase them out in cities by 2050” (EU, 2011a). Here,“conventionally fuelled”is defined as those vehicles powered by Internal Combustion Engine (ICE) only. Consequently, EVs as a zero tail-pipe emitting transportation option have arisen as a critical enabler for a low carbon economy (EU, 2014a) as well as for improved air quality.
Various studies have considered future EV market penetration, with both short and long term estimates varying greatly (Pasaoglu et al., 2012), and the IEA suggesting only a 9% global light duty vehicle stock share by 2030 and 40% by 2050 under their 2DS scenario (IEA, 2016). This seems far off EU targets, and as such regulation aimed at manufac-turers to reducefleet emissions has been introduced (EU, 2014b; EU, 2014c). Currently, only Plug-in Electric Vehicles (PiEVs–PHEV and BEV), are widely available. However, as yet, and despite rapidly growing sales (ACEA, 2016) they have failed to capture a significant passenger car market share and continue to be dependent on support measures, such asfinancial incentives (Mock & Yang, 2014; Thiel et al., 2015). One significant reason for this is limited consumer acceptance, due to high upfront costs and the phenomenon of range anxiety (Thiel et al., Abbreviations:BEV, Battery Electric Vehicle; PHEV, Plug-in Hybrid Electric Vehicle; PiEV,
Plug-in Electric Vehicle–BEV and PHEV; FCV, Fuel Cell Vehicle; EV, Electric Vehicle–PiEV and FCV; HEV, Hybrid Electric Vehicle; ICEV, Internal Combustion Engine Vehicle; pCP, public (slow) Charging Point; rCP, rapid Charging Point; PTTMAM, Powertrain Technology Transition Market Agent Model; DAFI, Directive on the Deployment of Alternative Fuel Infrastructure.
⁎ Corresponding author at: P.O. Box 2, NL-1755 ZG Petten, Netherlands.
E-mail address:Gillian.Harrison@ec.europa.eu(G. Harrison).
http://dx.doi.org/10.1016/j.techfore.2016.08.007
0040-1625/© 2016 The Authors. Published by Elsevier Inc. This is an open access article under the CC BY-NC-ND license (http://creativecommons.org/licenses/by-nc-nd/4.0/).
Contents lists available atScienceDirect
2012). In recognition of the cost barrier, many countries are introducing fiscal incentives (ACEA, 2014). In addition, both costs and range anxiety are related to the current capabilities of battery technology. Battery costs are reducing rapidly (Nykvist & Nilsson, 2015), but to alleviate the latter concern policy makers in countries across Europe are encour-aging the development of an appropriate charging infrastructure. There are various factors which may impact on the efficacy of infrastructure on uptake, including increasingly cheaper and more rapid chargers, battery capacity and private charging capabilities. This is often termed a “chicken and egg”problem, as infrastructure providers are reluctant to invest without a substantial EV market, yet drivers are wary of entering into e-mobility without the confidence of a reliant, widespread, and in-teroperable charging infrastructure.
Previous research related to EV policy has focused on the most wide-spread policies currently applied, which arefiscal incentives for users (ICCT, 2011a; Brand et al., 2013; Diamond, 2009; Gass et al., 2014; Hidrue et al., 2011; ICCT, 2011b; Lane & Potter, 2007; Tran et al., 2013) and regulation of manufacturer emissions or vehicle efficiency (IEA, 2008; ITF, 2010; Walther et al., 2010; Thiel et al., 2014). This research has generally agreed that due to the high cost differential between EVs and their conventional counterparts,fiscal incentives are required to encourage early adopters to the technology leading to successful pre-mass market penetration. From a supply-side point of view, manufacturers must be also encouraged to invest further in R&D of low carbon technologies in order to bring increasingly affordable and efficient EV into the commercial market. For example, besides fleet emission regulatory targets (EU, 2014b; EU, 2014c; EU, 2009a; EU, 2011b) and member state co-funded R&D projects, the‘European Green Vehicles Initiative’,1 has been an important public-private-partnership at EU level since 2008, funding numerous activities under the EU framework programmes for research and innovation (e.g. Framework Programme 7, Horizon 2020). Altogether there areN300 ongoing R, D & D projects with a total budget of nearly 3 billion euros across the EU co-funded by both the EU and member states. On the one hand these projects support technological improvements, most no-tably for energy storage and control devices, on the other hand, through field tests, they address customer acceptance and vehicle to grid inte-gration (Zubaryeva & Thiel, 2013).
In general, it is not controversial to suggest that policies to introduce sufficient public charging infrastructure are necessary to encourage the introduction of EVs (Bakker & Jacob Trip, 2013; OLEV, 2011). This is to overcome issues of range anxiety, identified to be one of the most signif-icant barriers to EV adoptions in many choice modelling studies (Batley et al., 2004; Beggs et al., 1981; Brownstone et al., 1996; Dagsvik et al., 2002; Eggers & Eggers, 2011; Ewing & Sarigollu, 2000; Potoglou & Kanaroglou, 2007). However, there has been little literature empirically exploring the relationship between minimum charge point provision and EV uptake, instead tending to focus (for example) on socio-economic or spatial distribution (Namdeo et al., 2014; Zubaryeva et al., 2012; Maia et al., 2015) and charging profiles (Robinson et al., 2013; Donati et al., 2015). Although these may be determinants of EV uptake, current EU policy is focused on guaranteeing a minimum ratio of charge points to EVs in order to avoid market fragmentation and ensure coverage across national borders (EU, 2014a). Recharging infrastructure has been analysed through evidence-based studies, expert elicitation and multi-criteria assessment for determining the policy promoters of EVs. For instance,Zubaryeva et al. (2012)identified that an adequate recharging infrastructure was one of the most impor-tant parameters for the large scale deployment of PiEVs in Europe, and (Sierzchula et al., 2014) have found that countries could achieve high adoption rates by increasing their recharging infrastructure levels. Other studies suggest that collaborative schemes between private and public authorities combining incentives and infrastructure are required
for success (Mock & Yang, 2014; Thiel et al., 2012; Rowney & Straw, 2013; Norbech, 2013; Lane & RAC, 2011). Hence, recharging infrastruc-ture can be considered one of the critical parameters in market penetra-tion of EVs.
This paper takes the EC Clean Power for Transport package (EC, 2013a) as a starting point and seeks to explore what impact govern-ment policy on infrastructure can have on EV uptake. In particular, we focus on the recently adopted Directive on the Deployment of Alterna-tive Fuels Infrastructure (DAFI) 2014/94/EU (EU, 2014a), and the pro-posals therein regarding minimum coverage of PiEV charging infrastructure by the end of 2020. We take the approach to identify what impact policy options may have on long term EV penetration. We analyse numerous policy scenarios, recognising that single e-mobility policies should not be considered in isolation as the interaction between multiple policies is highly relevant. For example, a suite of in-centives and other demand stimulating policies were employed by Norway, the most successful European country in terms of EV uptake (Mock & Yang, 2014; Norbech, 2013). Our approach seeks to under-stand how specifically supporting the infrastructural system may char-acterise uptake within the wider policy environment. For the wider policy environment we consider supply (e.g.fleet emission regulation) and demand stimulating policies (e.g. purchase incentives). To do this, our research employs an extensive system dynamics model of the EU automobile market, which reflects the relevant market agents of users, manufacturers, infrastructure providers and authorities. This research is the application of the model, which is described in detail in a Techni-cal Report (Harrison et al., 2016), and was presented in a previous paper by the authors (Pasaoglu et al., 2016). (Pasaoglu et al., 2016) was de-signed as an introduction to the model that could then be built upon in future publications such as this, as it focused on onlyfive generic sce-narios reflecting three market variables (learning rate, oil price and GDP) and two policy options (vehicle purchase subsidies andfleet emis-sion targets). The purpose of this study is to focus on the proviemis-sion of in-frastructure, including within the context of the previous policy options, in a timely investigation regarding the implementation of (EU, 2014a).
2. Model overview
The Powertrain Technology Transition Market Agent Model (PTTMAM) was developed at the EC Joint Research Centre (JRC) in col-laboration with Ventana Systems UK using Vensim™,2a leading and highlyflexible software for system dynamics model building and simu-lation. The purpose and focus of the model is to study the interaction be-tween, and influence of, the market agents on possible technology transitions within Europe, for each of the 28 member states and across the period 1995 to 2050. The use of system dynamics to analyse possible future scenarios of technology transition in the automotive sector has been explored by many authors (Walther et al., 2010; Bosshardt et al., 2007; Gomez et al., 2013; Harrison & Shepherd, 2014; Janssen et al., 2006; Kohler et al., 2010; Meyer & Winebrake, 2009; Richardson et al., 1999; Rodrigues et al., 2012; Shepherd et al., 2012; Struben & Sterman, 2008; Shepherd, 2014; Leiby & Rubin, 1997; Stepp et al., 2009; Boksberger et al., 2012; Stasinopoulos et al., 2012; Diwaker et al., 2013). Recent overviews of such studies can be found in Harrison and Shepherd (2014)andShepherd (2014). Many of these have a limited focus, for example on one particular powertrain or coun-try. At the other extreme,Gomez et al. (2013)focus on a simplified high-level global view. Their purpose ranges between forecasting deployment, detailed policy analysis, manufacturer strategies and environmental or economic assessments. To our knowledge, the model presented here is thefirst attempt to address not only the most relevant interacting agents within the light duty vehicle market (i.e. automotive manufacturers and suppliers, infrastructure providers,
1
http://www.egvi.eu 2
policymakers, and consumers) in a European context, but also the com-petition between all current and future alternative fuel and powertrain technologies, across all member states. A similarly broad model was developed byWalther et al. (2010)and adapted by Harrison and Shepherd (2014), but this focused on the Californian case and was not as detailed or complex as the model we have developed. Some other studies may have been more detailed in their approach towards specific areas, e.g.Kohler et al.'s (2010)consideration of the hydrogen fuelling network, Diwaker et al.'s (2013) focus on the R&D program or Stasinopoulos et al. (2012)who looked at materials used, but this was a level of detail not required in our model. Our approach allows us to capture the complex and sometimes conflicting interests that actually exist in the automotive sector. It also enables us to study the impact of interacting policies on technology transitions in this sector. Neverthe-less, the reader should be mindful that a model is a simplified represen-tation of reality and should therefore be viewed as a means of comparing“what if”scenarios, rather than providing predictive or precise results.
The model is detailed and complex, containing over 700 simulta-neous equations and 300 constant values, within 13 causal feedback loops. When the base elements are combined with the subscripts employed within the model (such as powertrain type, member state or vehicle size), this leads to over 700,000 elements overall. Within the model, four conceptual market agent groups (manufacturers, users, authorities and infrastructure providers) are represented by key decision rules and feedbacks. In its current form the model does not cap-ture the behaviour of individuals within the system as agent based modelling could, such as proposed or applied by numerous authors (Wolf et al., 2015; El Banhawy et al., 2014; Shafiei et al., 2012a; van der Vooren & Brouillat, 2013; Eppstein et al., 2011; Noori & Tatari, 2016). However, a certain disaggregation of the representative agent groups is partially implemented (for example the distinction of urban and non-urban drivers) and could be furthered, if substantiated by behavioural data. The model inputs have been sourced from numerous publications and expert opinions, but importantly including Eurostat3and TRACCS4, and for future transport/energy demands the EU 2050 Energy Trends Reference Scenario (EC, 2013b). Some key pa-rameters (such as vehicle demand) have been calibrated to historical data, and sensitivity tests and reality checks were carried out to ensure model robustness. Calibration (or optimisation) of values is a standard approach across manyfields applied to the determination of input data not readily available (Valipour, 2015; Valipour et al., 2015; Li et al., 2014; Lim et al., 2014). A more comprehensive overview and in-troduction to this model is presented inPasaoglu et al. (2016)and Harrison et al. (2016). Although we urge the reader to refer to these sources, some key elements and updates relevant to this research are presented below.
2.1. User purchase decisions
Fundamental to the model is the ability to capture behavioural dy-namics of the users within the system. At the centre of this mechanism within the model is a modified version of the highly cited Willingness to Consider (WtC) concept as developed byStruben and Sterman (2008) and adopted in numerous models since (Walther et al., 2010; Shepherd et al., 2012; Kwon, 2012; Shafiei et al., 2012b). WtC“captures the cognitive, emotional and social processes through which drivers gain enough information about, understanding of and emotional attach-ment to a platform (powertrain) for it to enter their consideration set”.
WtC builds up over time through social exposure to the alternative powertrain (from marketing and interaction with both users and non-users), but can also decay as that social exposure is‘forgotten’, until a tipping point is reached when the powertrain remains within the deci-sion set.
The WtC is then combined with relativefinancial attractiveness (based on total cost of ownership), and perceived values and impor-tance of seven attributes that characterise each powertrain (Eq.(1)). Together these determine the overall attractiveness as a combined utility for that powertrain, specific to a member state, powertrain, user group and vehicle size class. The powertrain attributes were chosen as to reflect available information on consumer choice on importance (Capgemini, 2008; Deloitte, 2011) but also simplified as development of future powertrains is uncertain. They are however in line with more detailed choice modelling studies such as those cited in the Intro-duction. The attribute values evolve over time in relation to the maturity of the individual powertrain components that are themselves improved by technology uptake and the R&D effort of the manufacturer. It would be beyond the scope of this paper to go into the development of all the criteria in detail, though it is relevant to note that convenience incorpo-rates the role of infrastructure provision in purchase behaviour (see later). Thefinancial attractiveness is an assessment of the total cost of ownership by the user, which includes the purchase price (as set by the manufacturer and adjusted by authorities with subsidies and taxes), and a proportion of the running costs.
Combined utilityPi¼∑AðAttribute valuePiAttribute importanceÞ Willingness to considerPi
Financial attractivenessPi ð1Þ
Eq.(1): Combined utility of powertrain Pi.
Attributes = choice, convenience, environment, performance, reliability, safety, popularity.
All values except attribute importance are calculated endogenously. A standard multinomial logit choice framework, Eq.(2), similar to the approach employed by Struben and Sterman, is used for the assess-ment of the user's preferred powertrains (and thus the indicated market share) using the calculated combined utility.
Indicated market share¼ eCombined utilityPi−1
∑
P
eCombined utilityPx−1 ð2Þ
Eq.(2): Indicated market share of powertrain Pi. Combined utility calculated using Eq.(1).
2.2. Infrastructure provision
The powertrain attribute convenience, which contributes to the combined utility, represents the access to effective infrastructure for refuelling or recharging a vehicle, as well as the provision of mainte-nance facilities (which isn't discussed in this paper). Within the PTTMAM, the conceptual infrastructure provider group decides on the type and amount of fuelling and charging facilities to invest in, reacting to signals from the other market agents and based on a desired return on investment (ROI).
2.2.1. Charging infrastructure
The convenience attribute for PiEV is represented by the average population in each country with access to public (slow) or private (home/work) charging and the proportional achievement of a desired rapid charging network. Although the presence of rapid-charging sta-tions improves the convenience for those with the requirement to re-charge on the move, it does not improve access for vehicle owners with no private means of recharging. PHEV convenience is further infl u-enced by a weighting of the relative availability of charging and 3
http://ec.europa.eu/eurostat/web/main/home
4
refuelling infrastructure. The electricity charging infrastructure feed-backs within the model focuses on the provision of public charge points (pCPs) and rapid charge points (rCPs) as private charging is considered to be deployed in combination with the vehicle sales. The installation of CPs relates to the expected revenue as shown in Eq.(3), though pCP and rCP are considered separately in the model. Both installation and running costs decrease as the number of installed CPs increases, representing a combination of learning effects and economies of scale. The required additional revenue (for desired ROI) is compared to an es-timate of additional revenue from potential use, determined from an as-sessment of forecast visits (of forecast urban and non-urban PiEV users with and without private access) and a presumed revenue per visit and frequency of visits. Though early adopters of PiEV are likely to be those with private charging access, as penetration increases it is more likely that some PiEV users would be making sole use of public charging net-work. Both pCP and rCP are stocks which grow over time.
Desired CP installation
¼Running costsForecast revenueþInstallation cost−Current revenueð1þDesired ROIÞ ð3Þ
Eq.(3): Desired installation of charging infrastructure in each country.
All values are calculated endogenously, except ROI which is taken to be 0.2.
Maximum and minimum costs are derived from (Gardien & Refa, 2015; Plotz et al., 2014).
2.2.2. Hydrogen fuelling infrastructure
Similar to CPs, infrastructure providers will add hydrogen fuel to an existing fuelling station if their forecast fuel revenue could deliver a de-sired ROI (here, a country specific calibrated value in the PTTMAM). The number of desired fuelling stations to invest in is therefore determined using a similar calculation as Eq.(3). Forecast fuel demand is based on a 3 year forecast stock of the relevant powertrain and annual fuel consumption (based on a reference value (Edwards et al., 2014) and modified by improvements to the powertrain as a result of R&D activity within the model). Revenue is based on a fuel cost (Tremove, 2010) and calibrated fuel margin. Investment costs reduce over time depending on the current installed base of hydrogen fuelling stations. In addition, fuel-ling stations may be dropped if they are no longer deemed sustainable.
2.3. Policy implementation
The PTTMAM was designed to enable to the modeller to create sce-narios related not only to market conditions but also policy strategies. There are numerous inputs related to subsidisation and taxation of vehi-cles, fuel and infrastructure that can be defined by the modeller at either country or EU-wide levels. Moreover, the PTTMAM includes the most significant EU regulation related to the control of manufacturers regard-ing newfleet emissions. Here, the model structures relevant to the pol-icy levers considered in this paper are briefly described.
2.3.1. Manufacturer emission regulations
Within the model, the current EU light dutyfleet emission regula-tions (EU, 2014b; EU, 2014c; EU, 2011b; EU, 2009b) are captured. Aver-age tailpipe CO2 emissions of new vehicles are assessed against a specific emission target per vehicle as defined in the regulations (Eq.(4)) and authorities charge manufacturers penalties for thosefleets with averages above a specified threshold. This excess emission premi-um is designed to incentivise investment in low carbon vehicle technol-ogy, as Manufacturers base their R&D investment decisions on forecast future emission penalties from speculative demand.
Emissions target¼Base targetþaAverage mass−Mo ð4Þ
Eq.(4): Emissions target (g/km) (as defined in the regulations). Base target = PC 130 g/km; 95 g/km from 2021. LCV 175 g/km; 147 g/km
a = 0.457; 0.333 from 2020.
Average mass = based on (Thiel et al., 2014) Mo = 1372 kg up to 2016, 3 year average thereafter.
2.3.2. Vehicle purchase subsidies
At the EU level considered in this study, vehicle price subsidies are entered by the modeller as a proportion of the cost differential between the subsidised powertrain and the conventional ICEV powertrain. The effect here is an improvement in thefinancial attractiveness of those powertrains and thus a greater combined utility that leads to a higher market share. In addition, having the subsidy in place can lead to in-creased marketing of the powertrain by manufacturers and a demand kick over and above the standard utility as users are aware of the offer being in place, and possibly short-lived.
2.3.3. Infrastructure subsidies
The PTTMAM input for subsidies for infrastructure providers for the installation of infrastructure is entered as a proportion of the costs for each fuel and separate year of the simulation. This subsidy assists the frastructure provider as it reduces the installation costs making the in-vestment more attractive for achieving the desired ROI. In addition, for charging infrastructure, for which the subsidy only covers pCPs (not rCPs) there is a default assumption of an authority desire of 10 PiEV per pCP, as per the DAFI indicative suggestion to member states. For hy-drogen, there is no such limit.
3. Scenarios
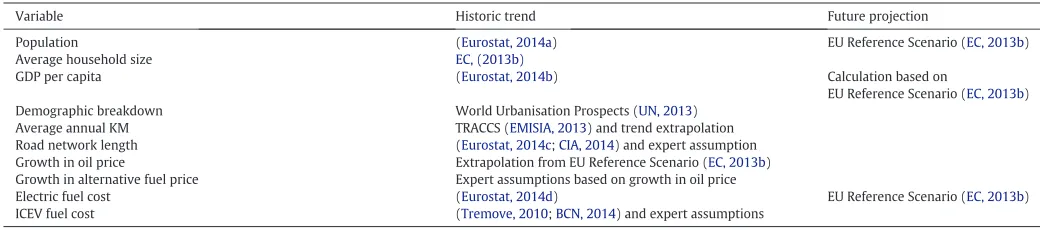
[image:4.595.34.555.681.744.2]The policy scenarios of this research have been modified and wid-ened, compared to earlier applications of the model (Pasaoglu et al., 2016). In this study a number of credible yet realistic levels for each pol-icy have been designed based on this, and an extra subsidy for infra-structure is included to reflect the focus of the study. A table of sources for key variables for the baseline conditions, as used in the PTTMAM Technical Report (Harrison et al., 2016) is shown in the annex. In this research our interest lies in analysing the interaction of various policy options: CO2 regulations on the manufacturer, EV purchase subsidies for the user, and infrastructure subsidies for the
Table 1
Initial policy scenario levels (NB: infrastructure subsidies are all hypothetical).
Scenario level R regulatory CO2target (g/km) P EV purchase subsidy (% of ICEV cost differential) I 100% infrastructure subsidy
infrastructure provider. For the CO2regulation and infrastructure subsi-dy duration we consider four levels and for the EV purchase subsidies we consider the same level and an additional“High”level, as detailed inTable 1. All regulation scenario levels, and the purchase subsidy current and high scenario levels are based on current and proposed targets (Pasaoglu et al., 2016). The projected subsidy would seem in line with governmental intentions, for example, the UK government have recently announced an extension of their plug-in car grant until
[image:5.595.141.459.175.727.2]at least 2018 (OLEV, 2015) and the German government contemplates purchase premiums for EV (FAZ, 2015). The extended EV subsidy scenario prolongs the subsidy to 2025. Infrastructure subsidies are designed to be optimistic and are hypothetical examples employed to un-derstand the impact of increased infrastructure rather than representing specific policies. Our baseline scenario described above is scenario R1P1 (Current regulatory targets and purchase subsidies, no infrastructure subsidies).
4. Results of scenario runs
Fig. 1presents the results from our model for the initial policy scenarios with no infrastructure subsidies in place. These results will be discussed in more detail in the following sections. However it is worth noting at this point some high level observations. Unsurprisingly, stronger policies and combining policies generally leads to more successful results. This aligns well with observations from previous studies (Pasaoglu et al., 2016; Harrison & Shepherd, 2014; Stepp et al., 2009; Brand et al., 2012; Foxon et al., 2005; ITF, 2008). The“ no-regula-tion”scenarios (R0) experience limited EV success by 2050, where the EV share is in fact lower than in 2020. The scenarios with a CO2 regula-tion in place (R1) witness stronger EV deployment with stricter targets. The tightest regulatory targets (R2–3) are most beneficial for all EV. Longer term emission targets (R3) have a greater impact on FCV success than on PiEV deployment by 2050. Having purchase subsidies in place does make some impact, especially in 2020 and 2030 results, compared to their no-subsidy counterparts, though the durations tested results in little variation. However, had there been higher purchase subsidies in place from 2010 (P4), EV share would have been much more successful by 2020, though this impact has diminished by 2050 in all but the no regulation scenario.
4.1. Comparison to real world data
It was felt at this time that comparison of our model baseline perfor-mance to both historic and future changes would be insightful. At the time of writing, 5 years of data have been gathered on the sales of EV by the EEA for the monitoring of thefleet emission regulation directive. This data has been further analysed in previous work (Thiel et al., 2015), and sales shares based on this are presented and compared with our model results in the table below (Table 2). Bearing in mind that we are not claiming the model to be accurate in a forecasting capacity, the results for thesefirstfive years of data would appear to be more or less in line with the sales being witnessed in reality. Although in 2012 and 2013 the model would appear to slightly over-predict sales share, 2014 is similar. However, it should be also borne in mind that at sales of such low shares as at present it is not appropriate to suggest accuracy of the model, but as a reassurance that such promising similarities would lend credence to our later results.
4.2. Comparison to existing studies
It is not the intention for this model to be used in a predictive capac-ity for future market shares, but to analyse the relative impact of policy options between different scenarios. However, for context, it is useful to see how our model behaves in relation to studies designed to describe EV outlook. For this, inTable 3we compare our initial policy scenario results to the range reported in a previous study that included a meta-analysis of EV penetration rates from 10 studies (Pasaoglu et al., 2012). This was the most recent study we could identify with all of this data compiled, though a 2016 BNEF study with only one scenario suggested an approximate 5% of sales would be PiEV by 2020 and 40% by 2040 (however under their optimistic conditions BEV is costs com-petitive with ICEV by 2022 and therefore is the dominant PiEV) (BNEF, 2016). The studies included in this analysis comprised of some with different scenarios (low-high decarbonisation) and some with baseline/reference only. The table thus shows the ranges for low, med/base and high, against the ranges from scenario ranges R0Px, R1Px and R2–3Px respectively. These groupings would feel to be appro-priate representations of such low-high scenarios in line with the com-parisons. It would appear that although our model may appear to be on the conservative side for all but HEV, the relative shares between alter-native choices seem to be in line with these other studies. Interestingly this also demonstrates the wide range in predictions that does exist due to differing scenarios and assumptions employed between studies, and therefore the lack of certainty in EV sales projections, justifying our ap-proach to concentrate on relative impacts, though some confidence in the range of absolute numbers is provided by the previous observations comparing to real world data.
4.3. Baseline for comparison (R1P1)
Under our baseline scenario (R1P1–current regulation and pur-chase subsidies), there is a 5% EV market share of sales by 2020, and a 9% HEV share. By 2030 we see that the share of conventionally fuelled vehicles (ICEV) has been reduced by over a third from 100% in 1995 and the EV market share has grown to 20%, and FCV has not yet penetrated the market. ICEV is further reduced to around 40% by 2050, when PiEV have captured 42% of the market, though FCV has still failed.
4.4. Scenarios with no CO2target (R0Px)
[image:6.595.33.285.548.619.2]In comparison to our baseline (R1P1), without any policy in place (R0P0), conventional vehicles reduce to only 95% in 2020, 92% in 2030 and 81% in 2050. This technology transition arises solely from HEV cap-turing approximately 19% of the market, and the remaining EV powertrains are not successful. Although thisfirst observation may seem an obvious one, it confirms that by introducing policy conditions within this model we do achieve technology transition as would be ex-pected. With purchase subsidies but nofleet emission regulations (R0P1–3), EVs still never achieve a significant market share, with only PHEV gaining a share above 2% even by 2050. When the high level pur-chase subsidies are in place (R0S4), we see more clearly the diminishing
Table 2:
Comparison of model baseline (R1P1) to actual data, sales market shares (in %). 2010 2011 2012 2013 2014 PHEV Actual 0 0.003 0.07 0.21 0.53
Model R1P1 0 0 0.12 0.45 0.62 BEV Actual 0.006 0.07 0.12 0.20 0.31 Model R1P1 0.006 0.10 0.22 0.35 0.30 FCV Actual 0 0 0.0002 0.0004 0.0003
[image:6.595.32.554.660.744.2]Model R1P1 0 0 0 0 0
Table 3
Comparison to other studies (other studies data taken fromPasaoglu et al., 2012).
HEV PHEV BEV FCV
Other studies Own Other studies Own Other studies Own Other studies Own
2020 Low 4–10 5 1–5 0–1 0–2 0
Med/base 9–17 9 3–5 0–4 1–3 0–2 High 13–18 9 2–15 0–4 3–12 0–2
2050 Low 8 19 18–25 0–2 10–14 0–1 4–5 0
impact of the subsidies from 2020 to 2050, but also that the more generous subsidy amount has led to EV shares 3–4 times greater than the comparative scenarios.
4.5. Current regulation scenarios (R1Px)
Compared to the scenarios R0, which include no regulatory tar-gets or penalties, under R1 we already see an improvement in alter-native market shares by 2020, which is more than double of the scenarios withoutfleet regulation (from 5 to 6 to 9–15%). This im-pact is more obvious later in the simulation. By 2030, ICEV sales are a third lower than the no regulation scenarios, whereas alternative powertrains now account for almost 40% of all sales, compared to 10% in the previous scenarios. By 2050 the effect of having the regu-lation in place is a halving of ICEV sales share from the previous sce-narios under all subsidy options. However, EV sales reach around a third of the market by 2050, though only the no purchase subsidy scenario (R1P0) has any FCV sales.
By introducing EV purchase subsidies (R1P1–4), in 2020 there is noticeable uptake of PHEV and BEV compared to R1P0 (no EV pur-chase subsidies), resulting in almost twice the PHEV and BEV shares by 2030, though there is marginal impact from the actual duration of the subsidy availability. However, this additional share would appear to come not from ICEV share but from lowering HEV and FCV shares. Atfirst, this would seem to be counter-intuitive. However, on investi-gation this phenomenon hints upon the importance offinding the right timing for supply and demand stimulating policies and analysing their interaction. The following two mechanisms can explain this in more detail:
• ICEV purchase price is lowered: As purchase subsidies are introduced, and successful (as seen in the 2020 EV shares), the resultantfleet emissions are reduced thereby leading to lower predicted penalties for the manufacturer or less need for CO2improvements for the conventional vehicles than under the no purchase subsidy scenario. The price of the higher polluting conventional vehicles are altered by the manufacturer dependent on the predicted penalties (vehicle price is proportionally adjusted to forecast emissions and penalties to deter sales). As such, lower predicted penalties result in a lower conventional vehicle price. This therefore further increases the financial attractiveness (and therefore utility and resultant sales market share) of ICEV relative to other powertrains, in comparison to the no-subsidy scenario.
• R&D investment is lowered: Similarly, with lower penalties being pre-dicted, the manufacturer is less stimulated to invest in R&D as meet-ing emission targets is supported by subsidised EV sales. Due to this, the cost and technical performance of EV components do not improve as rapidly as in the no purchase subsidy scenario, R1P0. This results in a lower score for the alternative powertrain attributes and a higher purchase price for them. Thus, the utility of the FCV is lower in the R0P1–4 scenarios and therefore they achieve lower sales market share growth. The same is true for HEV that is not supported by pur-chase subsidies. BEV and PHEV sales are boosted by the subsidies but this favourable effect is attenuated after 2030 due to lower R&D in-vestment yielding less favourable utilities between 2030 and 2050 when compared with R1P0. FCV gains no success when subsidies are in place and this results in a severe inhibition of maturity. As FCV is less mature than the PiEVs at the start of the simulation, and be-comes available later than these powertrains, it is more greatly affect-ed by the lack of R&D investment. As FCV sales do not develop, neither does the hydrogen infrastructure, thus further lowering the utility of the vehicle compared to R1P0. This then perpetuates throughout the simulation, as predicted sales (based on current sales) are also lower than R1P0 and accordingly the forecast profits from FCV are lower. As potential profits determine R&D spend, investment is
never as much as R1P0 and therefore components never mature to the same level, so sales of FCV remain low.
4.6. Projected CO2emission regulations (R2Px)
Comparing the projected regulations scenarios (R2) to the current regulation scenarios (R1), there are no differences in 2020, as the conditions are the same. By 2030, we see a higher deployment of alternative powertrains when the projected regulations are in place. Most noticeable is that FCV has a small market share that was not achieved in the previous scenarios. The stricter CO2target and related predicted penalties for the manufacturers drive decisions for R&D investments. The manufacturers make the same investment decisions as in the current regulation scenarios, up until 2025 (the model is set to consider known changes 5 years in advance). From this point, although investment in BEV and PHEV is marginally increased, most R&D funds go into FCV as it has the greatest potential technology/cost improvement remaining, and therefore provides the greatest leverage for reducing thefleet CO2emissions and avoid penalties. The biggest impact by 2050 of the projected emissions occurs when no subsidies are in place (R2P0), as PiEV sales are increased compared to the R1 scenarios by around 50%. In all the purchase subsidy scenarios, 2050 PiEV sales are only slightly improved compared to the current regula-tions scenarios. ICEV sales are more than halved to around 20%, with the majority of these sales attributed to FCV, now selling better than BEV. This would suggest that more ambitious, long termfleet emission targets are most beneficial to FCV. In relation to the previous discussion on FCV market failure due to lack of investment, the higher targets en-courage the R&D investment in FCV required to ensure success. In future work, a closer look at the tipping points to where this occurs may be useful in order to better set target and penalties in future regulation. Similar to the previous discussion on current emission regulations, al-though having purchase subsidies in place in addition to regulations would seem to make an impact on EV uptake, particularly in the earlier years and for PHEV, they would also seem to be marginally less favourable for HEV and FCV by 2050, and could result in making ICEV more attractive to the user in later periods. Furthermore, there is little impact from increasing the duration of the purchase subsidies.
4.7. Extended CO2emission regulations (R3Px)
Ourfinal set of initial policy scenarios considered even more ambi-tious CO2emission regulations, compared to those previously discussed in 4.6 (R2Px). Similar trends observed also persist within this category of scenarios. There is no difference by 2020 to the current regulations as there is no difference in the scenario design for this time-frame. By 2030, we see a slight increase in alternative market shares on the projected regulations (around 1% point for each powertrain), despite a 20% higher emissions target in 2030. Again, this lower than expected im-pact arises from a combination of investment decision dynamics and intra-powertrain competition. However, by 2050 there is a much more noticeable impact compared to the projected emission regulation scenar-ios. ICEV shares are halved, HEV reduced by around a third, and BEV, PHEV and FCV have increased by around 40, 30 and 20% (resp.), when purchase subsidies are in place, and 50, 40 and 20% without. Again in these scenarios the early addition of EV purchase subsidies can create a certain technology lock-in in favour of BEV and PHEV, penalising the cur-rently less mature FCV, though the effect is somewhat diminished by 2050.
4.8. High purchase subsidy scenarios (RxP4)
have led to the greatest EV shares by 2020 of all scenarios by over 100% or 300% when no purchase subsidies are in place. By 2030, the impact is not so great, other than in the no regulation case (R0). Here, the ICEV share is up to 8% points lower, BEV has a 2% share where there was none before, and PHEV share has more than tripled to 7%. When regula-tions are in place, however, ICEV shares are similar to the previous sce-narios when high purchase subsidies are in place, though there is a 20% improvement in total EV sales shares from being more competitive with HEV, rather than ICEV. Similar observations carry through to 2050, where the subsidies have also reduced FCV sales, and ICEV share is slightly higher for similar reasons as already remarked upon. Therefore with just these simple tests we can deduce a similar conclusion to pre-vious work that even high purchase subsidies do not appear to have long term impact, but can stimulate the EV market when it is in its infan-cy, which may be particularly beneficial in cases of an otherwise failing market (Shepherd et al., 2012). Although thisfinding may not be novel, it does support confidence in the integrity of the PTTMAM.
4.9. Infrastructure subsidy scenarios (RxPxI1–3)
The results of the tested infrastructure scenarios are presented inFig. 2. 2020 is not shown as there is no impact by this point, despite infra-structure subsidies being in place for ten years, compared to the initial policy scenarios. Furthermore, as can be seen, there is little impact even by 2050 for any duration of infrastructure subsidy. There is only a marginal decrease in conventional vehicle share that is slightly more pronounced when the longer duration subsidies are in place. Under cur-rent regulations (R1), FCV still does not achieve any market penetration despite the 100% subsidising of H2infrastructure. This is because the powertrain itself is never strong enough to compete with the PiEVs that were introduced earlier in the simulation. For the projected and
extended emission scenarios, R2–3, the longer duration infrastructure subsidies have led to slightly lower FCV shares, as the subsidies are more beneficial for the already stronger PiEV powertrains. The PiEV on the other hand, have already profited and similar competing dynamics as previously observed have set in to suppress the FCV market. In fact, FCV never has shares greater than the comparative scenarios without infrastructure subsidies are in place, and only when based on the highest purchase subsidy scenario (P4) does the longest duration infrastructure subsidy achieve the highest FCV share. In this case, the increased utility of the FCV from the increased number of hydrogen fuelling stations due to subsidies leads to the greater market shares, taking shares otherwise given to PiEV under the comparative scenarios. The reason for this would appear to be in the detail at an attribute level. Although the infrastructure subsidies have increased the convenience attribute (relative to the base), leading to greater combined utility (and thus shares) up until around 2030, it is the popularity attribute (based on vehicle stock), causing a lower combined utility from this point. This is because the additional infrastructure has been favourable to the PHEV rather than BEV, where shares are lower (or at least the same). Once this effect kicks in it begins to perpetuate as the BEV popu-larity remains consistently lower than the base scenario, causing even lower shares. This effect has then led to lower forecasts for future BEV, and thus lower forecast infrastructure requirements. The lower invest-ment in infrastructure has then reduced the convenience for PHEV and thus lower shares for this powertrain also. In summary, it would seem to be that the infrastructure subsidies tested here are most bene-ficial for PHEV, but without strong manufacturer regulation is not strong enough to be self-sustaining for any EV penetration.
[image:8.595.123.469.390.731.2]These results have to be considered in conjunction with the deployed infrastructure.Fig. 3shows the cumulative number of pCPs installed through the simulation under all scenarios. Solid lines are
those scenarios with no infrastructure subsidies in place. For those based on current vehicle purchase subsidies (P1), there is little differ-ence when the short-lived infrastructure subsidies (dotted line) are in place. This is because the PiEV shares are only marginally higher as discussed above. When the infrastructure subsidies are extended beyond 2020 (dashed lines), the rate of installation is greater, but still no deviation between these scenarios is seen until after 2030. Under the most ambitious regulatory scenario (R3), there is a greater pCP installation without infrastructure subsidies than any duration of subsidies combined with the lower regulatory targets. Having the higher purchase subsidies in place (lighter coloured lines) follows similar trends, though the shortest-lived infrastructure subsidies does result in a higher initial rate of infrastructure deployment than the base, as early PiEV shares are higher. Setting thesefindings within the context of the impact of the infrastructure subsidies on PiEV shares, it would seem to be clear that pCP installation is disproportionate to mar-ket shares. In other words, infrastructure subsidies may be successful in increasing pCP provision under certain conditions, but the magnitude of the effect does not feed back into PiEV sales success.
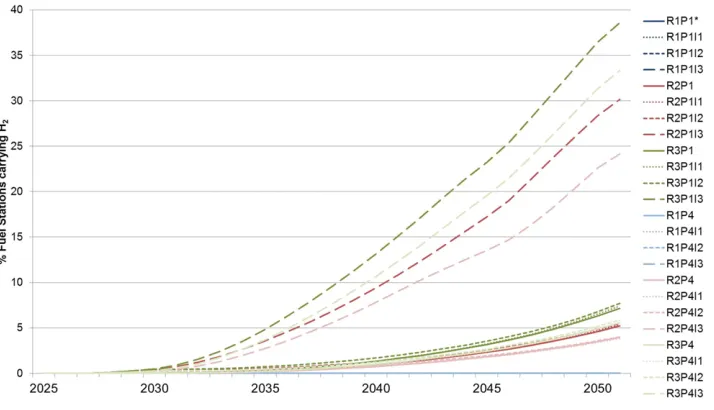
The share of fuel stations carrying hydrogen that have been deployed under the different infrastructure subsidy levels are shown inFig. 4. Under the currentfleet regulation scenarios (blue lines), as no FCV share builds up, there is never enough stimulus to build H2 infra-structure, even with the longest infrastructure subsidies in place. In fact,
for all remaining scenarios, there is no infrastructure until the late-2020s when, in our model results, the FCV enters the market with larger numbers. As such, even the mid-term infrastructure subsidies only sup-port an initial small number of H2fuelling stations. H2coverage grows to only a maximum of 7.5%, with the extended regulations being most suc-cessful. Under the projected and extendedfleet emission regulations, there is only a significant H2infrastructure installation when the infra-structure subsidies remain in place through to 2050 (longer dashed lines). Yet still, due to low FCV shares, coverage does not exceed 40%. As can be seen inFig. 4, those scenarios with high purchase subsidies (lighter lines) have lower H2infrastructure deployment, as the FCV shares are lower, as observed above.
The results reveal that the PiEV profit more from the infrastructure subsidies than the FCV, and this leads to a certain technology lock-in, resulting in a reduction of deployed FCV. The lower FCV share again has an impact on the effectiveness of the hydrogen infrastructure subsi-dies. This stresses the importance offinding the right balance, degree, and timing of policy measures in order to avoid undesirable effects.
5. Sensitivity to charge point targets
[image:9.595.125.480.55.246.2]Focus now turns specifically to PiEV and their charging infrastruc-ture. As mentioned in 2.3.3, the DAFI indicates a desire for a ratio of 10 PiEVs per pCP (PiEV/pCP) for member states. To understand the
Fig. 3.Charging point installation.
[image:9.595.127.484.526.731.2]sensitivity to this, and in the light of the disproportional relationship between pCP installation and market share identified in the previous section, we ran our baseline scenario with long term infrastructure sub-sidies (R1P1I3) several times at different PiEV/pCP ratios, looking at the impact in 2050 on sales market share, installed pCPs and assumed cost. As can be seen inFig. 5, which demonstrates the divergence as the PiEV/ pCP ratio differs from 10, a general observation is that doubling the PiEV/pCP ratio roughly halves both the number of installed pCPs and cost to authorities in our model results, up until around 25PiEV/pCP, after which the target has no bearing on the total costs or installed pCP. Indeed, whereas with a target of 10PiEV/pCP around 50% of installed pCPs were funded by the authorities, for 25 PiEV/pCP this re-duces to 5% and below thatb0.2%. It does not, however, have a similar correlation with market share. It can be seen that as the PiEV/pCP ratio decreases, both installed pCPs and their costs have a significantly greater and more rapid increase than market share, which is more pro-nounced inFig. 5due to the secondary axis. On the other hand, increas-ing the PiEV/pCP ratio follows a shallow reduction as PiEV stock is still low. This suggests that the successful impact on share is relatively insen-sitive to desired ratio at levels below 5 or above 25 PiEV/pCP.
Leading from this insight, we explored if our model results would indicate some saturation level of the PiEV/pCP ratio target. We carried out tests (of the varying PiEV/pCP ratios used previously) under the in-frastructure scenarios with long term 100% inin-frastructure subsidies when projected or extended emissions targets are in place and current or high purchase subsidies are in place, as well as the baseline (I3, I6, I9, I15, I18). The resulting evolution of PiEV stock and sales shares are shown inFig. 6. The charts reveal the impact of the purchase subsidies
over time, which was not clearly observed in the previous results where we concentrated on three distinct points in time. Both the sales shares (on the left) and the stock shares (on the right), follow similar trends, as one would expect. Concentrating on sales, the two scenarios with the high purchase subsidies in place (P4), have advanced the take-up of PiEV compared to the current purchase subsidy scenarios P1. With the highest level of subsidy in place the rate of uptake was much more rapid. The 2015 local peak in P4 scenarios shows the impact when the offered discount is reduced from 75 to 50%. It highlights the importance of carefully designing the phase in and out of subsidy schemes as the market will react very sensitively to abrupt changes. This effect could be observed in Estonia in autumn 2014, when the EV subsidy scheme expired (Thiel et al., 2015). In the period during which the 50 and 25% discounts are in place (2015–2025), the calculat-ed rate of uptake does not appear to differ from the scenarios which have no subsidy in place at this point. This suggests that the magnitude of the EV purchase subsidy would need to be high enough so that the EV price does not exceed the price of an equivalent conventional car by N50%. A second observation is that the extended regulatory targets R3 have not only led to shares around 10% greater than their counterparts, as discussed in 4.7, but also seem to be marginally less sensitive to charge point targets as the range between the results is smaller. The 2050 sales share bandwidth between pCP targets for each scenario varies between 16 and 30% for all tests and 15 and 26% between only 10 and 100 PiEV/pCP. We also notice that in all scenarios, there is a very low sensitivity to pCP provision when the target isN25 PiEV/pCP, whereas the most ambitious targets ofb5 PiEV/pCP, could make a large difference. Thefinal observation is that there is no obvious devia-tion between PiEV/pCP ratio scenarios until after the PiEV sales share is between 10 and 20%. For the stock this share is at about 5%. It should be noted that our model does lack the sophistication of a spatial element regarding infrastructure deployment, and as such may be vulnerable to underestimating the impact of public charging post provision, eg regarding“charging highways”. Nonetheless, ourfindings support evidence that early PiEV adopters are more likely to rely on home charging (Tran et al., 2013; Namdeo et al., 2014; Hoen & Koetse, 2014; Plötz et al., 2014; Campbell et al., 2012), and furthermore indicate the need for widespread infrastructural deployment as EV adoption be-comes more mainstream with users who are more reliant on public charging infrastructure.
[image:10.595.36.283.53.210.2]Thefinal step of this part of the study was to look at individual countries. We therefore focus on the range of results from the eight dif-ferent PiEV/CP targets for selected countries under high infrastructure subsidies, current purchase subsides and projected regulatory targets (R2P1I3). We have not replicated the policies that exist in each country in reality, but still apply an EU wide policy. Future research will focus on this. We chose four countries to consider, representing different levels of GDP and vehicle stock growth, as shown inTable 4.
Fig. 5.2050 Percentage change in PiEV share and CP installation under R1P1I3 conditions with varying PiEV/CP targets.
[image:10.595.43.546.573.716.2]Demonstrated in the results (Fig. 7), it was found that the generali-sation derived about the EU in the previous section, that deviation oc-curs around 5% of stock share, i.e. charge point provision takes affect after that point, did not appear to hold entirely true and appears to be slightly dependent on country characteristics. Our model results indi-cate that those countries with greater levels of GDP/capita have more rapid EV deployment (DE and IE), and appear to require a similar EV stock share than the EU28 level for infrastructure provision to take ef-fect. For the countries with lower GDP/capita EV uptake starts later and would appear to be impacted at lower stock share than 5%, but are less sensitive overall as they have a lower range between PiEV/pCP targets. It is not surprising that a higher GDP/capita leads to more rapid or earlier EV deployment, given that EV's have a higher purchase price than conventional counterparts when theyfirst appear on the market. Users in countries with lower GDP/capita may simple be priced out of the EV market. It further makes sense that DE and IE would have more similar behaviour to EU as their average GDP/capita is closer (though slightly higher) to EU average than PL or BG (which are both much lower). The countries with higher overall achieved EV shares are more sensitive to charge point provision, demonstrated by the wider bandwidth between the PiEV/pCP target scenarios, than their counterparts, confirming what was said above for the EU also on a country level. The countries with lower vehicle stock (IE, BG) also had wider bandwidth than their counterparts. The lower sensitivity to CP provision of countries with larger stock and smaller EV share witnessed in PL and BG would suggest that these countries may have benefited from the more rapid deployment of infrastructure in other countries that has reduced infrastructure costs. Thus the provider will expect higher return on investments and install more infrastructure before the government subsidies are needed (bearing in mind that in this study, due to structural limitations of the model, infrastructure targets are related to government subsidies). Thefinding that each member state responds differently to the policies gives further credence to tailored policies for member states, as long as they are in line with EU
regulations and do not lead to market fragmentation. Furthermore, it highlights the importance of the interaction between member states, and how poorer states may benefit from the activities of those who can bear the higher early stage costs. This can give insight for the MSs when designing their national policy frameworks for the implementation of the Directive on the deployment of alternative fuels infrastructure.
6. Conclusion and outlook
This research has sought to bring about further understanding for policymakers regarding the interaction between e-mobility and related infrastructure. The model results of the tested scenarios have determined the following key policy insights:
Purchase subsidies:
• Even very high purchase subsidies alone did not lead to long-term EV market success.
• Subsidies benefit available EV technologies in the short term, even in the absence of other policies.
• Longer duration of subsidies did not make significant impact. They can provide market impetus in the beginning but market growth beyond initial deployment needs to be sustained by market mechanisms other than subsidies.
• Due to technology competition dynamics, offering EV purchase subsidies before all technologies are available could lead to technology lock-in and inhibit long-term maturity of less developed technologies.
Fleet Emission regulations:
• Having long term emission target regulations in place is necessary for technology transition.
[image:11.595.45.558.86.137.2]• Competition for R&D funds between alternative powertrains seems favourable for FCV when long term targets are in place, provided
[image:11.595.135.472.527.723.2]Fig. 7.Influence of CP provision (desired ratio of EV to CP) on EV stock share in various member states.
Table 4
2010 GDP and vehicle stock and 2010–50 growth for representative countries.
GDP: HN30 k, Lb10 k; GDP growth: HN100%, Lb50%; Stock: HN10 M, Lb3 M; Stock growth: HN80%, Lb40%.
Country 2010 GDP/capita 2010–50 GDP/capita growth 2010 vehicle stock 2010–50 vehicle stock growth
Germany (DE) High Medium High Low
Ireland (IE) High Medium Low Medium
Poland (PL) Low High High High
that hydrogen is produced via low carbon pathways.
• The most ambitious long term targets benefit PHEV and BEV when subsidies are also in place.
• Higher regulatory emission targets appear to reduce sensitivity to charge point provision.
Infrastructure provision:
• Success of infrastructure subsidies is strongly tied in with success of other policies and existing competition dynamics.
• Charge point provision appears to impact PiEV uptake when PiEV stock share is over 5% in the EU but would appear to be dependent on total stock volume and GDP.
• EV take-up is relatively insensitive at target levels below 5 or over 25 PiEV/pCP.
We can conclude that without stringentfleet emission regulation targets in place for automobile manufacturers a significant transition to-wards e-mobility, as a potential enabler to meet wider transport and emission reduction targets, is unlikely to take place, regardless of sup-portive policies aimed at users. Furthermore, it would appear that FCV could have negligible deployment in the absence of strong regulation. There are significant interactions between EV options, especially when vehicle subsidies are in place. Whereas vehicle subsidies are favourable towards PiEVs, this can lead to very low shares of FCVs, which can be tipped back into success by H2fuelling infrastructure subsidies and fleet CO2emission penalties. Thesefindings would suggest that subsi-dies are only beneficial in the earlier years of market introduction and should cover all technologies. Nonetheless, our results would also give some support that White Paper targets may be met.
Ourfindings indicate that some form of minimum infrastructural targets could be beneficial though further research is needed to identify the exact saturation levels, and it is beyond the scope of this model to comment on the impact of spatial deployment. There is a correlation be-tween EV uptake and infrastructure subsidies, but in our modelled sce-narios it appears to be weaker than vehicle purchase subsidies or manufacturerfleet CO2targets. Our study results support the hypothesis that early EV adopters are less reliant on the provision of public charging infrastructure. Greater infrastructure provision is necessary to increase the convenience of PiEVs and thus their overall utility as perceived by the user, but for the user to realistically consider purchasing a PiEV in thefirst place, more exposure to the new powertrains is required in early years to build awareness and enter the users' decision set.
Tipping points for regulatory targets should be considered more in depth, based on the initial observations presented here, in preparation for future policy discussion and implementation. This could include a consideration of upstream emissions. Finally, this study has not directly
considered vehicle size/segments, which could offer further insight for discussions. The work presented in this paper relies on a complex model. As described inSection 3, the model is extensive and detailed, but remains a simplified representation of the decision processes of mar-ket players. The purpose of the model is to capture system interactions and feedbacks as concisely as possible and focus on impacts that system changes can make on overall outcomes, with a view of understanding the key relationships and tipping points within the system being studied. The attraction of this is that recommendations for policy design can be made on the basis of computer simulations avoiding costly policy exper-imentation. Many assumptions have been made to ensure that the model is as simple as possible, yet representative enough to consider important feedback loops. Naturally, this introduces uncertainties into the confi -dence in the model results, as does any uncertainty over the decisions within the scenario design. However, the strength in system dynamics modelling lies not in a prediction or forecasting capacity, but in the un-derstanding of behaviours of variables, and the comparison of scenarios. It is important that any party drawing from the results of this study is fully informed of this limitation. Therefore, the impact of uncertainties of model assumptions are somewhat mitigated as they are consistent across all scenarios, and model calibration and optimisation routines have suggested that data deviation should have minimal impact on haviour. Uncertainties in scenario assumptions are less troublesome, be-cause as time goes on, even if they turn out to be not as realistic as assumed, they are still valid scenarios at this point in time, spreading be-tween minimum and maximum possibilities. Furthermore, the model is adaptable enough to be improved over time with continued learning, and availability of new data and information. Future iterations may also include other under-researched system elements such as differing busi-ness models employed by the manufacturer or modal shifts adopted by the consumer. Going forward, much more detailed analysis, focusing on sensitivities and tipping points, will be carried out over a greater range of scenarios to reflect on further policy options, not just regarding charg-ing infrastructure but also wider energy and transport policy goals. Such analysis can be further enriched by linking with other models such as detailed emission, GIS, power dispatch or energy system models.
Acknowledgements
[image:12.595.32.552.623.738.2]The model used in this research was initially developed by one of the authors and Guzay Pasaoglu (JRC) with Lee Jones, Andrew Hill, and Alexandre Beaudet (all Ventana UK). Additional feedback on the manuscript and previous versions was provided by Panagiota Dilara (European Commission, DG GROW) and anonymous reviewers. The views expressed are purely those of the authors and may not in any circumstances be regarded as stating an official position of the European Commission.
Table 5
Sources for key variables under baseline conditions for indvidual member states unless marked EU (as used in (Harrison et al., 2016)).
Variable Historic trend Future projection
Population (Eurostat, 2014a) EU Reference Scenario (EC, 2013b) Average household size EC, (2013b)
GDP per capita (Eurostat, 2014b) Calculation based on
EU Reference Scenario (EC, 2013b) Demographic breakdown World Urbanisation Prospects (UN, 2013)
Average annual KM TRACCS (EMISIA, 2013) and trend extrapolation Road network length (Eurostat, 2014c;CIA, 2014) and expert assumption Growth in oil price Extrapolation from EU Reference Scenario (EC, 2013b) Growth in alternative fuel price Expert assumptions based on growth in oil price
Electric fuel cost (Eurostat, 2014d) EU Reference Scenario (EC, 2013b) ICEV fuel cost (Tremove, 2010;BCN, 2014) and expert assumptions