Has performance pay increased wage inequality in Britain?
Mark Bryan
a, Alex Bryson
b,⁎
aUniversity of Sheffield,UK b
University College London, UK
H I G H L I G H T S
•Performance pay (PP) incidence in Britain was broadlyflat from 1998-2008. •The wage return to PP was substantial and appears to have increased over time. •PP led to a modest rise in upper-half earnings dispersion, mainly via bonuses. •Simulations of PP expansion predict only small increases in wage dispersion.
a b s t r a c t
a r t i c l e i n f o
Article history: Received 31 July 2015
Received in revised form 30 April 2016 Accepted 1 May 2016
Available online 3 May 2016
Using data from the British Household Panel Survey (BHPS) we show performance pay (PP) increased earnings dispersion among men and women, and to a lesser extent among full-time working women, in the decade of eco-nomic growth which ended with the recession of 2008. PP was also associated with some compression in the lower half of the wage distribution for women. The effects were predominantly associated with a broad measure of PP that included bonuses. However, these effects were modest, typically not exceeding a 0.05 log points change in log wage differentials over the decade. Moreover there is no indication that PP became increasingly prevalent, as some had predicted, over the decade prior to recession.
© 2016 The Authors. Published by Elsevier B.V. This is an open access article under the CC BY license (http://creativecommons.org/licenses/by/4.0/). Keywords:
Wages Wage inequality Performance pay Bonuses
1. Introduction
Income inequality has grown in English-speaking economies in recent decades, largely due to growing wage inequality (see
Atkinson et al., 2011, for international evidence; andBrewer and Wren-Lewis, 2016, who show that over 1978–2008 in the UK, rising earnings inequality counteracted falls in inequality due to other come components). A variety of explanations for rising wage in-equality have been proffered, including increasing returns to skill induced by skills-biased technological change (SBTC) (Autor et al., 2008), changes in labor market institutions, most notably de-unionisation (Dustmann et al., 2009; Card et al., 2004) and increased trade (Autor et al., 2013). In their seminal paper for the United States
Lemieux et al. (2009)(henceforth LMP) show that performance pay (PP) accounted for one-fifth of the growth in wage inequality among men between the late 1970s and early 1990s, and most of the growth
in wage inequality among high earners in the top quintile. They show that PP became more widespread between the 1970s and early 1990s, was closely tied to individuals' productive characteristics, and that the returns to these characteristics were rising faster in PP jobs than infixed wage jobs. Theirfindings are consistent with a world in which SBTC increases the rewards for more productive workers and induces firms to resort to PP to both attract and incentivise those workers.
LMPs (2009) model, which draws on the work ofLazear (1986, 2000) and Prendergast (1999), indicates PP generates higher wage dispersion thanfixed rate pay (FP) due to the sorting of high ability workers into PP jobs–a labor market segmentation type argument–and because PP reflects individuals' marginal product more accurately thanfixed wage schedules. Growth in PP jobs allows high ability workers to recoup returns to their ability in a way that is not possible withfixed wages, while the higher in-cidence of PP at the top end of the earnings distribution will also generate higher wage dispersion.
LMP attribute the increased use of PP to SBTC and the declining costs of worker monitoring due to advances in technology. These trends are
⁎ Corresponding author.
E-mail address:[email protected](A. Bryson).
http://dx.doi.org/10.1016/j.labeco.2016.05.002
0927-5371/© 2016 The Authors. Published by Elsevier B.V. This is an open access article under the CC BY license (http://creativecommons.org/licenses/by/4.0/).
Contents lists available atScienceDirect
Labour Economics
likely to have continued in the period since the mid-1990s which LMP were studying, both in the United States and in other industrialised countries. For instance,Sommerfeld (2013)documents an almost con-tinuous rise in the share of PP jobs between 1984 and 2009.
And yet LMP'sfindings have recently been challenged in a series of pa-pers using data for the United States. Using establishment data from the Bureau of Labor Statistics' Employer Costs for Employee Compensation (ECEC) series (which derives from the National Compensation Survey)
Gittleman and Pierce (2013)show the proportion of jobs with PP rose in the 1990s, only to fall in the 2000s such that, by 2013, it haddeclined
by about one-fifth since LMP's study period, irrespective of how one mea-sures PP. This decline is apparent throughout the wage distribution but is concentrated among low earners. Furthermore, in a second paper,
Gittleman and Pierce (2015)show that the contribution of PP to growth in the earnings distribution in thefirst decade of the 21st Century has been small—in the order of 9% of the growth in variance. Sommerfeld's analysis for Germany also showed that despite the expansion of PP, it did not lead to increased wage inequality because it was associated with higher wages across the board and not just for high earners.
Two more papersfind LMP's basic results do not hold for some parts of the working population. Like LMP,Heywood and Parent (2012) ana-lyze the Panel Survey of Income Dynamics (PSID). Theyfind that, during the period 1976–1998, the tendency for PP to be associated with greater wage inequality at the top of the male earnings distribution applies to white workers but not to black workers. In a second paper using the Na-tional Longitudinal Survey of Youth (NLSY),Heywood and Parent (2013)find skilled fathers select into PP jobs, whereas skilled mothers select out of PP jobs, afinding which is not consistent with standard as-sumptions regarding workers sorting into PP jobs on ability. This, in turn, raises questions about the effects of PP on wage inequality.
In Britain wage inequality among full-time workers has been rising since the late 1970s, although the rate of change slowed dramatically in the 2000s, with all the growth being confined to the top part of the wage distribution (Machin, 2011; Lindley and Machin, 2013). Over the whole period the graduate wage premium rose, despite growth in the graduate share in employment and hours, suggesting demand for highly skilled labor was exceeding its supply (Lindley and Machin, 2013). This is consistent with SBTC, and the authorsfind direct evidence of greater demand for more educated workers in more technologically advanced industries (Lindley and Machin, 2013: 175–176). They also point to the introduction of the national minimum wage in 1999 and its subse-quent up-rating as a reason for the stability in the 50–10 wage differen-tial in the 2000s.
Although they point to the potential importance of SBTC in the Brit-ish context, Lindley and Machin do not consider the potential role played by PP in growing wage inequality. There is some evidence that annual bonuses have contributed to an increase in wage inequality at the top of the earnings distribution in the last decade or so, primarily as a result of a large bonus receipt by bankers, traders and other well-paid professionals in the Finance sector (Bell and Van Reenen, 2010, 2011, 2013).1These employees may be sharing in the substantial rents generated by a lack of competition in the sector. Alternatively, they may be benefiting from productivity“scaling”effects that accrue to highly productive employees when changes such as increasedfirm size and capital intensification“scale up”worker productivity, increas-ing returns to their employer. This is the type of effect identified by
Gabaix and Landier (2008)andKaplan (2012)in relation to“superstars”
such as CEOs.
But, aside from the effects of bonus payments at the very top, what effects has PP had on the overall wage distribution in Britain? Two
studies using cross-sectional linked employer–employee data come to different conclusions.Manning and Saidi (2010)show that, although there is a wage premium attached to the receipt of PP, it had a negligible effect on wage dispersion in 2004. However, using data from the 2011 Workplace Employment Relations SurveyBryson et al. (2014)find PP results in a sizeable widening in wage differentials relative to a counter-factual wage distribution, and that this effect is larger higher up the earnings distribution. The premium rises markedly as one moves up the hourly wage distribution: it is seven times higher at the 90th per-centile than it is at the 10th perper-centile in the wage distribution (.42 log points compared to .06 log points). This, coupled with the higher in-cidence of PP among those with wage-enhancing attributes, means PP contributes substantially to higher wage dispersion in Britain. However its overall effect on the wage distribution is less marked than it might have been due to the relatively low proportion of employees on PP con-tracts in Britain.
This paper contributes to the literature in a number of ways. First, in light of the debate in the US about the changing role of PP, we track the incidence of PP using the British Household Panel Survey (BHPS) for the period 1998–2008 that immediately preceded the recession. We con-sider alternative broad and narrow definitions of PP and estimate their individual, job and workplace correlates. Next we estimate the premi-um associated with PP jobs and look at how it changed over the decade. Finally we estimate the effects of PP on wage dispersion and changes in the wage distribution over the period, accounting for the changing PP premium as well as changes in the prevalence of PP at different parts of the distribution.
Wefind no indication that PP jobs (broadly or narrowly defined) are becoming increasingly prevalent. Depending on the measure used and splitting by gender, wefind either gradual declines or broad stability, al-though PP jobs may have picked up slightly among full-time women in the two years before the recession. Nonetheless the returns to PP re-main positive, even when controlling for unobserved personal charac-teristics, and in fact seem to have increased over the period. Confirming other recent studies, we show that wage inequality grew somewhat during the decade of economic growth that ended abruptly with the recession, largely due to growing earnings dispersion in the top half of the wage distribution (with some reduction in inequality at the bottom for women). Estimates of PP effects on the counterfactual wage distribution confirm PP increased earnings dispersion among men and women, including the sub-group of full-time working women. PP also appears to have contributed to reduced wage disper-sion at the bottom among women. In both cases, the changes are largest for the broad measure of PP, which includes bonuses. Nevertheless the effects overall are reasonably modest—while overall PP remains a disequalising force on the wage distribution in Britain, the fact that it has not become more widespread has limited its impact on wage inequality.
In the next section we outline the theoretical links between wage dispersion and PP. 3 Three then introduces the data whileSection 4
which presents results relating to the incidence and correlates of PP followed by its links to wages and wage dispersion in Britain. Finally
Section 5discusses the implications of thefindings and draws some conclusions.
2. Wage dispersion and performance pay
In perfectly competitive labor markets in whichfirms and workers have perfect information employees would be paid their marginal prod-uct, that is, they would be paid for their performance. However, employers and employees often preferfixed wage contracts based on time rather than effort or output. Employers mayfindfixed wages less costly to ad-minister, especially if labor inputs or outputs are costly to monitor: it can be costly forfirms to identify the contribution of individual employees to output, while factors beyond the control of the employee, and even the
firm, mean output is affected by factors other than employees' talent and
1
effort. In standard economic theory wage dispersion rises when em-ployees are paid for their performance, compared to a counterfactual sce-nario in which they are paid afixed wage. Underfixed wage schedules employees are paid for time worked, whereas under PP they are paid for output. Heterogeneity in individuals' ability to increase output, either by virtue of talent or effort, is ignored infixed wage schedules, but it does have a bearing on earnings when pay is linked to performance.
There are three channels that may lead to higher earnings dispersion in the presence of PP. Thefirst is a mechanical effect: PP reveals under-lying differences in individuals' productivity that were previously ig-nored. Second, PP may have the effect of incentivising effort: employees can raise (lower) their earnings through higher (lower) ef-fort such that variance in efef-fort induces variance in earnings, whereas employees' earnings are not a function of effort infixed wage jobs. Third, employees will sort into (out of) PP jobs according to talent and other traits (such as their tastes for effort and risk) that may affect their earnings. If more able workers sort into PP jobs where they can command higher earnings, while less able workers prefer the guarantee of afixed wage, the market will segment into high and low earners along PP lines. Thus via all three of these channels, the introduction of PP should lead to greater wage dispersion than might obtain if all workers were paid afixed wage.
Of course this is an over-simplistic picture because job retention and job progression are often performance-related, even when workers are paid afixed wage, because wage levels and earnings progression reflect workers' efforts and talent, while career concerns can incentivise effort (Prendergast, 1999; Papps et al., 2011). But the link between perfor-mance and pay is usually more explicit and more direct in the presence of PP schemes.
While all these considerations suggest that PP will be associated with greater wage dispersion in cross section, the impact of PP on changes in wage dispersion are less clear. LMP (2009): 3–4) discuss some reasons why PP may induce growth in earnings dispersion. If de-mands for more skilled and more able workers are rising due to SBTC or globalisation, this will raise the market value of more talented workers such thatfirms may bid up their price relative to less talented workers as they try to influence the job matching process. This, in turn, may in-duce greater worker sorting between PP and FP jobs, contributing to growth in the dispersion of earnings between PP andfixed pay jobs. If there is an increase in the prevalence of PP, particularly at the top end of the earnings distribution, this will also contribute to a growth in earn-ings dispersion.
3. Data
We analyze data from the British Household Panel Survey (BHPS), which began in 1991 with a sample of some 5000 households from En-gland, Scotland and Wales. Household members aged 16 or over were interviewed annually (usually in September or October) through to thefinal year 2008. In addition there are new entrants to the survey (e.g. children reaching age 16 and new partners of original sample members) in accordance with the BHPS‘following rules’; together with the survey weights, these are designed to ensure that the sample stays broadly representative of the British population structure.2
The analyses focus on employees aged 18–64 years who provide valid observations for all included variables, and in addition we exclude those reporting total weekly hours of 100 or more or 5 or less. This re-striction, which affects fewer than 2% of observations, reduces possible measurement error in hourly wages arising from extreme reports of hours worked. It also eliminates very small jobs. To account for the
possibility of different wage determination processes across gender, we perform separate analyses for men and women. We also analyze a sample of women in full-time jobs only to make sure that any gender differences do not reflect the much larger proportion of women (than men) in part-time jobs (where PP is less common).
Because of the new entrants, some attrition out of the survey, and the many labor market transitions that take place over the lifecycle (due to childcare, unemployment, sickness and retirement), the panel of employees that we analyze is not balanced. Indeed we would not wish to restrict the analysis in this way, because the sam-ple would constitute a highly selected group of peosam-ple with a dispro-portionately strong attachment to the labor market.3Instead, we use
all available observations to get as close as possible to a representa-tive sample of employees in each wave (and we apply the survey weights to correct for non-response).4 The sample composition
does change over time, but this is broadly consistent with known trends in the UK economy.5Our decomposition analysis allows for
this by using period-specific coefficients to correct for observable differences between PP and FP workers.
The analysis covers 1998 (wave 8) to 2008 (wave 18) and the full sample over this time window comprises 3918 men and 4221 women, both observed on average for 5.6 waves. In our analysis comparing sub-periods at the start (1998–2000) and end (2006–
2008) of the time window, we work with smaller samples (2791 men and 1965 women in 1998–2000; 2235 men and 2476 women in 2006–2008).
All our descriptive estimates of PP prevalence and trends are weighted using the cross-sectional weights provided with the sur-vey, which account for survey design and the likelihood that a re-spondent appears in a particular wave. In our main counterfactual analysis, these weights are also incorporated into the weights that we derive to simulate what the wage distribution would look like without PP jobs (thefinal weight is the product of the survey weight and counterfactual weight).6
As is standard in the literature7our wages measure is hourly
wages, which we compute as (usual gross pay / (usual basic hours + 1.5 × usual paid overtime hours). The usual gross pay
2Given the rules for new entrants to the survey, it will not reflect the impact of immi-gration in the mid-2000s. In addition, we do not include the Scotland, Wales and Northern Ireland extension samples added in 1999 and 2001, as this would introduce a discontinu-ity in the data.
3We investigated whether attrition between the start and end periods was related to PP by estimating a probit equation for whether individuals present in 1998–2000 were still present in 2006–2008, as a function of observable characteristics (those included in the main analysis) and dummy variables for broad and narrow PP receipt (see below for definitions). The PP coefficients were individually and jointly insignificant (joint p-value = 0.64), suggesting that there is no differential attrition based on PP status.
4We essentially follow the approach in the inequality literature which uses repeated cross-sections to document trends over time (over long periods the individuals at the end are necessarily different to those at the beginning). As discussed below, the additional advantage of panel data is that we can includefixed effects when estimating the PP premi-um and, importantly, we can measure PP jobs rather than just PP receipt at a point in time.
5
There is a trend towards higher qualifications, some occupational upgrading, and a substantial fall in manufacturing. The sample also ages by about one year over 1998-2008. 6In addition, as discussed below, the survey weights are multiplied by an“endpoint” adjustment weight that accounts for the lower number of within-job observations near the ends of the panel.
7
[image:3.595.310.562.77.159.2]See, for example,Stewart and Swaffield (1997). Table 1
Bonus and PRP receipt, 1998–2008 (row and column percentages).
PRP
No Yes Total
Bonus
No 90.8 9.2 100.0
73.2 41.2 68.3
Yes 71.7 28.3 100.0
26.8 58.8 31.7
Total 84.8 15.3 100.0
variable includes regular bonuses, commission and tips, so the hour-ly wage measure will take account of these components of PP. We can also construct a second hourly pay measure including more ir-regular bonuses (such as seasonal bonuses), derived from a separate question in the survey. While in principle this second measure better reflects total bonus payments received, it carries a risk of double counting if respondents report some bonus payments in answer to both questions (the second question does not explicitly exclude all regular bonuses). As a result we use thefirst wage measure as our baseline dependent variable, but as a robustness check we also run all analyses with the wage measure including irregular bonuses (the results are almost identical).
BHPS contains two measures of PP. Thefirst, relating to bonuses, is derived from the question:“In the last 12 months have you received any bonuses such as a Christmas or quarterly bonus, profit-related pay or profit-sharing bonus, or an occasional commission?”. The second measure relates specifically to performance-related pay (PRP). Respon-dents are asked:“Does your pay include performance related pay?”The bonus question was asked in Waves 6–18 and the PRP question in Waves 8–18. As we wish to combine information from the two mea-sures we focus on Waves 8–18 covering the period 1998–2008.8
Gittleman and Pierce (2013) emphasise the importance of
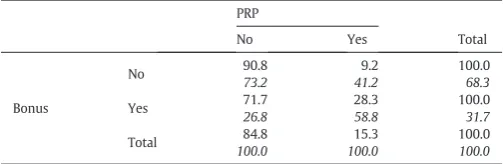
recognising that PP measures often capture different types of PP, some more closely related to individual productivity than others. In our data, the PRP question arguably captures pay linked to individual per-formance, while the bonus question captures payments like Christmas bonuses and rewards, such as profit related pay, that are probably linked to team orfirm performance. Across the pooled sample PRP is roughly half as prevalent as bonus receipt (15% compared to 32%, see
Table 1).
While the two measures are positively correlated, over 70% of those receiving bonuses do not get PRP and 41% of those receiving PRP do not get bonuses (Table 1). So to some extent PRP and bonus receipt are dis-tinct types of compensation. As we show later it is also the case that em-ployees in PRP and bonus jobs differ somewhat in their characteristics.
Gittleman and Pierce (2013)present two PP measures: a broad mea-sure including incentive pay andallbonuses; and a narrow PP measure restricted to incentive pay andperformance-basedbonuses only. We fol-low their approach. Our broad measure of PP combines the PRP and bonus questions (receipt of PRP, bonus, or both), while our narrow mea-sure is confined to the PRP measure (receipt of PRP, with or without bonus).Table 2shows that 62% of employees did not get either PRP or bonus, thus the prevalence of PP broadly measured is 38%, whereas 15% receive PP narrowly defined.
Tables 1 and 2above relate to thereceiptof PP. However, throughout the analysis presented in Section 4 we follow other papers in the litera-ture by focusing on PPjobs, not receipt. A job is a period of employment with the same employer in the same“grade”, i.e. if a worker gets promot-ed it is a new job. A job is classified as a PP job where the respondent has been in receipt of PP on at least one occasion. This adjustment is made in
recognition of that fact that some jobs are PP jobs but that, for whatever reason (poor performance on the part of thefirm or individual, for in-stance) there has been no receipt of PP in a particular year - that is to say, the respondent may be in a job that pays for performance but, in a given year, the PP due is £0, thus making it hard to distinguish from a
fixed pay job.9
Since the probability of a PP job paying out for performance is partly a function of the number of times that job is observed in the data (which is lower for jobs near the ends of the data window) it is necessary to make an“endpoint adjustment”which accounts for the presence of jobs of different durations. Following LMP's approach we construct an adjusted measure of the prevalence of PP jobs by estimating probit models for the probability of appearing in each wave of the data based on the number of times a job is observed. The resulting predicted prob-abilities are used to construct a weight which then effectively holds the distribution of the number of times a job is observed to that observed in the middle of our sample.
4. Results
4.1. The prevalence of PP and its correlates
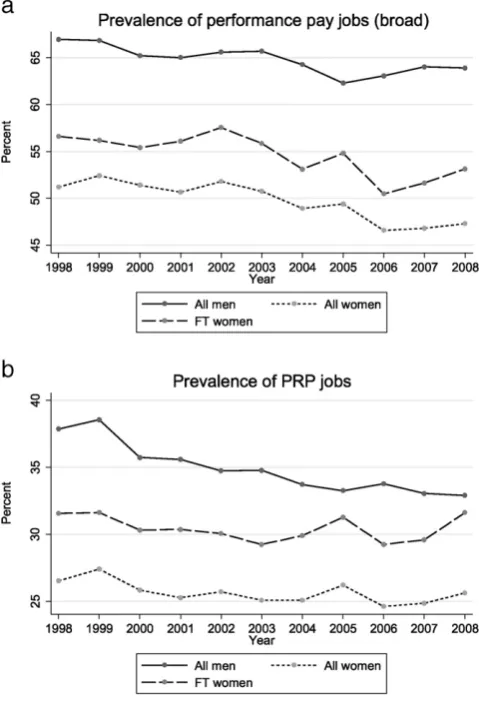
Fig. 1a shows the incidence of PP jobs using the broad measure (PRP plus bonuses). It is apparent that men are more likely to be in PP jobs than women and that, among women, PP jobs are more common in
[image:4.595.307.547.54.405.2]8 A different question about bonuses was asked in Waves 1–5:“Does your pay ever in-clude incentive bonuses or profit related pay?”It includes fewer bonus components than the later question and about 10% fewer people reported bonuses each year by this mea-sure. As we wish to use consistent measures for each year, and also combine the bonus and PRP measures for some of the analysis, we do not use the earlier bonus question. Table 2
Overlap of bonus and PRP receipt, 1998–2008 (cell percentages).
PRP
No Yes Total
Bonus
No 62.0 6.3 68.3
Yes 22.7 9.0 31.7
Total 84.8 15.3 100.0
9
All results presented later are robust to classifying a“job”as the total spell with a par-ticular employer. These results are available from the authors on request.
full-time jobs. Throughout the period a little under two-thirds of jobs undertaken by men were PP jobs. Among women, thefigure is closer to one-half. The incidence of PP jobs declines a little over the decade be-fore the recession began, the drop being particularly notable among full-time women. There is no evidence at all that PP jobs became more com-mon except perhaps a small rebound acom-mong women towards the end of the period.
Fig. 1b presents the same information but this time for the narrow measure of PP which is based solely on the performance-related pay question referred to in Section Three. The male–female gap is smaller on this narrow measure, and it narrows over the period since 1998 be-cause the percentage of jobs undertaken by men that are PP jobs has been falling. The percentage of PP jobs among women was broadly sta-ble, though as for the broad measure, there is some indication that it
[image:5.595.309.561.76.233.2]may have increased slightly after 2006. Overall, though, we see no clear evidence that PP jobs expanded over this period.
Table 3shows a bivariate probit estimated for the pooled sample which establishes the correlates of bonus-paying jobs and PRP jobs, hav-ing accounted for the positive and statistically significant correlation in unobservables between the two. There are a number of points worth noting. First, consistent with the graphical evidence, the incidence of both bonus jobs and PRP jobs has declined significantly since the turn of the century having conditioned on employees' demographic, job and workplace characteristics. For PRP jobs there was an abrupt decline in 2000 followed by further decline after 2006. Bonus jobs also fell sharply in 2000 but then declined more steadily. Second, those in re-ceipt of both types of PP have higher gross hourly earnings than those infixed pay jobs: even after accounting for occupation, tenure, and other characteristics that influence wages (such asfirm size) those in PP jobs have gross hourly wages that are around one-third higher than those among observationally equivalentfixed pay employees.
Third, the male–female differential in PP jobs, apparent in thefigures above, is not significant having accounted for other factors. PP jobs are more likely to be full-time, permanent, and in managerial, clerical and sales occupations. PRP jobs are more likely to be unionised thanfixed wage jobs, but this is not the case for bonus jobs. The quadratic in years of job tenure turns at about 36 years for bonus jobs and 24 years for PRP jobs, both of which are above the 90th percentile of the job tenure distribution, so the probability of bonuses increases in tenure for most employees. Unsurprisingly both types of PP job are more likely in larger organisations and the industry patterns are as found in the literature.
4.2. Is there a performance pay premium?
Before looking at the growth in wage dispersion in Britain and the role PP may have played we run log hourly wage regressions to establish whether there is a PP premium at the mean and, if so, how much of it can be explained by the selection of workers into jobs. Appendix
Table A.1reports raw wage gaps as well as regression-adjusted gaps es-timated by OLS andfixed-effects respectively for the full period 1998–
[image:5.595.45.291.81.522.2]2008. For both men and women, and whether looking at broad or nar-row PP, there is a sizeable raw wage differential (up to around 20%) which falls when regression adjusted by OLS (typically by about half)
Table 4
The PP Wage Premium, 1998–2000 and 2006–08 compared.
1998–2000 2006–2008
OLS FE OLS FE
Broad PP
Men 0.077** 0.049** 0.129** 0.060** (0.010) (0.014) (0.012) (0.021)
Women 0.077** 0.050** 0.090** 0.055** (0.010) (0.017) (0.011) (0.022)
Women (FT) 0.070** 0.042** 0.101** 0.022 (0.012) (0.017) (0.014) (0.024)
Narrow PP
Men 0.071** 0.039** 0.098** 0.056** (0.010) (0.015) (0.012) (0.024)
Women 0.070** 0.065** 0.098** 0.070** (0.011) (0.020) (0.012) (0.027)
Women (FT) 0.067** 0.040** 0.104** 0.029 (0.012) (0.018) (0.014) (0.027)
Number of persons (person-observations) in 1998–2000 is 2791 (6598) [men]; 2920 (6867) [women]; 1965 (4323) [FT women]. Number of observations in 2006–08 is 2235 (5416) [men]; 2476 (5972) [women]; 1624 (3611) [FT women]. Dependent variable is the log hourly wage. Regression-adjusted estimates also control for quadratics in age and job tenure, and dummies for marital status, part-time work, temporary andfixed terms jobs, trade union coverage, public sector status, occupation (9 categories), industry (11 categories), establishment size (3 categories), region (13 categories), and wave. Stan-dard errors in parentheses. *significant at 10%; **significant at 5%.
Table 3
Correlates of bonus and PRP jobs, 1998–2008 (bivariate probit).
Bonus
job PRP job
Wald test of equal effects
Female −0.032 0.023
Age/10 0.225** 0.118
(Age/10)2 −0.031** −0.025*
Married −0.021 0.010
Log (gross hourly wage) 0.313** 0.357** Part-time (≤30 h total) −0.147** −0.268** ** Seasonal or temporary job −0.776** −0.529** ** Fixed term job −0.622** −0.596** Job tenure 0.110** 0.062** ** Job tenure squared −0.003** −0.002** ** TU or staff assoc. at workplace 0.021 0.241** ** Public sector −0.498** −0.049 **
Manager 0.146** 0.156**
Professional −0.064 0.149* ** Technician −0.031 0.026
Clerical 0.109 0.074
Craft −0.052 0.047
Personal −0.199** −0.141
Sales 0.281** 0.431**
Operative −0.102 −0.056
Routine
Agriculture −0.399** −0.321* Mining & utilities −0.028 0.344** * Construction −0.217** −0.199** Retail and hotels −0.032 −0.065 Communications 0.158** 0.038 Finance and property −0.012 0.158** ** Other industries −0.277** −0.088 ** Social work & health −0.857** −0.751** Education −0.908** −0.261** ** Public administration −0.700** −0.126 ** Manufacturing
Establishment 500+ employees 0.151** 0.195** Establishment 50–499 employees 0.073** 0.100** Establishment 1–49 employees
1999 −0.072** 0.019 **
2000 −0.155** −0.068** **
2001 −0.149** −0.074** **
2002 −0.164** −0.091** **
2003 −0.176** −0.089** **
2004 −0.222** −0.110** **
2005 −0.261** −0.100** **
2006 −0.305** −0.135** **
2007 −0.341** −0.175** **
2008 −0.364** −0.195** **
Constant −0.782** −1.568** ** Correlation of equation errors 0.484**
Log pseudolikelihood −45,733.0 Persons (person-observations) 8139 (45,658)
and falls still further with the introduction of personfixed effects. The fact that the premium falls markedly when adjusting for personfixed ef-fects is a clear indication that there is positive selection into PP jobs.
To see in more detail how the PP premium changed over time,
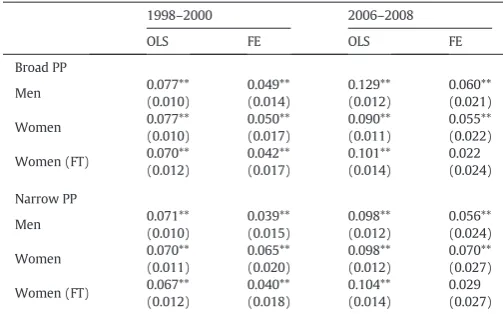
Table 4reports estimates of the adjusted premia from the start and end of the time period, pooling observations from 1998 to 2000 and from 2006 to 08 respectively. The OLS estimates increased for all three subgroups on both PP measures, from around 7–8% to about 10%.10
The FE estimates also increased, albeit by smaller amounts and not for women working full time (for them the PP premium, on both measures, fell from 4% in 1998–2000 to an insignificant 2–3% in 2006–08). But overall there appears to be evidence of an increase in the returns to PP over the period. Whether this increase also leads to rising wage inequal-ity will depend on where PP workers are in the wage distribution and also on how the decline in the prevalence of PP played out across the dis-tribution. In the next section we turn to the net effect of all these factors.
4.3. Does performance pay affect wage dispersion?
In this section we look at changes in log hourly wage dispersion be-tween 1998 and 2008 in BHPS for men, women, and full-time women. First we graph dispersion in both tails of the wage distribution relative to the median. To check whether the BHPS results are consistent with other sources, we compare them to those elsewhere in the literature which tend to rely on the Annual Survey of Hours and Earnings (ASHE) and its predecessor the New Earnings Survey (NES), in particu-lar Lindley and Machin (2013). To ensure we have sufficient sample sizes we use two-year moving averages.11Then we present descriptive
information on the mean and standard deviation in log hourly earnings for PP jobs and those in FP jobs. Finally, we compare the actual wage dis-tribution with a counterfactual wage disdis-tribution to recover the effect of PP on wages in different parts of the wage distribution. We will explain the methodology behind this below.
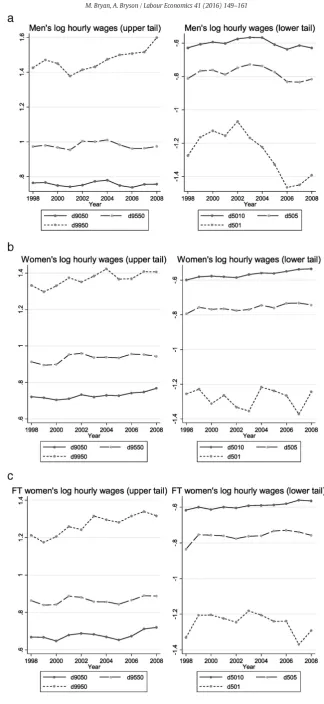
Fig. 2a–c show the log hourly wage distributions for men, women and full-time women respectively over the period 1998–2008. For men wefind increasing dispersion at the very top of the distribution (the 99–50 differential), but little change further down (the 95–50 and 90–50 differentials).12At the bottom we see no real change except in the 50–1 differential which fell until 2001–2 then increased sharply. In their analysis Lindley and Machin (2013)find that the 90–50 differential increased over the period while the 50–10 differential reduced slightly (they do not consider the extreme tails). For women, wefind increasing dispersion at the top and reducing dispersion at the bottom over 1998–
2008, which is similar to the trends reported by Lindley and Machin in the 90–50 and 50–10 differentials.
We therefore see some evidence of a growth in wage dispersion over the period, as do ^ L$_amp_$amp;MLindley and Machin (2013) though for men there are some differences as to where precisely in the distribu-tion this widening occurred. These differences could relate to sample differences, such as the incomplete ASHE coverage of low paid workers or the lack of coverage of new immigrants in BHPS, or the fact that very high and very low earners are more difficult to reach with household surveys (Bollinger et al., 2014).13
How is PP related to wage dispersion over the period?Table 5shows the mean and variance of log hourly wages in the PP and FP sectors for the pooled years. It is apparent that mean wages are higher in the PP
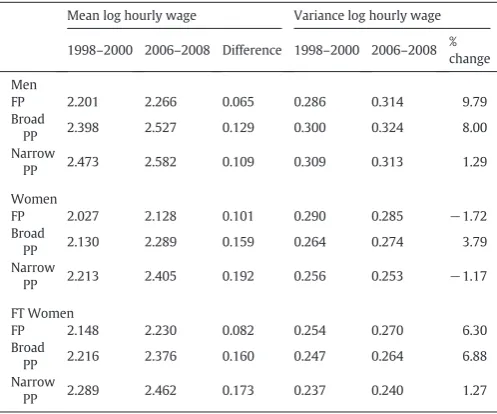
sector, in keeping with the wage premium analysis above. The evidence on variance is mixed: it is very slightly higher for men in PP jobs than in FP jobs, but the variance for women is slightly lower in PP than FP jobs (especially by the narrow measure). In spite of thisfinding, PP has the potential to affect the earnings distribution owing to the fact that em-ployees receive a PP wage premium and, as also seen inTable 3, tend to lie higher in the earnings distribution even conditioning on other job characteristics. This conjecture is given further credence by looking at changes in mean log hourly wages and the variance in log hourly wages for FP and PP employees between 1998–2000 and 2006–2008. It is apparent that mean log hourly wages grew more quickly for PP em-ployees than for FP emem-ployees for men, women and full-time women, and whether one uses the narrow or broad measure of PP (Appendix
Table A.2). However, the percentage change in the variance in log hour-ly wages was no greater in PP jobs than it was in FP jobs. The implication is that any growth in wage dispersion that is attributable to PP is due to a growing gap in mean wages between the two sectors, as opposed to greater growth in within-sector wage variance.
Our estimates of the relationship between PP and the wage distribu-tion are based on a reweighting estimator originally deployed by
DiNardo et al. (1996)and then applied in a modified form by LMP (2009). The method constructs a counterfactual wage distribution which proxies the wage distribution that would obtain in the absence of PP in the economy. This is achieved by reweighting those sample members who are not in receipt of PP such that their observable charac-teristics closely resemble the overall population of workers.
We run the following probit equation for the probability of being in a PP job:
yi ¼xiβþεi
yi¼1yiN0
whereyiis equal to one if individualiis in a PP job and zero otherwise,
1[.] is the indicator function, andεiis distributed as standard normal.
The vector of explanatory variables xicontains quadratics in age and
job tenure, and dummy variables for marital status, part-time work, tem-porary andfixed jobs, trade union coverage, public sector affiliation, ed-ucational qualifications, one-digit occupation and industry, establishment size, region and year. The coefficient estimatesbare used to construct weights defined aswi=vi/ (1−pi), wherepi= Φ(xib) is the predicted probability of being in a PP job, andviis the
cross-sectional survey weight.14
The weights are then applied to the distribution of FP pay to give ad-ditional weight to those with high estimated probabilities of being in a PP job (because these employees are underrepresented in the FP sam-ple). One can then recover the“effect”of PP at different parts of the wage distribution by comparing the actual distribution of wages among all workers to the counterfactual distribution observed among the reweighted set of employees not in PP jobs.
Table 6summarises the results of the counterfactual reweighting ex-ercise for men. We consider two points in time, namely early in the peri-od we study (1998–2000) and then again at the end of the period (2006– 2008).15For each time point, we report various summary measures of
the actual wage distribution (columns 1 and 4) and the change in the dis-persion between the two time points (column 7). The summary mea-sures in column 7 all increased between 1998–2000 and 2006–08 (with the exception of a very small fall in the 90–50 percentile gap), al-though the increases are generally quite small (consistent with the graphical analysis of the actual wage dispersion inFig. 2a), the largest
10
It is notable that the regression-adjusted premium of around 10% is similar to the es-timateBryson et al. (2014)obtain having accounted for workplacefixed effects using the 2011 Workplace Employment Relations Survey.
11
This means that, on average, we have around 35–40 unweighted observations in the 1% tails (25 observations for full-time women).
12Similarly there is no evidence of increasing dispersion towards the middle of the dis-tribution (not reported).
13
A comparison with published ASHE earningsfigures for 2008 indicates that the 90th percentile of weekly gross earnings is about 10% lower in BHPS than in ASHE.
14 The probit for PP jobs used to derive wiis also weighted by the endpoint adjustment weight multiplied by the cross-sectional survey weight.
15
being a 0.098 log point increase in the 10–1 percentile gap (column 7).16
In columns 2 and 5 we present the same measures of the respective counterfactual distributions. The differences between the two sets of es-timates give the PP job effect at each time point (columns 3 and 6). Col-umn 8 shows how the PP effect changed over the period. Finally, we calculate the percentage of the change in each measure of wage disper-sion that can be attributed to PP jobs (column 9): this is simply the ratio of the change in the PP effect to the change in the actual wage disper-sion. The table includes results for both the broad PP measure (top panel) and the narrow measure (bottom panel).17
PP jobs, broadly defined, account for two-thirds (68.3%) of the growth in the variance of log hourly wages for men over the period (row 1). The widening effect of broad PP is apparent throughout the wage distribution, but it is more pronounced in the upper half of the dis-tribution, as is apparent if one compares the magnitude of the numbers in column 8. The 99–90 gap grew the most (0.056 log points): this is wholly accounted for by PP. Indeed, the 99–90 gap would have closed by 0.057 log points in the absence of broad PP. Similarly the growth of 0.025 log points in 95–50 gap is more than explained by broad PP. In contrast, broad PP actually closed the 10–1 gap between 1998–2000 and 2006–08 by 0.006 log points.18
The picture looks very different in relation to narrow PP in the bottom panel of the table. Although narrow PP is associated with higher wage dispersion in both periods, the size of this disequalising effect fell a little over the period. The only part of the distribution where the disequalising effect grew was near the bottom, and this effect is quantitatively small (widening the 50–5 gap and 10–1 gaps by about 0.01 log points).
These divergent results for broad and narrow PP highlight the value in distinguishing between various types of PP when evaluating its im-pact on wages and wage dispersion. The results here confirm the impor-tance of bonus payments in particular in understanding PP effects on growing wage dispersion among men at the top of the wage distribu-tion. One possible reason why bonuses are important in affecting wage dispersion is that bonuses are particularly prevalent at the top of the wage distribution and, as other research using the BHPS has shown, among men bonuses tend to substitute forfixed pay at the bot-tom of the wage distribution but this substitution effect is not apparent at the top of the distribution (Green and Heywood, 2012).19
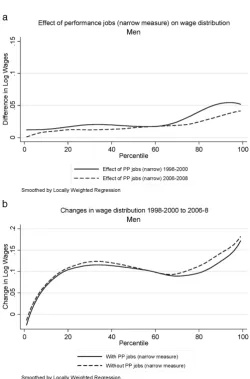
WhileTable 6presents estimates of the size of PP effects on wage dis-persion among men at specific points of the wage distribution, we can also illustrate the distributional effects using graphs.Fig. 3a and b present the effects of broad PP over the wage distribution for men. The solid line inFig. 3a represents the difference broad PP made to log hourly wage dis-persion in the period 1998–2000 by comparing the actual log hourly wages of all male employees - who are a mixture of PP and FP workers - with counterfactual wages based on a scenario in which nobody re-ceives PP (the corresponding summary measures are in the top panel ofTable 6in column 3). The counterfactual gap is fairlyflat in the bottom half of the wage distribution, but then it begins to rise such that the log wage differential is around .15 log points towards the top of the wage distribution.
The dotted line presents the same information but for the period 2006–2008 (corresponding to column 6 in the top panel ofTable 6). The effect of PP is more pronounced in the later period, rising much more steeply in the top half of the wage distribution. Consistent with the summary measures reported above, the graphs indicate that PP has a disequalising effect on wages which increased in the later period.
Fig. 3b shows the role played by broad PP in thechangein the male wage distribution between the early and late periods. The sold line shows how the male wage distribution actually changed (corresponding to column 7 in the top panel inTable 6), while the dotted line shows how the male wage distribution would have changed in the absence of PP (that is, the difference in the counterfactual scenarios for 1998–2000 and 2006–08). Thus the gap between the two lines gives the effect of PP on changes in the distribution (corresponding to column 8 in the upper panel ofTable 6). PP makes little difference to the change in the wage distribution in the lower half of the wage distribution: wage disper-sion grew in the lowest quartile of the distribution, and would have done in a similar fashion in the absence of PP. Column 8 inTable 6shows that PP widened the 50–5 gap (relative to the counterfactual without PP jobs) but it is clear from the graph that most of the change was due to a small rise in the median (the solid line is higher than the dotted one) and not a fall in the 5th percentile. This illustrates how the graph can provide a more complete picture than just comparing two points alone.
In contrast, the graph confirms thefigures inTable 6showing broad PP contributed to rising earnings dispersion in the top half of the wage distri-bution: in the absence of PP the wage growth in the upper part of the dis-tribution would have been about half of what it actually was (an increase of about .10 log points compared with about .06 log points at the 80th per-centile, for example). In fact, what is striking from the graph is that wage dispersion would have actually fallen between roughly the median and the 80th percentile without PP jobs. Higher up (between about the 80th and 90th percentiles), dispersion would have increased to a small extent, but actual dispersion, reflecting the effect of PP jobs, increased much more. As indicated inTable 6, the picture looks rather different for men if we focus on the narrow measure of PP. PP measured in this way does re-sult in a wider wage dispersion than would be the case in its absence. Al-though this was the case both at the beginning and the end of our period of investigation, the effect was attenuated in the second period (Fig. 4a). Consequently, the effect of narrow PP jobs on changes in the wage dis-tribution over the period was actually to reduce that dispersion, though not by very much (Fig. 4b).20
Now we turn to wage dispersion among women. It is apparent from column 7 inTable 7that overall wage dispersion among women grew over the period, but only very marginally (variance increased by 0.011). This is partly because trends went in opposite directions in the top and bottom halves of the wage distribution: comparing the 50–10 and 90–50 gaps it seems wages became more compressed in the bottom
16
Most estimates in the table involve comparing distributions (actual vs counterfactual and/or changes over time), and so thefigures are differences not levels (unlike inFig. 2). Fol-lowingLMP (2009)we smoothed the intermediate percentiles using a moving average of +/ −2 percentiles (the unsmoothed estimates show a very similar pattern).
17The measures of actual dispersion are the same in each panel but are replicated for ease of comparison with the counterfactual measures.
18
The measures of the 1st and 99th percentiles are quite noisy and so we do not push the results for the extreme tails. However, the changes in the top and bottom deciles appear consistent with changes further towards the middle the distribution (and with the graphs of the full distribution shown below).
19Close to two-fifths of male employees received bonuses during this period. BHPS also asks“What was the total amount of bonus you received over the last twelve months?”For those receiving a bonus they were the equivalent of around about 3.5% of base pay in the late 1990s, rising to 4.5–5% towards the end of our period of investigation.
[image:8.595.35.284.77.169.2]20 As noted earlier, close to two-fifths of male employees received bonuses during this period. BHPS also asks“What was the total amount of bonus you received over the last twelve months?”For those receiving a bonus they were the equivalent of around about 3.5% of base pay in the late 1990s, rising to 4.5–5% towards the end of our period of investigation.
Table 5
Level and dispersion of log hourly wages by job type, 1998–2008.
Fixed pay Broad PP Narrow PP
Mean
Men 2.244 2.465 2.536
Women 2.090 2.224 2.325
Women (FT) 2.195 2.317 2.398
Variance
Men 0.291 0.310 0.304
Women 0.296 0.281 0.267
Women (FT) 0.273 0.261 0.246
Table 6
Effect of PP jobs on log wage distribution (men), 1998–2000 and 2006–2008.
1998–2000 2006–08 1998–2000 to 2006–08
Actual dispersion
Dispersion without PP jobs
PP job effect (2)–(1)
Actual dispersion
Dispersion without PP jobs
PP job effect (5)–(4)
Change in actual dispersion (4)–(1)
Change in PP job effect (6)–(3)
Percentage of dispersion change due to PP jobs (8)/(7)
(1) (2) (3) (4) (5) (6) (7) (8) (9)
Broad PP measure
Variance 0.304 0.283 0.022 0.344 0.295 0.049 0.039 0.027 68.3
Percentile gaps
90–10 1.373 1.310 0.063 1.389 1.307 0.082 0.016 0.020 119.2 99–90 0.403 0.373 0.030 0.459 0.316 0.143 0.056 0.113 201.8 95–50 0.981 0.883 0.097 1.006 0.849 0.156 0.025 0.059 236.7 90–50 0.761 0.689 0.072 0.760 0.679 0.082 −0.001 0.010 −1146.5 50–10 0.612 0.621 −0.009 0.629 0.628 0.001 0.017 0.010 57.5
50–5 0.790 0.812 −0.022 0.844 0.830 0.014 0.054 0.036 65.9
10–1 0.323 0.337 −0.014 0.420 0.440 −0.020 0.098 −0.006 −6.2 Narrow PP measure
Variance 0.304 0.290 0.014 0.344 0.334 0.010 0.039 −0.004 −10.4 Percentile gaps
90–10 1.373 1.333 0.040 1.389 1.366 0.024 0.016 −0.017 −101.0
99–90 0.403 0.403 0.000 0.459 0.458 0.001 0.056 0.001 1.2
95–50 0.981 0.934 0.047 1.006 0.981 0.025 0.025 −0.022 −89.4 90–50 0.761 0.727 0.034 0.760 0.735 0.025 −0.001 −0.009 1062.1 50–10 0.612 0.605 0.006 0.629 0.630 −0.002 0.017 −0.008 −44.3
50–5 0.790 0.787 0.003 0.844 0.826 0.018 0.054 0.015 27.8
[image:9.595.310.561.327.707.2]10–1 0.323 0.323 0.000 0.420 0.408 0.012 0.098 0.012 12.1
Fig. 3.a—Effect of PP jobs (broad measure) on wage distribution in 1998–2000 and 2006–
2008, Men; b—Effect of PP jobs (broad measure) on change in wage distribution between 1998–2000 and 2006–2008, Men.
[image:9.595.44.291.335.710.2]Table 7
Effect of PP jobs on log wage distribution (women), 1998–2000 and 2006–2008.
1998–2000 2006–08 1998–2000 to 2006–08
Actual dispersion
Dispersion without PP jobs
PP job effect (2)-(1)
Actual dispersion
Dispersion without PP jobs
PP job effect (5)-(4)
Change in actual dispersion (4)-(1)
Change in PP job effect (6)-(3)
Percentage of dispersion change due to PP jobs (8)/(7)
(1) (2) (3) (4) (5) (6) (7) (8) (9)
Broad PP measure
Variance 0.280 0.295 −0.015 0.291 0.296 −0.005 0.011 0.010 88.2 Percentile gaps
90–10 1.293 1.309 −0.016 1.306 1.336 −0.029 0.013 −0.013 −100.4 99–90 0.368 0.354 0.013 0.357 0.331 0.026 −0.011 0.012 −110.8 95–50 0.917 0.913 0.004 0.959 0.927 0.032 0.042 0.028 66.7
90–50 0.712 0.706 0.006 0.764 0.757 0.007 0.052 0.001 2.1
50–10 0.582 0.603 −0.022 0.542 0.578 −0.036 −0.039 −0.014 36.2 50–5 0.772 0.804 −0.031 0.752 0.815 −0.063 −0.021 −0.032 153.0 10–1 0.370 0.390 −0.020 0.407 0.442 −0.035 0.037 −0.015 −39.9 Narrow PP measure
Variance 0.280 0.285 −0.005 0.291 0.282 0.008 0.011 0.014 126.7 Percentile gaps
90–10 1.293 1.305 −0.012 1.306 1.285 0.021 0.013 0.033 252.4 99–90 0.368 0.367 0.000 0.357 0.355 0.002 −0.011 0.001 −12.5 95–50 0.917 0.907 0.010 0.959 0.926 0.034 0.042 0.024 56.3 90–50 0.712 0.710 0.002 0.764 0.738 0.026 0.052 0.023 44.9 50–10 0.582 0.596 −0.014 0.542 0.547 −0.005 −0.039 0.009 −24.1 50–5 0.772 0.789 −0.017 0.752 0.762 −0.010 −0.021 0.006 −30.7 10–1 0.370 0.375 −0.005 0.407 0.413 −0.006 0.037 −0.001 −1.7
Fig. 5.a—Effect of PP jobs (broad measure) on wage distribution in 1998–2000 and 2006–
[image:10.595.302.551.335.711.2]2008, All Women; b—Effect of PP jobs (broad measure) on change in wage distribution between 1998–2000 and 2006–2008, All Women.
[image:10.595.37.282.345.707.2]Table 8
Effect of PP jobs on log wage distribution (Full-time women), 1998–2000 and 2006–2008.
1998–2000 2006–08 1998–2000 to 2006–08
Actual dispersion
Dispersion without PP jobs
PP job effect (2)-(1)
Actual dispersion
Dispersion without PP jobs
PP job effect (5)-(4)
Change in actual dispersion (4)-(1)
Change in PP job effect (6)-(3)
Percentage of dispersion change due to PP jobs (8)/(7)
(1) (2) (3) (4) (5) (6) (7) (8) (9)
Broad PP measure
Variance 0.252 0.256 −0.004 0.274 0.288 −0.015 0.022 −0.011 −51.7 Percentile gaps
90–10 1.263 1.275 −0.012 1.277 1.296 −0.019 0.014 −0.007 −50.6 99–90 0.330 0.282 0.048 0.357 0.361 −0.004 0.027 −0.052 −195.6 95–50 0.849 0.800 0.049 0.907 0.860 0.047 0.058 −0.002 −3.6
90–50 0.660 0.625 0.035 0.713 0.677 0.036 0.053 0.001 2.2
50–10 0.603 0.650 −0.046 0.564 0.618 −0.055 −0.040 −0.008 20.7 50–5 0.778 0.830 −0.052 0.766 0.887 −0.120 −0.011 −0.068 604.4 10–1 0.341 0.351 −0.010 0.408 0.462 −0.054 0.068 −0.044 −65.0 Narrow PP measure
Variance 0.252 0.254 −0.001 0.274 0.271 0.002 0.022 0.004 17.2 Percentile gaps
[image:11.595.44.291.323.707.2]90–10 1.263 1.263 0.000 1.277 1.253 0.024 0.014 0.024 174.2 99–90 0.330 0.326 0.004 0.357 0.365 −0.008 0.027 −0.012 −43.1 95–50 0.849 0.822 0.027 0.907 0.866 0.041 0.058 0.014 23.7 90–50 0.660 0.638 0.022 0.713 0.665 0.048 0.053 0.026 49.0 50–10 0.603 0.625 −0.022 0.564 0.587 −0.024 −0.040 −0.002 5.2 50–5 0.778 0.801 −0.023 0.766 0.805 −0.039 −0.011 −0.016 138.3 10–1 0.341 0.345 −0.004 0.408 0.423 −0.015 0.068 −0.011 −15.8
Fig. 7.a—Effect of PP jobs (broad measure) on wage distribution in 1998–2000 and 2006–
[image:11.595.312.560.326.711.2]2008, Full-time women; b—Effect of PP jobs (broad measure) on change in wage distribution between 1998–2000 and 2006–2008, Full-time women.
half of the wage distribution, whereas they became more dispersed in the top half of the distribution. How did PP affect this distribution?
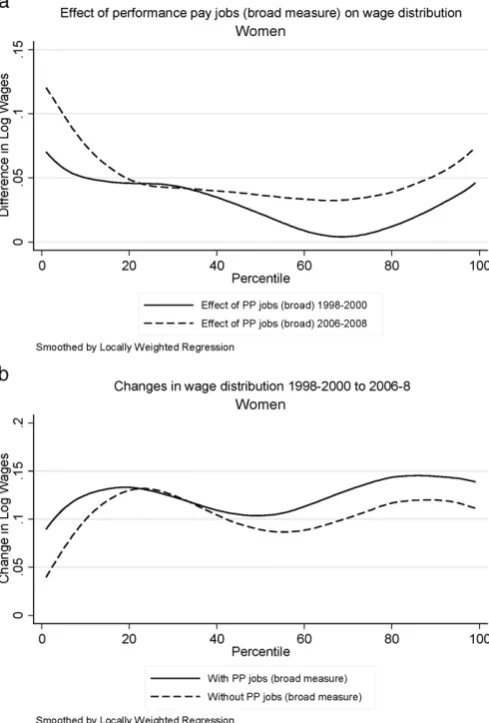
If we begin with the broad PP measure, it is apparent that it tended to compress women's earnings at the bottom of the distribution in both periods (column 3 for 1998–2000 and column 6 for 2006–2008). This compressing effect became more apparent in the second period. There was little effect at the top of the distribution in 1998–2000 (col-umn 3) but some widening in 2006–2008 (column 6).
The overall effects of these counterveiling effects of the broad mea-sure of PP on women's wages is best illustrated graphically.Fig. 5a indi-cates that the broad measure of PP resulted in a wage distribution for women that was more U-shaped than it would have been in its absence. However, the U wasflatter further up the wage distribution in the sec-ond period relative to thefirst. This is why PP contributed to a growth in wage dispersion in the top half of the wage distribution compared with a counterfactual world without PP (compare the solid line with the dot-ted line inFig. 5b). This pattern of results is similar for women when using the narrow measure of PP jobs (Fig. 6a and b).
Finally we turn to women in full-time employment. Their wages be-came more dispersed over the period, the effect being more pronounced than for all women (variance rose by 0.02,Table 8, column 7, compared with 0.01 for all women,Table 7, column 7). However, as in the case of all women, there was compression in earnings at the bottom of the dis-tribution and growing earnings dispersion at the top of the disdis-tribution. The growth in dispersion in the top half of the distribution is actually quite substantial: the 95–50 ratio grows by 0.06 log points.
Turning to the effects of PP on the dispersion of full-time women's earnings and focusingfirst on the broad PP measure it is ap-parent that PP is associated with greater wage dispersion at the top of the distribution but lower dispersion at the bottom of the distribu-tion. This is the case in both 1998–2000 and 2006–2008 (upper panel
Table 8, columns 3 and 6), but there is a trend towards more equalisation over the period (that is, less expansion at the top and more compression at the bottom, column 8).
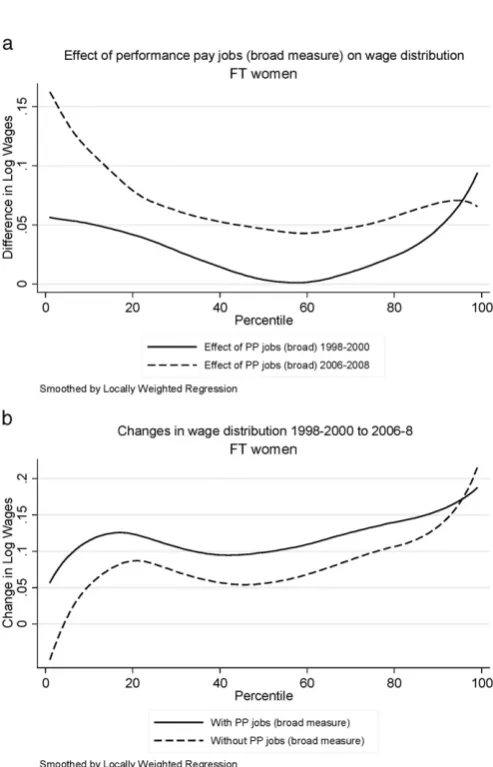
Looking at the whole distribution graphically using the broad PP measure the PP effect on full-time womens' earnings relative to a counterfactual world without PP is highest at the top and bottom of the earnings distribution, forming the U-shape referred to above for all women. The size of this effect is larger in the second period (2006–2008) relative to the early period (1998–2000) but it is more similar across all the distribution, except at the very bottom (Fig. 7a). For this reason PP (broadly defined) resulted in higher earnings among full-time working women, but it had little effect on changing inequality except perhaps to mitigate the increase to-wards the bottom and at the very top (Fig. 7b).
If we turn to the narrow PP measure and consider its effects on the log hourly earnings of women working full-time this is a shallow U-shape, in both periods, but the size of the effect is greater in 2006–08 (Fig. 8a) such that PP increases wage dispersion over the period, as indi-cated by the rising solid line inFig. 8b relative to the dotted line for the counterfactual“no PP”world, once one moves beyond the lowest quar-tile of the earnings distribution.
5. Conclusions
There has been much speculation about the various causes of growing wage dispersion in Britain, the United States and elsewhere. The seminal paper byLMP (2009)showed PP contributed signifi -cantly to the growth in earnings dispersion in the United States through to the early 1990s. Using data from the British Household Panel Survey (BHPS) we adopt a similar estimation approach to LMP but applied to Britain during the decade of economic growth that ended abruptly with the recession of 2008. In contrast to LMP, wefind that rather than increasing, the prevalence of PP declined (or at most stayedflat) over the decade to 2008. This applies to both broad and narrow measures of PP (although there is some
evidence that bonus payments increased), and the trends appear comparable with more recent declines in the US identified by
Gittleman and Pierce (2013).
We confirm others'findings that wage inequality grew overall during the decade to 2008, largely due to growing earnings dispersion in the top half of the wage distribution, but there was also some reduction of in-equality among women in the bottom of the distribution. The contribu-tion of PP to these changes depends on how the incidence and returns to PP changed and where workers sit in the wage distribution. While the incidence of PP fell, there was still a substantial wage return to PP and indeed it appears to have increased over time. Comparing the actual wage distribution with a counterfactual world without PP, wefind the net effect of these changes to be that PP is associated with greater wage dispersion towards the top and, particularly for broad PP, and that this disequalising effect increased over the period, possibly because of increased bonuses. This was accompanied by some counterveiling ef-fects at the bottom, in particular broad PP is associated with more com-pressed wages in the lower half of the distribution for women.
However, the size of these PP effects is relatively modest, perhaps in part because, in contrast to LMP, there is no indication that PP jobs be-came increasingly prevalent, among either men or women, in the de-cade prior to recession.
Given the limited changes in PP in Britain, we performed a further counterfactual exercise to see what the effects might be if PP did ex-pand substantially. Specifically, we simulated the effect of a 10 per-centage point increase in PP incidence and looked at its effect on wage dispersionas it was in 2006–08.21The simulation reveals that
the effects of such an expansion on wage dispersion are very modest indeed. The biggest effects come from an increase in the proportion of men in receipt of“narrow”PP: those around the 80th percentile of the wage distribution see an additional growth of around .025 log points in their wages compared with virtually no growth among those at the 20th percentile in the wage distribution. The ef-fects are small relative to thecross-sectional reweighting estimates presented earlier because those estimates were comparing PP effects against a counterfactual world with no PP, clearly a much bigger change in regime than a simulated growth of 10 percentage points in PP usage. The simulation is nevertheless useful because it confirms that, even with PP growth of a similar magnitude to LMP's for the United States, PP is unlikely to have had profound effects on the growth in wage dispersion in Britain.
One reason why PP may not have played a big role in the growth of wage dispersion in Britain is that, for most people in PP jobs, PP accounts for a relatively small percentage of their total earnings. Since 1997 BHPS has asked employees in receipt of bonuses“What was the total amount of bonus you received over the last twelve months?”. For those in receipt of bonuses, bonus amounts have been rising among men and women in full-time employment (Appendix Fig. A.1). This is consistent with other evidence showing that PP accounts for an increasing proportion of
firms' wage bills even though the number offirms paying for perfor-mance has not risen (Forth et al., 2014). But the size of these bonus pay-ments remains fairly modest, despite their growth, and we know nothing from BHPS regarding the size of other performance payments.
Funding
This work is funded by the Economic and Social Research Council, Grant Reference ES/I035846/1. Bryan acknowledges core funding from the University of Essex and the Economic and Social Research Council (RES-518-28-001) for the Research Centre on Micro-Social Change, ISER, University of Essex.
Acknowledgments
We thank the UK Data Archive for access to the British Household Panel Survey as well as John Forth and Lucy Stokes for use of their code to make the endpoint adjustment inSection 3. We are grateful to the Ed-itor and three anonymous referees for their comments, and to partici-pants at the Performance Pay Conference at NIESR and the 2015 Royal Economics Society Conference for useful comments on an earlier draft.
[image:13.595.313.558.82.260.2]Appendix A
Table A.1
The PP Wage Premium, 1998–2008.
Raw Adjusted (OLS) Adjusted (FE)
Broad PP
Men 0.221** 0.113** 0.040**
(0.008) (0.006) (0.006)
Women 0.134** 0.086** 0.066**
(0.008) (0.006) (0.007) Women (FT) 0.120** 0.095** 0.060** (0.010) (0.007) (0.008)
Narrow PP
Men 0.228** 0.100** 0.044**
(0.009) (0.006) (0.007)
Women 0.225** 0.087** 0.057**
(0.009) (0.006) (0.008) Women (FT) 0.194** 0.098** 0.047** (0.010) (0.007) (0.008)
[image:13.595.43.293.277.420.2]Number of persons (person-observations) is 3918 (22,108) [men]; 4221 (23,550) [women]; 3148 (14,458) [FT women]. Dependent variable is the log hourly wage. Regression-adjusted estimates also control for quadratics in age and job tenure, and dummies for marital status, part-time work, temporary andfixed terms jobs, trade union coverage, public sector status, occupation (9 categories), industry (11 categories), establishment size (3 categories), region (12 categories), and wave (8–18). Raw estimates are weighted for survey design and non-response. Standard errors in parentheses. *signif-icant at 10%; **significant at 5%.
Table A.2
Mean and variance in log hourly wages over time for PP and FP employees.
Mean log hourly wage Variance log hourly wage
1998–2000 2006–2008 Difference 1998–2000 2006–2008 % change
Men
FP 2.201 2.266 0.065 0.286 0.314 9.79 Broad
PP 2.398 2.527 0.129 0.300 0.324 8.00 Narrow
PP 2.473 2.582 0.109 0.309 0.313 1.29
Women
FP 2.027 2.128 0.101 0.290 0.285 −1.72 Broad
PP 2.130 2.289 0.159 0.264 0.274 3.79 Narrow
PP 2.213 2.405 0.192 0.256 0.253 −1.17
FT Women
FP 2.148 2.230 0.082 0.254 0.270 6.30 Broad
PP 2.216 2.376 0.160 0.247 0.264 6.88 Narrow
PP 2.289 2.462 0.173 0.237 0.240 1.27
Fig. A.1Amount of bonus received in the last 12 months for those in re-ceipt of bonuses.
References
Atkinson, A., Piketty, T., Saez, E., 2011.Top incomes in the long run of history. J. Econ. Lit. 49 (1), 3–71.
Autor, D.H., Katz, L.F., Kearney, M.S., 2008.Trends in US wage inequality: revising the re-visionists. Rev. Econ. Stat. 90 (2), 300–323.
Autor, D.H., Dorn, D., Hanson, G.H., 2013.Untangling Trade and Technology: Evidence From Local Labour Markets. mimeo.
Bell, B., Van Reenen, J., 2010.Bankers and extreme wage inequality in the UK. Centre for Economic Performance Special Paper No. 21.
Bell, B., Van Reenen, J., 2011.Firm performance and wages: evidence from across the cor-porate hierarchy. CEP Discussion Paper No. 1088.
Bell, B., Van Reenen, J., 2013.Bankers and Their Bonuses. CEP Occasional Paper No. 35.
Bollinger, C.R., Hirsch, B.T., Hokayem, C.M., Ziliak, J.P., 2014.Trouble in the Tails: Earnings Non-Response and Response Bias Across the Distribution. mimeo.
Brewer, M., Wren-Lewis, L., 2016.Accounting for changes in income inequality: decom-position analyses for the UK, 1978–2008. Oxf. Bull. Econ. Stat. 78 (3), 289–322.
Bryson, A., Forth, J., Stokes, L., 2014.The performance pay premium: how big is it and does it affect wage dispersion? NIESR Discussion Paper No. 433
Card, D., Lemieux, T., Riddell, W.C., 2004.Unions and wage inequality. J. Lab. Res. 25, 519–559.
DiNardo, J., Fortin, N., Lemieux, T., 1996.Labor market institutions and the distribution of wages, 1973-1993: a semi-parametric approach. Econometrica 64 (5), 1001–1045.
Dustmann, C., Ludsteck, J., Schonberg, U., 2009.Revisiting the German wage structure. Q. J. Econ. 124 (2), 843–881.
Forth, J., Bryson, A., Stokes, L., 2014.Are Firms Paying More For Performance? NIESR Dis-cussion Paper No. 423
Gabaix, X., Landier, A., 2008.Why has CEO pay increased so much? Q. J. Econ. vol. 121 (1), 49–100.
Gittleman, M., Pierce, G., 2013.How prevalent is performance-related pay in the United States? Current incidence and recent trends. Natl. Inst. Econ. Rev. 226, R4-416.
Gittleman, M., Pierce, G., 2015.Pay for performance and compensation inequality: evi-dence from the ECEC. Ind. Labor Relat. Rev. 68 (1), 28–52.
Green, C.P., Heywood, J.S., 2012.Don't Forget the Gravy! Are Bonuses and Time Rates Complements. mimeo.
Heywood, J.S., Parent, D., 2012.Performance pay and the white-black wage gap. J. Labor Econ. 30 (2), 249–290.
Heywood, J.S., Parent, D., 2013.Performance Pay, the Gender Earnings Gap and Parental Status. mimeo.
Kaplan, S.N., 2012.Executive compensation and corporate governance in the US: percep-tions, facts and challenges. NBER Working Paper No. 18395.
Lazear, E., 1986.Salaries and piece rates. J. Bus. 59, 405–431.
Lazear, E., 2000.PP and productivity. Am. Econ. Rev. 90, 1346–1361.
Lemieux, T., MacLeod, W.B., Parent, D., 2009.PP and wage inequality. Q. J. Econ. 124 (1), 1–49.
Lindley, J., Machin, S., 2013.Wage inequality in the Labour years. Oxf. Rev. Econ. Policy 29 (1), 165–177.
Machin, S., 2011.Changes in UK wage inequality over the last forty years. In: Gregg, P., Wadsworth, J. (Eds.), The Labour Market in Winter. Oxford University Press, Oxford.
Manning, A., Saidi, F., 2010.Understanding the gender pay gap: what's competition got to do with it? Ind. Labor Relat. Rev. 63 (4), 681–698.
Papps, K.L., Bryson, A., Gomez, R., 2011.Heterogeneous worker ability and team-based production: evidence from major league baseball, 1920–2009. Labour Econ. 18 (3), 310–319.
Prendergast, C., 1999.The provision of incentives infirms. J. Econ. Lit. 37 (1), 7–63.
Sommerfeld, K., 2013.Higher and higher? Performance pay and wage inequality in Germany. Appl. Econ. 45 (30), 4236–4247.
[image:13.595.43.292.523.730.2]