The Impact of Fuel Properties on the Composition of Soot Produced by the
Combustion of Residential Solid Fuels in a Domestic Stove
F.A. Atiku, E.J.S. Mitchell, A.R. Lea-Langton
1, J.M. Jones, A. Williams
⁎
, K.D. Bartle
Energy Research Institute, University of Leeds, Leeds LS2 9JT, UK
a b s t r a c t
a r t i c l e i n f o
Article history:
Received 15 February 2016 Received in revised form 20 May 2016 Accepted 23 May 2016
Available online 5 June 2016
Soot is formed from the incomplete combustion of biomass and conventional fossil fuels. It consists largely of a carbonaceous core termed Elemental Carbon (EC) with adsorbed volatile organic species, commonly termed Or-ganic Carbon (OC). Estimation of the ratio of BC/OC is critical as climate models have recognised the Global Warming Potential (GWP) of BC as the second most important climate forcing agent after carbon dioxide. This paper presents values of EC, OC and EC/TC (where TC = EC + OC) for three different soot types: Firstly, soots col-lected onfilters from the combustion of eight fossil fuel and biomass residential solid fuels (RSF), burned in a 6 kW heating stove. Secondly, chimney soot deposits taken from‘real-life’stoves installed in domestic homes; andfinally wick burner soots generated from biomass model compounds; namely eugenol, furfural and anisole. Values of the EC/TC ratios for wood logs, torrefied briquettes, coal and smokeless fuel are given. These ratios are highly dependent on burning conditions; namely theflaming and smouldering phases. The results of this study suggest that EC and OC emissions from various solid fuels differ substantially in composition and relative propor-tion, which is useful information for climate models.
© 2016 The Authors. Published by Elsevier B.V. This is an open access article under the CC BY license (http://creativecommons.org/licenses/by/4.0/).
Keywords: Biomass combustion emissions particulate matter
1. Introduction
The Global Warming Potential (GWP) of combustion gases such as carbon dioxide and methane has been well researched[1]. There is in-creasingly interest in the GWP associated with the particulate and aero-sol fractions of combustion emissions. Soot formed by the incomplete combustion of fossil or bio-fuels consists of agglomerated chains of car-bonaceous spherules of elemental carbon (EC) with condensed organic compounds (OC). OC is also known as the volatile fraction or solvent ex-tractable fraction. Black Carbon (BC) consists of the light absorbing frac-tion of the carbonaceous aerosols which mainly consists of EC, but they are not exactly the same. Watson et al.[4]found that despite being well correlated they are not measures of the same properties of particulate matter.
The organic fraction also contains light absorbing brown carbon (BrC), which is mostly associated with relatively involatile organic compounds such as tars[5]. EC and OC emissions and light absorption properties of residential solid fuel combustion generated particulate matter are deter-mined by type of fuel and the combustion conditions, and a need for a better understanding of these effects has been highlighted[6,7].
The ratio of BC/OC is of interest in terms of the effect of soot particles on climate change[1,2,3]. ]. This is because BC has a net positive radia-tive forcing (warming effect) and OC has a net negaradia-tive radiaradia-tive forcing (cooling effect). The global 100 year GWP for BC and OC fractions are 900 and−46[1]. Some studies suggest that biomass particles can ex-hibit higher ratios of OC to BC (or EC) in comparison with conventional fuels[2,3].
Exposure to soot particles importantly also leads to adverse health effects[8–12]. Many of the health impacts are associated with the adsorbed volatile species in the soot OC fraction, and it is known that oxy-PAH species, such as semiquinones can damage cell tissue[9].
Extensive research has been made into the mechanism of soot for-mation during the combustion of hydrocarbon and soot forming mech-anisms have been postulated, for example, references[13–18]. The mechanism of soot formation from biomass combustion however in-volves additional routes arising from the oxygenated components in biomass. Recently models have been proposed for the formation of soot from wood combustion[17,18]in which the role of the aromatic lignin components has been emphasised.
Studies have been made of the emission of BC (and EC) as well as OC from the combustion of biomass, and especially wood fuel, for example
[6,10,11,19–22]. There are considerable differences between the values obtained by the various groups and a number of standard methods have been recommended including optical examination of collected samples
[4,23,24], but they do not give detailed insight into their formation mechanism. Ross et al.[25]measured the solvent extractable organic
⁎ Corresponding author.
E-mail address:[email protected](A. Williams). 1
Permanent address: Department of Mechanical, Aero and Civil Engineering, Manchester University, Manchester M13 9PL, UK.
http://dx.doi.org/10.1016/j.fuproc.2016.05.032
0378-3820/© 2016 The Authors. Published by Elsevier B.V. This is an open access article under the CC BY license (http://creativecommons.org/licenses/by/4.0/). Contents lists available atScienceDirect
Fuel Processing Technology
could be divided into three classes. These are: weakly bound com-pounds easily desorbed and easily extractable in solvents, more strongly bonded surface material that are probably large three-dimensional PAH or polyyne compounds, and highly developed ordered soot, i.e. elemen-tal carbon. An aerosol time offlight mass spectrometer (ATOFMS) has also been used[26–28]but the interpretation of these results raises is-sues about the meaning of BC, EC and OC.
Small biomass stoves are widely used throughout the world and contribute significantly to ambient air pollution and feedstock parame-ters significantly influence the emissions of NOx, CO and particulate matter. The soots studied in this work are sampled from theflue gases and also from deposits in chimneys from multi-fuel and wood burning domestic stoves. Previous work has identified the main pyrolysis prod-ucts during thefirst stages of biomass combustion to include eugenol, furfural and anisole[17]so these species are investigated as model com-pounds. The results from real systems are complicated by the fact that the organic material consists of the precursors to the formation of soot as well as incompletely combusted fuel. The smoke also contains small quantities of inorganic matter and it is known that the fuels studied here are a major source of non-soil K, Si, Ca, Fe, Ti and Cl.
In this paper we have measured the properties of the soot emitted in terms of the effect on global warming. In particular we have made mea-surements on the values of BC and OC from a domestic stove using a range of fuels and obtained novel measurements on their variation with time. The results from practical systems have been compared with data obtained from laboratory studies using model compounds that are produced during the combustion of biomass. We have also con-sidered the relationship between BC, OC and the inorganic fraction of the particulate matter.
2. Experimental Methods
Afixed bed stove (manufactured by Waterford Stanley Oisin) which meets the current designs for use with multiple fuels was used for the main experiments and which has been described previously and an out-line diagram given[22]. In this text it is referred to as the‘Stove’. Essen-tially it consists of a rectangular box 259 mm high, 270 mm wide and 190 mm deep with a grate at the bottom and a deflector plate across the top section; no secondary air was added. The deflector plate effec-tively divided the unit into a primary and secondary zones with vol-umes of 8 × 10⁻³m3and 1.4 × 10⁻³m3respectively. The residence
times in each zones are 0.9 and 0.2 s. The Stove is nominally rated as having a maximum non-boiler thermal output of 5.7 kW and in these experiments the unit was run at approximately maximum load. The mass of a typical charge is 2.7 kg.
The draft in theflue was provided partly by natural convection and partly by the extraction system, their combined effect was to produce a static pressure in theflue of 12 Pa, as specified in Section 6.4 of DS EN 13240; 2001. Soot samples were collected from theflue gases onto a pre-weighedfilter paper at specific times as before and analysed ex situ[22]. Importantly thefilter papers were maintained at a tempera-ture of 70 °C during sampling as set out in BS 3841–3: 1994, as before. Other samples were obtained from soot deposits in chimneys of multi-fuel (coal and/or wood) and wood-burning domestic stoves, these are referred to as the‘Multi-fuel Stove’and‘Wood Stove’in the text. These soot samples were exposed toflue temperatures of about 200-300 °C., and they were allowed to cool in air before collection.
Soot samples were obtained from model wood pyrolysis products, namely, eugenol, furfural, anisole and also from n-decane using a wick burner. This type of burner was used because organic compounds with high boiling points cannot easily be vaporised and burned in the gas phase in diffusion or premixed burners because they thermally de-compose at their boiling point. A technique recently used by us[27]
and others[29,30]is to use carefully controlled combustion using diffu-sion flames burning on a wick. The burner has been previously
kept at 7.0 mm. These diffusionflame soots were collected onto a glass surface at a known height above theflame. They were stored under argon prior to analysis to minimise secondary reactions.
Thermogravimetric analysis (TGA) was used to measure the OC, EC and ash fractions of the soot[31,32]by means of a Stanton Redcroft in-strument. The samples were stored in a desiccator prior to analysis. The OC mass fraction was determined by heating the soot samples in nitro-gen to 550 °C, ensuring that a steady mass was achieved. During this heating period, continuous FTIR characterisation was conducted on the evolved material using a Thermo Scientific Nicolet iS10 model analyser. The gas was switched to air and the temperature was in-creased to 600 °C and held until no further mass loss was observed, this represented the EC. The mass remaining after the OC and EC were measured represented the ash fraction. Huang et al.[32]found that most OC is released at a relatively low temperature of 550 °C during py-rolysis, while EC is released at higher temperatures via combustion.
The soot samples were also analysed for OC by using Py-GC-MS at selected temperatures or by ramped temperature pyrolysis for detailed analysis of the OC. The system used was a Shimadzu 2010 GC-MS linked to a CDS 5200 series pyrolyser operating in trap mode. In this, the sam-ple was heated at temperature of 100 °C to a maximum of 600 °C and desorbed separately into the GC-MS in order that chromatograms could be obtained. After pyrolysis the resulting products (C4-C20) are
trapped onto an adsorbent trap (Tenax TA) at 40 °C by operating the CDS pyrolyser in adsorbent mode. The trap is then desorbed at 300 °C in aflow of helium onto the chromatographic column. The gaseous products (H2, CO, CO2, CH4etc) are not trapped onto Tenax TA and are
vented. The CDS 5200 pyrolysis unit was connected to a Shimadzu 2010 GC-MS. The products were separated on an Rtx 1701 60 m capil-lary column, 0.25 mm id, 0.25μmfilm thickness, using a temperature program of 40 °C, static time 2 min, ramped to 250 °C at a ramp rate of 4 °C min−1with a static time of 30 min; the column head pressure
at 40 °C was 2 bar. For all GC-MS studies, the chromatograms were assigned on the basis of the NIST Mass Spectral Library Database, from previous literature and by known retention times, as described before
[18].
Micro-pyrolysis of soot samples was undertaken using a CDS 5200 series micro-pyrolyser in which the samples were directly heated at a nominal heating rate of 20 °C ms−1to a hold temperature of 600 °C
and the values of EC and TC determined by the mass loss.
Elemental analysis of the soot samples was undertaken by digestion in concentrated nitric acid (0.1 g in 10 ml 69% HNO3) and atomic
ab-sorption mass spectrometry (Varian 240 fs AAS).
3. Experimental Results
3.1. BC/OC measurements
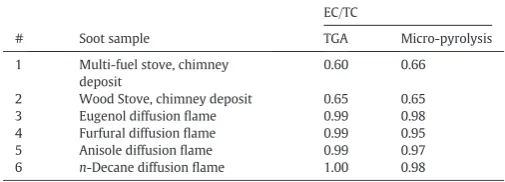
Samples of deposited soot taken from theflues of the Multi-fuel and Wood Stove units and from the diffusionflames of the model fuels (eu-genol, furfural, anisole and n-decane) were analysed by TGA and the values of OC, EC and ash (inorganic material) determined. Typical plots are shown inFig. 1together the method used to define EC, OC and ash. The OC is defined by the temperature it is collected at; here thefilter temperature is set at 70 °C as before[22]as required by BS 3841–2: 1994 so that low boiling point material is not collected. In the equivalent soot measurement for diesel engines this temperature is set at 52 °C. Data obtained for EC/TC in this way are given inTable 1
for fuels numbered 1–6. TC is taken as the sum of EC and OC. Values of EC/TC were also determined for these samples using the Micro-pyroly-sis method previously described, and these values are also given in
Table 1.
values of OC/EC vary with time, the data obtained are complex and only one example, for the torrefied fuel (fuel no. 3), is given inFig. 2.
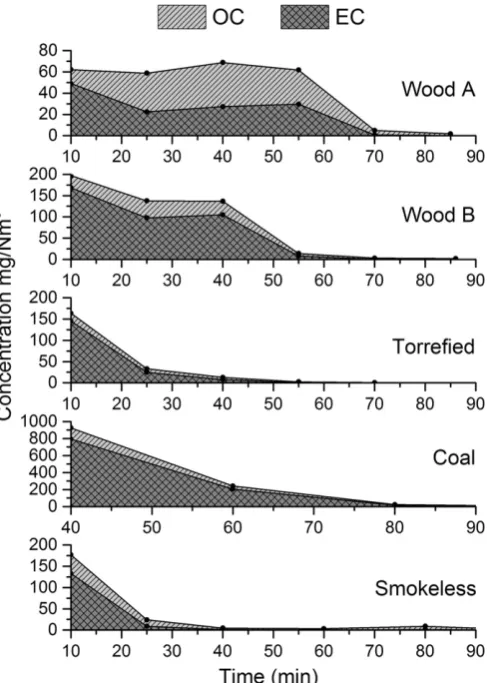
Data for EC and OC for the samples collected on thefilter papers dur-ing the combustion of two woods of different composition, a torrefied fuel, a biomass blend, coal and a smokeless fuel are shown inFig. 3. The points at which the measurements were made are indicated. It should be noted that the differences in the burning rates of the fuels are determined by the size of the fuel particles (that is the surface area) as well as the combustion air requirements.
The detailed compositions of these fuels, which have been used for a previous study, have been given[22]. However their volatile contents are given again inTable 2because of their significance to this work; the moisture content of the wood was about 8 wt%, the torrefied wood about 5 wt%, the coal and the peat about 7 wt% and the other fuels between 2 and 6 wt%[22]. It is clear fromFig. 3that both EC and OC and EC/TC vary with time in a way that depends on the fuel type. For the wood logs, the composition of the soot is highly dependent on the phase (flaming or smouldering) of combustion. Flaming combustion promotes the formation of highly carbonaceous soot, dominated by EC. Smouldering combustion forms mostly organic compounds and tars, which condense to form a brown organic aerosol deposit called
‘brown carbon’[5]. Values of EC/TC are given inTable 2for samples numbered 7–14.
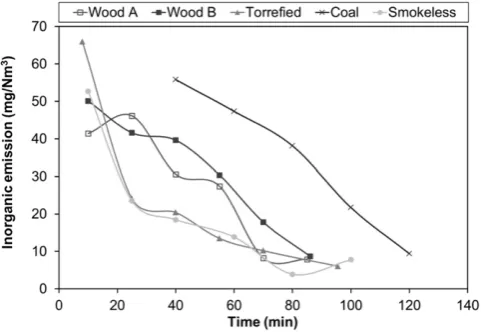
The inorganic content for soot samples from the Stove studies for Woods A (fuel no 7), B (no 8), Torrefied wood (no 9), Coal (no 10) and Smokeless fuel (no 11) were determined and are shown inFig. 4. The inorganic content again varied with time but typically at a mid-point of the combustion cycle, namely after 30 min, was about 25% of the total particulate material for all fuels.
Samples of soot deposits were taken from the Multi-fuel and Wood stoves and examined by TGA (cfFig. 1). There was a considerable amount of ash present in these samples (cfFig. 1.), the highest for the Multi-fuel stove at 21 wt%; the ash content from the Wood Stove was lower. The values obtained are shown inFig. 5together with a typical value for theflue gases during the combustion of all the fuels during theflaming phase. These ash levels are lower than this average during the later stages of combustion.
The inorganic content of the deposited soot samples from theflues was analysed by AAS. The results are presented inTable 3. The results show significant differences in the content of Na, Mn , Ca and Al.
The model fuels were all pure liquids and soot deposits from them did not contain inorganic material.
3.2. Nature of the soot samples and the associated OC
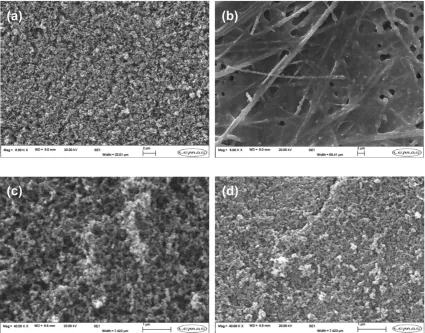
Experimental data were obtained on the black and the brown soot samples resulting from the combustion of wood sample A during the stove studies. SEM images of soot on thefilter obtained from the com-bustion of Wood A during (a)flaming combustion, which has a high BC, and (b) smouldering combustion, which has high OC and the forma-tion of brown carbon (BrC). It is seen fromFig. 6(a) that the BC samples consist of spherical particles with basic units of about 55 nm diameter but largely consisting of chains of agglomerates up to1000 nm in size. The OC/BrC sample shown inFig. 6(b) is an amorphous tar-like materi-al;fibres from thefilter are also apparent in this image. TGA analysis of this tar showed that it consisted of 83 wt% volatile material and 17 wt%
fixed carbon on a dry ash free basis.
Thesefilter samples of the black carbon and brown carbon were analysed by Py-GC-MS at 300 °C using the method given earlier. The re-sults are shown inFig. 7(a) and (b):
It should be noted that these samples are those in the temperature window of thefilter temperature, 70 °C, and the Py-GC-MS pyrolysis temperature of 300 °C; the same samples were heated to 400 and 500 °C with only little evolution of further material. But there is much less material evolved compared with other studies where higher tem-peratures were used. For example, Fitzpatrick et al.[17]used a temper-ature of 1000 °C whilst Song and Peng[31]used temperatures up to 700 °C. In the chromatograms inFig. 6the important components are identified in the key. The apparently raised baseline between 25 and 50 min in the chromatogram reproduced inFig. 7results from the over-lapping signals from very many unresolved low-concentration compo-nents of the tar thermally desorbed at 300 °C; by analogy with the large number of compounds present in wood pyrolysis products[17, 33,34]and carbon based materials[31]not one constituent of the base-line signal is present at sufficient concentration to be detected individu-ally. There is still controversy concerning the mechanism which leads to the observed composition of cellulose pyrolysis products, but there is general agreement[34,35]that two competing routes operate, with production on the one hand of gas and char, and on the other liquid (primary) tars predominantly made up of levoglucosan, along with smaller amounts of other sugars. Secondary reactions give rise to anhydrosugars, furans, ketones and carboxylic acids among which com-pounds acetol and hydroxyacetaldyde are prominent[35].
[image:3.595.120.487.53.201.2]The sugars which contribute markedly to the chromatograms of the brown and black tars evidently originate from cellulose and hemicellu-lose and represent the primary pyrolysis products sampled at an early
Fig. 1.Thermogravimetric analysis of (a) deposit from inside a multi-fuel stove chimney and (b) soot deposit from a eugenolflame.
Table 1
Soot EC/TC determined by TGA and comparison with micro-pyrolysis method.
EC/TC
# Soot sample TGA Micro-pyrolysis
1 Multi-fuel stove, chimney deposit
0.60 0.66
2 Wood Stove, chimney deposit 0.65 0.65
3 Eugenol diffusionflame 0.99 0.98
4 Furfural diffusionflame 0.99 0.95
5 Anisole diffusionflame 0.99 0.97
[image:3.595.41.294.653.744.2]stage. These oligosaccharides mostly rapidly decompose, but significant amounts are weakly adsorbed on the carbonaceous particles and are desorbed at 300 °C. The difference in quantity and distribution of the products in the tars then depends on the extent of further decomposi-tion, as well as on their chemical composition and the nature of the car-bon particle surface. Thus levoglucosan was present in brown smoke at a considerably higher concentration than in black smoke, but the com-pound at highest concentration in both was 1.6-anhydro-alpha-D -glucofuranose. There is strong evidence[31,35]that the nature and composition of cellulose pyrolysis products is influenced by the pheno-lic compounds produced by decomposition of lignin; methoxybenzene is present at high concentration in both black and brown smoke.
Samples were taken from the deposited soot in the chimneyflue from the Multi-fuel stove. These consist of soot that has been subject to heat after deposition and their nature is different from the samples taken onfilters. Their only role in terms of particulate emissions is if they fragment and are entrained in theflue gases. The Multi-fuel stove soot showed two phases of mass loss: with most loss up to ~ 320 °C then a slower rate of OC release up to thefinal temperature. These two phases may correlate with the phases of weakly bound and strongly bound material[25]. A Py-GC-MS examination was made of these de-posited soot samples and an example is shown inFig. 8(a) pyrolysed at 400 °C. It contained a prominent series of peaks attributed to the al-kane/alkene pairs extending from C12to C25with a maximum at C18
and thought to arise from alkyl radicals generated by beta-bond scission of long chain alkyl aromatics. With increasing pyrolysis temperature, 500 °C and 600 °C (results shown inFig. 7(b) and (c)) the series was ex-tended to lower carbon numbers, and was superposed on a partially un-resolved background of many peaks including those from 1 to 4 ring PAH substituted with (mainly methyl) short-chain alkyl groups and identified by selective-ion monitoring MS. This behaviour is typical of the pyrolysis products of the higher MW aromatic-based constituents
of heavy hydrocarbon such as asphaltenes[36]. The lower MW com-pounds are much more prominent in the 600 °C product.
Overall, the results of characterisation of the soot from the chimney
flue of the Multi-fuel stove are consistent with the deposition in theflue of the highest MW fraction of a hydrocarbon oil fuel. These are mixed with the phenolic components of the biomass tar from lignin.
Soot samples from the diffusionflame combustion of furfural, anisole, eugenol andn-decane were obtained using the diffusionflame burner and collected on an uncooled glass plate (at about 100 °C) at known distances above theflame. These deposits were of a hard partic-ulate nature except for the eugenol soot which was afluffy, typically ar-omatic type of soot. Examples of the soots are shown inFig. 5(c) for anisole andFig. 5(d) forn-decane. In the former case the sample consisted of chains of soot with the diameter of the individual particles
Volatile matter, EC/TC, OC and EC for fuels 7–14.
VM EC/TC OC mg MJ−1 EC mg MJ−1
No Fuel % db Flam Smo Avg Flam Smo Avg Flam Smo Avg
7 Wood A 84.2 0.42 0.12 0.30 40.1 7.7 27.1 30.2 1.1 18.5
8 Wood B 79.3 0.69 0.13 0.46 17.1 3.4 11.6 45.8 0.5 27.7
9 Torrefied briquettes 72.1 0.67 0.17 0.37 4.9 1.3 2.8 11.5 0.3 4.8
10 Peat Briquettes 64.4 0.34 0.19 0.28 135.2 5.8 83.4 37.6 1.6 23.2
11 Coal 39.7 0.85 0.47 0.62 40.6 2.5 17.7 240.5 4.0 98.6
12 Biomass blend 14.0 0.43 0.20 0.25 24.4 11.7 14.3 18.7 3.1 6.2
13 Low smoke fuel 23.4 0.47 0.30 0.38 55.2 7.2 31.2 39.2 4.9 22.0
14 Smokeless fuel 8.2 0.38 0.19 0.23 13.7 2.8 5.0 7.9 0.6 2.1
[image:4.595.37.550.76.176.2]Smo: smouldering. Flam:flaming.
Fig. 2.Combined TGA plots for all the samplefilters taken throughout the burning cycle of torrefied wood. The arrow shows the large reduction in the EC with time.
[image:4.595.308.552.364.706.2] [image:4.595.38.280.558.719.2]being 48 ± 10 nm, which is similar to wood (58 ± 10 nm);n-decane soot had smaller diameter particles, namely 37 ± 10 nm.
Py GC-MS analysis was made of these samples collected from euge-nol at heights of 5 and 10 cm above theflame and the results are given in
Fig. 9(a) and (b). It is clear the sample obtained nearer theflame con-tains many eugenol decomposition products but by the time the sam-ples reach 10 cm from theflame only the major species remain.
The most notable difference between the diffusionflame samples and the stove samples is the very high values for EC measured for the soot from the former. In the present configuration with soot samples which remain at an elevated temperature and in an unconstrained
flow of combustion products there is little opportunity for the OC to condense on the soot samples. Consequently the Py-GC-MS are of very small samples and the amount of identifiable material at low tempera-tures desorption is limited, as is seen from the Py-GC-MS.
A major issue is the choice of the desorption temperature used for the Py-GC-MS studies. The soots derived from the wood burning stove contained high levels of methoxyphenols and dimethoxyphenols at py-rolysis temperature of 400 °C (cfFig. 8). These species are associated with the lignin part of the wood structure. These phenolic species were present at 500 °C but by 600 °C mainly aromatics were seen for the same sample. Song and Peng[31]used a pyrolysis temperature of up to 700 °C to investigate soots and charcoals, concluding that the higher temperatures were most appropriate andfinding that the prod-ucts were dominated by aromatic compounds. They also found oxygen -containing pyrolytic products in all the samples analysed, but suggested that these arose from thermal decomposition of the carbonaceous solid particles.
4. Discussion
4.1. Factors determining the ratio of EC/TC
Because of the importance of black carbon and organic carbon in at-mospheric chemistry a number of test protocols have been established initially based on emissions from diesel engines[23]. In the present studies single batch combustion of biomass has been adopted and it is seen fromFigs. 3 and 4that both the organic and inorganic emissions vary considerably with time. This can occur in a continuouslyfired unit although the effect would be less pronounced. The relative propor-tions of elemental carbon (EC) and co-emitted organic carbon (OC) de-pend on the nature of the combustion phase,flaming or smouldering.
A main issue is the amount of OC associated with the soot particle. This will contain some PAH species involved in the growth of the soot particle as well as adsorbed volatile components from the surrounding gases, the latter is very much dependent on the temperature time histo-ry of the soot particle. The measured OC also depends on the method in which it is determined particularly thefilter temperature and tempera-ture at which it is desorbed for examination. The soot collected from the diffusionflames of model pyrolysis compounds onto a deposition plate at a temperature of about 200 °C contain very little OC (cfTable 1). This is in agreement with earlier work with sooting laminar ethene-air
flames[37]that showed there was little OC deposited on heated plates but by using water-cooled plates there was a considerable deposition of PAH and other hydrocarbon species. Results obtained by Ferge et al.[26]
who used an ATOFMS are in good agreement with those presented here: for instance, hydrocarbon diffusionflames had an EC/TC ranging between 79.9 and 94.4. Maricq[38]found similar results from hydrocar-bon diffusionflames.
In our previous work we used an ATOFMS for investigation of EC/TC ratio in both eugenol and n-decane soot using the method of Ferge et al.
[26]and found that samples of postflame gases gave EC/TC values of 0.52 ± 6 and 0.88 ± 5 respectively. Using the same technique values have also obtained for burning wood. For softwood pine, these values were: 0.61 duringflaming combustion and 0.62 during smouldering combustion. Similarly EC/TC values for burning willow were 0.50 for
flaming combustion and 0.65 for smouldering combustion[8]. In all these experiments the samples were taken to the ATOFMS through a sampling probe at about 100 °C.
The emissions factors for EC and OC reported in this study are within the ranges reported for a traditional log wood stove[6]. This study re-ported flaming phase emissions factors for BC and OC as 72 ± 66 mg MJ−1and 14 ± 10.5 mg MJ−1respectively; comparable to 30–
46 mg MJ−1and 17–40 mg MJ−1respectively in this study for the two wood fuels. The difference in values reflects the importance of combus-tion condicombus-tions and also the variability in EC and OC between biomass fuels. This has also been found in other studies[6]. Schmidl et al.[19]
looked at the composition of soot from different types of woods using
Fig 4.Inorganic content collected in in thefilters (mg/Nm3
[image:5.595.48.289.53.219.2]) as a function of time for Wood A (fuel 7), Wood B (fuel 8), Torrefied wood (fuel 9), Coal (fuel 10) and Smokeless Fuel (fuel 11).
[image:5.595.135.467.583.729.2]direct sampling from theflue gases. The EC/TC values reported were in the range of 0.15–0.30 for the woods (larch, spruce, beech and oak) and 0.43 for the briquettes. The high OC fraction suggests poor combustion conditions, the higher values for briquettes were attributed to their dis-integration under burning conditions giving better access to air. These values are similar to those obtained here during the different combus-tion stage and are given inTable 2. Peat combustion was associated with the highest average OC emission factor, 84 mg MJ−1. This is
consis-tent with thefindings of Pokhrel et al.[7].
Some extremely detailed studies have been undertaken recently by the Zimmerman group[11,20]and by Calvo et al.[39]using a dilution tunnel methods and the soot samples were collected on unheatedfi l-ters. Generally their results for a number of woods are consistent with those found here given inTable 2for theflaming phases. Chen et al.
[40]have made measurements using similar methods from coal com-bustion infixed beds and found that EC/TC has a value about 0.75 for bi-tuminous coals and 0.44 for anthracite (a low volatile‘smokeless’fuel). These values follow the same trends as those given inTable 2although it should be noted that with a dilution tunnel the cooling time-tempera-ture history of the soot particle is determined by mixing patterns during the dilution process. This is of importance where standard test methods
are used to collect particulate. The Ecodesign regulations 2015/1185 implementing Directive 2009/125/EC allow three different methods to be used to measure particulate emissions from solid fuel space heaters. These include measurement directly in theflue using a heatedfilter; measurement over the full burn cycle using a dilution tunnel; and mea-surement over a 30 min period using afilter at ambient temperature or an electrostatic preciptitor. Although each method has it's own specific requirements, the results of this study suggest that thefirst and third methods may underestimate the OC fraction if sampling is carried out only at high temperatures, or only during theflaming phase.
4.2. Chemical composition of soot pyrolysis products
In this work it was observed that the graph of weight loss against time/temperature for the multifuel soot had three types of region: an initial low-temperature region in which, a second, generally more ex-tensive section; and afinal rapid weight loss during oxidation in air. These correspond to the three types of material which were identified by Ross et al.[25]as constituents of soot or BC: weakly-bound material, easily thermally desorbed, and extractable by solvents; more strongly-bound material less easily desorbed; andfinally highly developed soot
Inorganic analysis of the two soot deposit samples (mg kg−1).
No Sample K Na Fe Mn Ca Al Cu Zn Mg Pb Ti
1 Multi-fuel stove, chimney deposit
7317 8459 5435 296 8505 6957 293 2368 350 14
2 Wood Stove, chimney deposit
[image:6.595.38.550.76.130.2]5215 1500 8897 941 14,169 1647 76 403 1923 357 2
[image:6.595.81.507.383.716.2]which is burned in thefinal phase of the TGA. In the case of biomass combustion the weakly bound constituents consist of the lower MW PAH soot precursors which arise from the early products of soot growth such as naphthalene and anthracene which are volatile and easily lost
[25,41]. The major components are those from the decomposition of cellulose such as oligosaccharides, levoglucosan and furfural; and from the decomposition of the sugars and lignin such as eugenol may be con-verted into marker compounds. Any differences between the soots lie in the relative amounts of different products, the sampling method and analytical method employed. Further weight loss regions then arise from the desorption of higher MW analogues involved in the soot forming routes.
4.3. The inorganic components
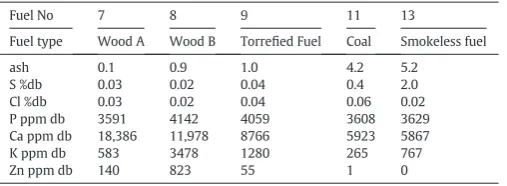
The inorganic components of the fuels examined are given inTable 4
which is taken from[15]. The relationship between the experimentally determinedflue gas contents and the initial fuel composition is com-plex. Coal gave the highest amount of inorganic material which is great-er than that from Woods A and B whilst the lowest are the torrefied and smokeless fuels. The coal is expected to give a high level because of the high ash content, the woods have a lower ash content. The torrefied fuel has a similar ash content to the woods but it has a lower potassium con-tent. The smokeless fuel surprisingly gives the lowest level of inorganic content in theflue gases despite a high ash content and high levels of all the metals. This presumably arises from the fact that smokeless fuel is thermally pre-treated and this process binds the inorganic species to the largely carbonaceous char matrix. However if the data are consid-ered on an emission/MJ basis the results show that the emissions from the woods are similar to the coal whilst the torrefied wood and the smokeless fuels are lower. In comparison to the‘real life’wood stove soot deposits, the Multi-fuel stove soot deposits were higher in sodium, aluminium, titanium and magnesium. However zinc and calcium were approximately twice as high in the wood stove soot sample.
5. Conclusions
[image:7.595.46.291.54.237.2]Measurements were made of the emissions of OC, EC and EC/TC resulting from the combustion of a number of fuels in afixed bed do-mestic stove. There are considerable differences between fuels with the smokeless fuels and torrefied wood giving lower levels of total EC and OC. Average EC/TC ratios for wood logs, torrefied briquettes, coal
Fig. 7.Py-GC-MS chromatogram of compounds desorbed at 300 °C from: (a), black smoke. Key: 1. levoglucosan; 2: 1.6 anhydro-alpha-D-glucofuranose; 3; tetrabenzyl glucose; 4; methoxy eugenol; 5: kauran (diterpenoid alcohol); 7: cyclohexane, 1-(1-tetradecylpentadecyl)-; and (b), brown smoke. Key: 1. 1-(4-hydroxy-3-methoxyphenyl)-2-propanone; 2. alpha-D-glucopyranose; 3. levoglucosan; 4. 4-ethoxymethyl-2-methoxyphenol; 5. unidentified; 6. 1, 6 anhydro-alpha-D-glucofuranose; 7,8, methoxy eugenol; 9, 3-hexenoic acid; 10, naphthalenone (or dihydroxynaphthalene).
[image:7.595.45.291.390.694.2]Fig. 8.Py-GC-MS chromatograms of soot from the multi-fuel stove at:(a)400 °C; 1. 3–10 alkanes; 2. phenanthrene;(b)500 °C; 1. phenol ; 2. methyl phenols; 3. dimethyl phenols; 4.fluoranthene; 5. pyrene; 6. unknown; 7–10, alkanes; (c) 600 °C; 1. toluene; 2, phenol; 3. methyl phenols; 4. dimethyl phenols; 5. methylnapthalenes, 6. dimethyl naphthalenes; 7. napthalenol.
[image:7.595.311.559.472.683.2]and smokeless fuel were 0.46, 0.37, 0.62 and 0.23 respectively. Coal soot showed the highest EC/TC. Combustion conditions were also found to be a key variable, whereby the EC/TC ratio is a function of whether it isflaming or smouldering combustion. For the wood fuels, the EC/TC ratio was 3–5 times lower during the smouldering phase than thefl am-ing phase. The inorganic components of the particulate were dependent on the fuel as well as the combustion conditions. Analysis of the OC composition of all three categories of soot samples was carried out by pyrolysis GC-MS. A significantly higher levoglucosan response was ob-served in the brown carbon from wood soot.
The chimney soot deposit sample from the‘real life’wood stove showed similar pyrolysis products. Soots collected from the combustion of biomass model compounds had very low OC content, with EC/TC ra-tios ranging from 0.95 to 0.99.
Acknowledgements
We acknowledge support from the Supergen Bioenergy Hub (EP/ J017302) and the EPSRC Centre for Doctorial Training in Energy: Tech-nologies for a Low Carbon Future (EP/G036608). We acknowledge sup-port from the TETFUND under KSUSTA, Nigeria. We wish to thank Mr. E Woodhouse for technical assistance.
References
[1] IPCC, 2013: Climate Change 2013: The Physical Science Basis. Contribution of Working Group I to the Fifth Assessment Report of the Intergovernmental Panel on Climate Change [Stocker, T.F., D. Qin, G.-K. Plattner, M. Tignor, S.K. Allen, J. Boschung, A. Nauels, Y. Xia, V. Bex and P.M. Midgley (eds.)]. Cambridge University Press, Cambridge, U K and New York, USA.
[2] T.C. Bond, S.J. Doherty, D.W. Fahey, P. Forster, T. Berntsen, et al., Bounding the role of black carbon in the climate system. A scientific assessment, J. Geophys. Res. Atmos. 118 (2013) 5380–5552.
[3] O. Hodnebrog, G. Myhre, B.H. Samset, How shorter black carbon lifetime alters its climate effect, Nat. Commun. 5 (2014) (article no.5065).
[4] J.G. Watson, J.C. Chow, L.W.A. Chen, Summary of organic and elemental carbon/ black carbon analysis methods and intercomparisons, Aerosol Air Qual. Res. 5 (1) (2005) 65–102.
[5] A. Laskin, J. Laskin, S.A. Nizkorodov, Chemistry of atmospheric brown carbon, Chem. Rev. 115 (2015) 4335–4382.
[6] M.F. Heringa, P.F. DeCarlo, R Chirico, T. Tritscher, J. Dommen, E. Weingartner, R. Richter, G. Wehrle, A.S.H. Prévôt, U. Baltensperger, Investigations of primary and secondary particulate matter of different wood combustion appliances with a high-resolution time-of-flight aerosol mass spectrometer, Atmos. Chem. Phys., 11, 5945–5957.
[7] R.P. Pokhrel, N.L. Wagner, J.M. Langridge, D.A. Lack, T. Jayarathne, E.A. Stone, C.E. Stockwell, R.J. Yokelson, S.M. Murphy, Parameterization of Single Scattering Albedo (SSA) and Absorption Angstrom Exponent (AAE) with EC/OC for Aerosol Emissions from Biomass Burning, Atmos. Chem. Phys. Discuss. (2016),http://dx.doi.org/10. 5194/acp-2016-184.
[8] A.K. Bolling, J. Pagels, K.E. Yttri, L. Barregard, G. Sallsten, P.E. Schwarze, C. Boman, Health effects of residential wood smoke particles: the importance of combustion conditions and physicochemical particle properties, Part. Fibre Toxicol. 6 (2009) 29.
[9] B. Dellinger, W.A. Pryor, B. Cueto, G.L. Squadrito, W.A. Deutsch, The role of combus-tion-generated radicals in the toxicity of PM2.5, Proc. Combust. Inst. 28 (2000) 2675–2681.
[10] J. Leskinen, J. Tissari, O. Uski, A. Virén, T. Torvela, T. Kaivosoja, H. Lamberg, I. Nuutinen, T. Kettunen, J. Joutsensaari, P.I. Jalava, O. Sippula, M.-R. Hirvonen, J. Jokiniemi, Fine particle emissions in three different combustion conditions of a wood chip-fired appliance - Particulate physico-chemical properties and induced cell death, Atmos. Environ. 86 (2014) 129–139.
Salas, R. Zimmermann, Comparison of emissions from wood combustion. Part 2: Impact of combustion conditions on emission factors and characteris-tics of particle-bound organic species and polycyclic aromatic hydrocarbon (PAH)-related toxicological potential, Energy Fuel 27 (2013) 1482–1491. [12]Z. Chafe, M. Brauer, M. Héroux, Z. Klimont, T. Lanki, R.O. Salonen, K.R. Smith,
Resi-dential Heating with Wood and Coal: Health Impacts and Policy Options in Europe and North America, Denmark, World Health Organisation (WHO), Copenhagen, 2015.
[13] M. Frenklach, H. Wang, in: H. Bockhorn (Ed.), Soot Formation in Combustion: Mechanisms and Models, Springer−Verlag, Berlin 1994, pp. 162–192. [14] M.B. Colket, R.J. Hall, in: H. Bockhorn (Ed.), Soot Formation in Combustion:
Mecha-nisms and Models, Springer−Verlag, Berlin 1994, pp. 442–470.
[15] E. Ranzi, Detailed kinetics of real fuel combustion: main paths to benzene and PAH formation, in: H. Bockhorn, et al., (Eds.), Combustion Generated Fine Carbonaceous Particles, Ed KIT Scientific Publishing, Kahlsruhr 2009, pp. 99–124.
[16] K.O. Johansson, J.Y.W. Lai, S.A. Skeen, D.M. Popolan-Vaida, K.R. Wilson, N. Hansen, A. Violi, H.A. Michelsen, Soot precursor formation and limitations of the stabilomer grid, Proc. Combust. Inst. 35 (2015) 1819–1826.
[17]E.M. Fitzpatrick, J.M. Jones, M. Pourkashanian, A.B. Ross, A. Williams, K.D. Bartle, Mechanistic aspects of soot formation from the combustion of pine wood, Energy Fuel 22 (2008) 3771–3778.
[18] E.M. Fitzpatrick, J.M. Jones, M. Pourkashanian, A.B. Ross, A. Williams, K.D. Bartle, K. Kubica, The mechanism of the formation of soot and other pollutants during the co-firing of coal and pine wood in afixed-bed combustor, Fuel 88 (2009) 2409.
[19] C. Schmidl, I.L. Marr, A. Caseiro, P. Kotianova, A. Berner, H. Bauer, A. Kasper-Giebl, H. Puxbaum, Chemical characterisation offine particle emissions from wood stove combustion of common woods growing in mid-European Alpine regions, Atmos. Environ. 42 (2008) 126–141.
[20] M. Elsasser, C. Busch, J Orasche, C. Schön, H. Hartmann, J. Schnelle-Kreis, R. Zimmermann, Dynamic Changes of the Aerosol Composition and Concentration during Different Burning Phases of Wood Combustion, Energy Fuel 27 (2013) 4959–4968. [21] P. Sommersacher, T. Brunner, I. Obernbergee, Fuel indexes: A novel method for the
evaluation of relevant combustion properties of new biomass fuels, Energy Fuel 26 (2012) 380–390.
[22]E.J.S. Mitchell, A.R. Lea-Langton, J.M. Jones, A. Williams, P. Layden, R. Johnson, The impact of fuel properties on the emissions from the combustion of biomass and other solid fuels in afixed bed domestic stove, Fuel Proc. Technol. 142 (2016) 115–123. [23] M.E. Birch, R.A. Cary, Elemental carbon-based method for monitoring occupa-tional exposures to particulate diesel exhaust, Aerosol Sci. Technol. 25 (1996) 221–241.
[24] T. Ahmed, V.A. Dutkiewicz, A. Shareef, G. Tuncel, S. Tuncel, L. Husain, Measurement of black carbon (BC) by an optical method and a thermal-optical method: intercom-parison for four sites, Atmos. Environ. 43 (2009) 6305–6311.
[25] A.B. Ross, S. Junyapoon, J.M. Jones, A. Williams, K.D. Bartle, A study of different soots using pyrolysis–GC–MS and comparison with solvent extractable material, J. Anal. Appl. Pyrolysis 74 (2005) 494–501.
[26] T. Ferge, E. Karg, A. Schroppel, K.R. Coffee, H.J. Tobias, M. Frank, E.E. Gard, R. Zimmermann, Fast determination of the relative elemental and organic carbon con-tent of aerosol samples by on-line single- particle aerosol time-of-flight mass spec-trometry, Environ. Sci. Technol. 40 (2006) 3327–3335.
[27] J.M. Wilson, M.T. Baeza-Romero, J.M. Jones, M. Pourkashanian, A. Williams, A.R. Lea-Langton, A.B. Ross, K.D. Bartle, Soot formation from the combustion of biomass pyrolysis products and a hydrocarbon fuel, n-ecane: An aerosol time offlight mass spectrometer (ATOFMS) study, Energy Fuel 27 (2013) 1668–1678.
[28] A.R. Lea-Langton, M.T. Baeza-Romero, G.V. Boman, B. Brooks, A.J.M. Wilson, F. Atiku, K.D. Bartle, J.M. Jones, A. Williams, A study of smoke formation from wood combus-tion, Fuel Process. Technol. 137 (2015) 327–332.
[29] M.L. Botero, S. Mosbach, M. Kraft, Sooting tendency of paraffin components of diesel and gasoline in diffusionflames, Fuel 126 (2014) 8–15.
[30] R.J. Watson, M.L. Botero, C.J. Ness, N.M. Morgan, M. Kraft, An improved methodology for determining threshold sooting indices from smoke point lamps, Fuel 111 (2013) 120–130.
[31]J. Song, P. Peng, Characterisation of black carbon materials by pyrolysis–gas chromatography–mass spectrometry, J. Anal. Appl. Pyrolysis 87 (2010) 129–137.
[32] L. Huang, J.R. Brook, W. Zhang, S.M. Li, L. Graham, D. Ernst, D.,.G. Lu, Stable isotope measurements of carbon fractions (OC/EC) in airborne particulate: A new dimen-sion for source characterization and apportionment, Atmos. Environ. 40 (2006) 2690–2705.
[33] A. Dufour, P. Girods, E. Masson, S. Normand, Y. Rogaume, A. Zoulalian, Comparison of two methods of measuring wood pyrolysis tar, J. Chromatogr. A 1164 (2007) 240–247.
[34] J. Hilbers, Z. Wang, B. Pecha, R.J.M. Westerhof, S.R.A. Kersten, M.R. Pelaez-Samaniegoa, M. Garcia-Pereza, Cellulose-lignin interactions during slow and fast pyrolysis, J. Anal. Appl. Pyrol. 114 (2015) 197–207.
[35] D. Shen, R. Xiao, S. Gu, H. Zhang, The overview of thermal decomposition of cellulose in lignocellulosic biomass, in: T. van der Ven, J. Kadla, Intech (Eds.),Cellulose-Biomass Conversion, 2013,http://dx.doi.org/10.5772/51883.
[36] K.D. Bartle, J.M. Jones, A.R. Lea-Langton, M. Pourkashanian, A.B. Ross, J.S. Thillaimuthu, P.R. Waller, A. Williams, The combustion of droplets of high-asphaltene heavy oils, Fuel 103 (2013) 835–842.
[37] J.M. Smedley, A. Williams, D. Hainsworth, Soot and carbon deposition mechanisms in ethene/airflames, Fuel 74 (1995) 1753–1761.
Inorganic content of the sampled samples (from[15]).
Fuel No 7 8 9 11 13
Fuel type Wood A Wood B Torrefied Fuel Coal Smokeless fuel
ash 0.1 0.9 1.0 4.2 5.2
S %db 0.03 0.02 0.04 0.4 2.0
Cl %db 0.03 0.02 0.04 0.06 0.02
P ppm db 3591 4142 4059 3608 3629
Ca ppm db 18,386 11,978 8766 5923 5867
K ppm db 583 3478 1280 265 767
[image:8.595.35.289.76.169.2][38] M.M. Maricq, Examining the relationship between black carbon and soot inflames and engine exhaust, Aerosol Sci. Tech. 48 (2014) 620–629.
[39] A.I. Calvo, V. Martins, T. Nunes, M. Duarte, R. Hillamo, K. Teinila, V. Pont, A. Castro, R. Fraile, L. Tarelho, C. Alves, Residential wood combustion in two domestic devices: Relationship of different parameters throughout the combustion cycle, Atmos. Envi-ron. 116 (2015) 72–82.
[40] Y. Chen, C. Tian, Y. Feng, G. Zhi, J. Li, Gan Zhang Measurements of emission factors of PM 2.5, OC, EC, and BC for household stoves of coal combustion in China, Atmos. En-viron. 109 (2015) 190–196.