RESEARCH NOTE
RepViz: a replicate-driven R tool
for visualizing genomic regions
Thomas Faux
1*, Kalle T. Rytkönen
1,2, Asta Laiho
1and Laura L. Elo
1*Abstract
Objective: Visualization of sequencing data is an integral part of genomic data analysis. Although there are several tools to visualize sequencing data on genomic regions, they do not offer user-friendly ways to view simultaneously different groups of replicates. To address this need, we developed a tool that allows efficient viewing of both intra- and intergroup variation of sequencing counts on a genomic region, as well as their comparison to the output of user selected analysis methods, such as peak calling.
Results: We present an R package RepViz for replicate-driven visualization of genomic regions. With ChIP-seq and ATAC-seq data we demonstrate its potential to aid visual inspection involved in the evaluation of normalization, out-lier behavior, detected features from differential peak calling analysis, and combined analysis of multiple data types. RepViz is readily available on Bioconductor (https ://www.bioco nduct or.org/packa ges/devel /bioc/html/RepVi z.html) and on Github (https ://githu b.com/elola b/RepVi z).
Keywords: Visualisation, Genome analysis, Computational genomics, Epigenetics
© The Author(s) 2019. This article is distributed under the terms of the Creative Commons Attribution 4.0 International License (http://creativecommons.org/licenses/by/4.0/), which permits unrestricted use, distribution, and reproduction in any medium, provided you give appropriate credit to the original author(s) and the source, provide a link to the Creative Commons license, and indicate if changes were made. The Creative Commons Public Domain Dedication waiver (http://creativecommons.org/ publicdomain/zero/1.0/) applies to the data made available in this article, unless otherwise stated.
Introduction
DNA-sequencing has become an essential part of bio-medicine and biology. Several computational tools have been developed for analyzing such data. However, a vis-ual inspection of the data by a researcher is still impor-tant both at the level of basic quality control and as a confirmation of the analysis results. Visualization can also guide the analysis design and interpretation of the results. Numerous tools have been developed to visual-ize genomic data, including UCSC genome browser [1], Integrative Genomics Viewer (IGV) [2], or BamView [3]. Additional tools are available in R such as ggbio [4], Gen-VisR [5], Gviz [6], rbamtools [7], Sushi [8]. Other R tools like Genomation [9] and ChIPpeakAnno [10] enable the visualization of the genome by taking the average of mul-tiple regions or via a heatmap, but lack the resolution of read coverage. Altogether, there is still a demand for a specific tool to efficiently visualize groups of biological replicates at specific genomic locus.
Currently, genomic visualization of the sequencing data is especially important in the analysis of chromatin data, such as ChIP-seq and ATAC-seq. Specific histone modi-fication markers with distinct dynamics require custom parameterization in calling the differential signal and, therefore, constitute a more complex situation compared to, for example, RNA-seq analysis [11, 12]. Accordingly, the selection of a proper peak calling or differential peak calling tool and parameters for specific histone modifica-tion markers is often a complex and iterative process in which visualization has an important role. Visualization of the intragroup replicates can be used to check if the assumptions of a given differential peak caller are met with the analyzed data. Additionally, visualization of the replicates can guide the evaluation of the normalization steps [13, 14] and identification of potential outliers.
In an effort to provide a user-friendly tool to visualize groups of replicates on genomic regions, we propose a replicate-driven R tool, RepViz. RepViz allows simulta-neous viewing of both intra- and intergroup variation in sequencing counts of the studied conditions, as well as their comparison to the output features (e.g. identified peaks) from user selected analysis methods. The RepViz tool is primarily designed for chromatin data, such as
Open Access
*Correspondence: [email protected]; [email protected]
1 Turku Bioscience Centre, University of Turku and Åbo Akademi
University, Tykistökatu 6, 20520 Turku, Finland
ChIP-seq and ATAC-seq, but can also be used with other sequencing data, such as RNA-seq, or combinations of different types of genomic data.
Implementation
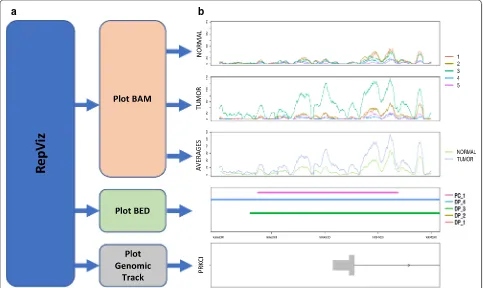
RepViz is implemented in R and can run on both MacOS, Windows, and Linux. The tool uses comma-separated value (CSV) files as an input and is easy to use. RepViz is divided into three main functions that produce the visual outputs (Fig. 1a). The first function visualizes Binary Alignment Map (BAM) data. In the visualiza-tion, the samples are organized by group and the differ-ent replicates are color-coded; an additional visualization is produced for the group averages (Fig. 1b, three upper panels). The second function enables the visualization of Browser-Extensible Data (BED) files, such as peaks detected by a peak calling software. This enables soft-ware comparison or replicate comparison after individual peak calling (Fig. 1b, fourth panel). The third function is for visualizing the genomic track. The default input
consists of two CSV files: one related to the BAM files and another optional file related to the BED files (Fig. 1b, lower panel).
Main text
Data processing, peak calling and differential peak calling
We tested RepViz with public data from GEO and using available tools for peak calling and differential peak call-ing. Details of the sequencing data used in the examples are provided in Additional file 1: Table S1, and details of the peak caller and differential peak callers are provided in Additional file 1: Table S2. The quality of the sequenc-ing data was assessed with FastQC (http://www.bioin forma tics.babra ham.ac.uk/proje cts/fastq c) and the fastq files were aligned against reference genome (mm10 and hg19 according to cases) with Bowtie 2 (2.2.6) [15]. The peaks were called using MACS2 (2.1.1) [16] with the parameters–broad–nomodel -q 0.05. The differential peak callers can be roughly divided in two categories: the one step methods (PePr [17], THOR [14] and dif-fReps [18]) that use their own peak callers and the two
a b
Fig. 1 Overview and biological case examples of RepViz using histone modification data. a Overview of the main functions implemented in the
software. b Example of a promoter region marked by H3K27Ac (GSE85467), where the mean signal in the second biological condition is driven
[image:2.595.57.540.370.658.2]step method (DiffBind [19]) that requires an external peak caller. For DiffBind we used the peaks called with MACS2. The differential peak calling was done with the default settings of the software cited in Additional file 1: Table S2. To emphasize that the scope of this study is the visualization tool the differential peak callers were ran-domly numbered in the examples.
Results and discussion
Our R tool, RepViz, enables the user to take a snapshot of a defined genomic region with multiple data inputs and visualize it in an efficient manner. Unlike the com-monly used visualization tools, it implements a replicate-driven approach, allowing user-friendly visualization of replicates within and between experimental conditions. Here we provide examples on how RepViz can aid visual inspection involved in the evaluation of outlier behav-ior, normalization, differential peak calling analysis and combined analysis of multiple data types. Details of the sequencing data, peak calling and differential peak calling used in the examples are provided in Additional file 1.
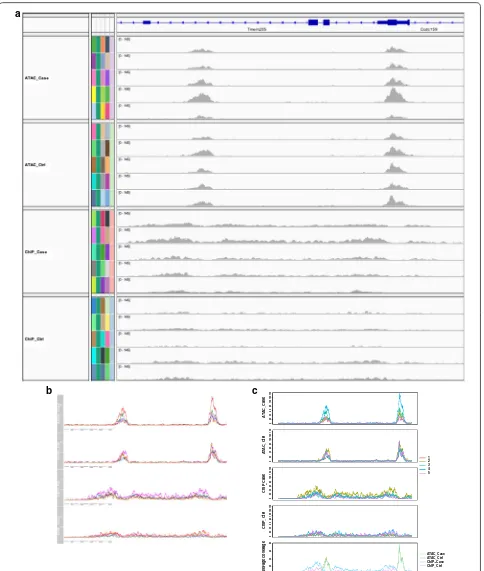
The first function of RepViz visualizes BAM files by presenting all the replicates on the same scale as well as their group-wise averages. This can be used to assess the similarity between the replicates within a given biologi-cal condition, or if the average signal is affected by outli-ers (Fig. 1b). The replicate-driven visualization is also a useful confirmatory step for normalization, enabling for instance, comparison of replicates after normalization at known house-keeping genes (Additional file 1: Fig. S1). With the current genomic browsers, this type of visuali-zation can be a time-consuming task. For instance, IGV does not have an option to group tracks leading to the replicates being stacked on top of each other, whereas Gviz has an option to group samples together but does not allow comparing groups with a different number of grouped replicates (see Fig. 2 for more details of the comparison).
The second function of RepViz visualizes multiple BED files, which can help, for instance, to compare different
peak calling software. By comparing the called peaks to the observed data for each replicate (BAM) the user can visually confirm the called features (Fig. 1b, Additional file 1: Fig. S2). For example, in the case of ChIP-seq stud-ies, differential peak calls can be easily inspected in the light of replicate behavior, and peak calls that are driven by outliers can be detected (Fig. 1b). Additionally, the tool allows a replicate-driven inspection of the length of the called peak. This is useful because several peak callers tend to combine clusters of sharp peaks to broader peaks [11, 12]. Finally, the third function of RepViz visualizes the gene track to display the genes in the region of inter-est, such as gene promoters or their vicinity.
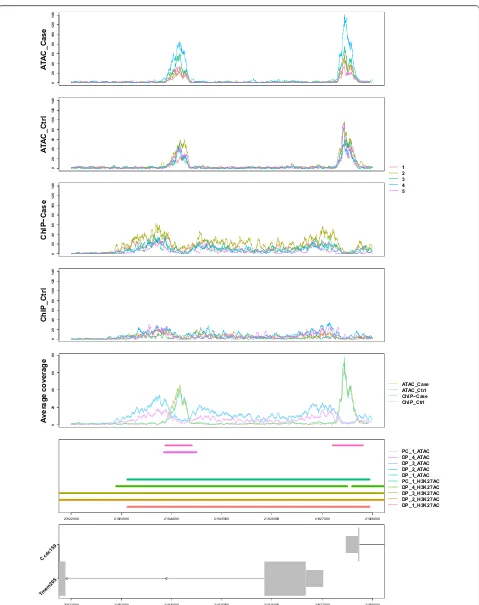
In addition to visualizing replicates within a particu-lar data type, RepViz can visualize multiple data types (datasets) simultaneously by considering each dataset as a separate group in the input file. With multiple matched datasets, the replicate-driven visual inspection can be useful for both evaluating the quality of the samples as well as assessing the performance of the differential peak calling methods between datasets with different dynam-ics (Additional file 1: Fig. S3). Moreover, a combined visu-alization of matched histone marker and ATAC-seq data can provide replicate specific insights for the relationship of histone modification and open chromatin state (Fig. 3). Other potential applications of RepViz include, for exam-ple, the combination of chromatin marker or ATAC-seq data with eRNA [20] or non-coding RNA data to inspect replicate variability on chromatin level together with RNA expression variability at specific genomic regions. RepViz will be actively maintained and further developed.
Limitations
0
20
40
60
80
10
01
20
14
0
ATA
C_Case
02
04
06
08
01
00
12
01
40
ATA
C_Ctrl
02
04
06
08
01
00
12
01
40
ChIP
Case
02
04
06
08
01
00
12
01
40
ChIP_Ctr
l
02
04
06
08
0
Av
erage co
verag
e
1 2 3 4 5
ATAC_Case ATAC_Ctrl ChIP Case ChIP_Ctrl
a
b c
Fig. 2 Comparison of (a) IGV, (b) Gviz, and (c) RepViz. IGV does not allow grouping of replicates to be presented in one track. With Gviz showing replicates in one track is possible, but it is not possible to compare a different number of grouped replicates to each other or include the average coverage under the grouped tracks like in RepViz. Data from GSE108990. Panels from the top to bottom are ATAC-seq case, ATAC-seq control,
[image:4.595.58.542.86.657.2]02
04
06
08
01
00
120
140
AT
AC
_Case
02
04
06
08
01
00
120
140
AT
AC
_Ctr
l
02
04
06
08
01
00
120
140
ChIP−Cas
e
02
04
06
08
0
100
120
140
ChIP_Ctr
l
02
04
06
08
0
Average co
verag
e
21922000 21923000 21924000 21925000 21926000 21927000 21928000
21922000 21923000 21924000 21925000 21926000 21927000 21928000
Tmem20 5 Ccdc159
1 2 3 4 5
ATAC_Case ATAC_Ctrl ChIP−Case ChIP_Ctrl
PC_1_ATAC DP_4_ATAC DP_3_ATAC DP_2_ATAC DP_1_ATAC PC_1_H3K27AC DP_4_H3K27AC DP_3_H3K27AC DP_2_H3K27AC DP_1_H3K27AC
Fig. 3 Example of a combined visualization of ATAC-seq and H3K27ac histone modification marker using replicate matched data. PC peak caller, DP
[image:5.595.59.538.83.688.2]Additional file
Additional file 1. The file contains additional tables and additional figures.
Abbreviations
BAM: binary alignment map; BED: browser extensible data; CSV: coma-separated value; DNA: deoxyribonucleic acid; RNA: ribonucleic acid; eRNA: enhancer RNA; ATAC-seq: assay for transposable accessible chromatin sequencing; ChIP-seq: chromatin immuno-precipitation sequencing; RNA-seq: RNA sequencing.
Acknowledgements
We thank our colleagues for testing the software, particularly Tapio Envall, Mehrad Mahmoudian and Johannes Smolander.
Authors’ contributions
TF implemented the software and wrote the manuscript. KTR provided biological insight and wrote the manuscript. AL and LLE supervised the work and contributed in manuscript writing. All authors read and approved the final manuscript.
Funding
TF was funded by the European Union’s Horizon 2020 research and innovation programme ENLIGHT-TEN under the Marie Sklodowska-Curie Grant Agree-ment No.: 675395. LLE reports grants from the European Research Council ERC (677943), European Union’s Horizon 2020 research and innovation programme (675395), Academy of Finland (296801, 304995, 310561 and 313343), Juvenile Diabetes Research Foundation JDRF (2-2013-32), Tekes—the Finnish Funding Agency for Innovation (1877/31/2016) and Sigrid Juselius Foundation, that also supported KTR and AL during the conduct of the study. Turku Graduate School (UTUGS) also supported this work. Our research is also supported by University of Turku, Åbo Akademi University, Biocenter Finland and ELIXIR Fin-land node. The funding bodies had no role in the design of the study and data collection, analyses and interpretation of data or in writing of the manuscript.
Availability of data and materials
The datasets supporting the conclusions of this article are available in the Gene Expression Omnibus data-base, [Accession Number: GSE85467; https :// www.ncbi.nlm.nih.gov/geo/query /acc.cgi?acc=GSE85 467, GSE108990; https ://www.ncbi.nlm.nih.gov/geo/query /acc.cgi?acc=GSE10 8990].
Software information: Project Name: RepViz. Project home page: http://bioco nduct or.org/packa ges/devel /bioc/html/RepVi z.html.
Archived version: v1.0.0. Operating system(s): Platform independent. Program-ming language: R.
Other Requirements: Not Applicable. License: GPL-3.
Ethics approval and consent to participate
Not applicable.
Consent for publication
Not applicable.
Competing interests
The authors declare that they have no competing interests.
Author details
1 Turku Bioscience Centre, University of Turku and Åbo Akademi University,
Tykistökatu 6, 20520 Turku, Finland. 2 Institute of Biomedicine, Research Centre
for Integrative Physiology and Pharmacology, University of Turku, Kiinamyl-lynkatu 10, 20014 Turku, Finland.
Received: 24 May 2019 Accepted: 12 July 2019
References
1. Kent WJ, Sugnet CW, Furey TS, Roskin KM, Pringle TH, Zahler AM, et al. The human genome browser at UCSC. Genome Res. 2002;12:996–1006. 2. Robinson JT, Thorvaldsdóttir H, Winckler W, Guttman M, Lander ES, Getz
G, et al. Integrative genomics viewer. Nat Biotechnol. 2011;29:24–6. https ://doi.org/10.1038/nbt.1754.
3. Carver T, Harris SR, Otto TD, Berriman M, Parkhill J, McQuillan JA. BamView: visualizing and interpretation of next-generation sequencing read align-ments. Brief Bioinform. 2013;14:203–12.
4. Yin T, Cook D, Lawrence M. ggbio: an R package for extending the gram-mar of graphics for genomic data. Genome Biol. 2012;13:R77. 5. Skidmore ZL, Wagner AH, Lesurf R, Campbell KM, Kunisaki J, Griffith OL,
et al. GenVisR: genomic visualizations in R. Bioinformatics. 2016;32:3012– 4. https ://doi.org/10.1093/bioin forma tics/btw32 5.
6. Hahne F, Ivanek R. Visualizing genomic data using Gviz and biocon-ductor. New York, NY: Humana Press; 2016. p. 335–51. https ://doi. org/10.1007/978-1-4939-3578-9_16.
7. Kaisers W, Schaal H, Schwender H. rbamtools: an R interface to samtools enabling fast accumulative tabulation of splicing events over mul-tiple RNA-seq samples. Bioinformatics. 2015;31:1663–4. https ://doi. org/10.1093/bioin forma tics/btu84 6.
8. Phanstiel DH, Boyle AP, Araya CL, Snyder MP. Sushi. R: flexible, quantitative and integrative genomic visualizations for publication-quality multi-panel figures. Bioinformatics. 2014;30:2808–10.
9. Akalin A, Franke V, Vlahoviček K, Mason CE, Schubeler D. Genomation: a toolkit to summarize, annotate and visualize genomic intervals. Bioinfor-matics. 2015;31:1127–9. https ://doi.org/10.1093/bioin forma tics/btu77 5. 10. Zhu LJ, Gazin C, Lawson ND, Pagès H, Lin SM, Lapointe DS, et al.
ChIPpeakAnno: a Bioconductor package to annotate ChIP-seq and ChIP-chip data. BMC Bioinform. 2010;11:237. https ://doi. org/10.1186/1471-2105-11-237.
11. Tu S, Shao Z. An introduction to computational tools for differential bind-ing analysis with ChIP-seq data. Quant Biol. 2017;5:226–35. https ://doi. org/10.1007/s4048 4-017-0111-8.
12. Steinhauser S, Kurzawa N, Eils R, Herrmann C. A comprehensive comparison of tools for differential ChIP-seq analysis. Brief Bioinform. 2016;17:bbv110. https ://doi.org/10.1093/bib/bbv11 0.
13. Adriaens ME, Prickaerts P, Chan-Seng-Yue M, van den Beucken T, Dahlmans VEH, Eijssen LM, et al. Quantitative analysis of ChIP-seq data uncovers dynamic and sustained H3K4me3 and H3K27me3 modulation in cancer cells under hypoxia. Epigenetics Chromatin. 2016;9:48. 14. Allhoff M, Seré K, Pires FJ, Zenke M, Costa IG. Differential peak
call-ing of ChIP-seq signals with replicates with THOR. Nucleic Acids Res. 2016;44:gkw680. https ://doi.org/10.1093/nar/gkw68 0.
15. Langmead B, Salzberg SL. Fast gapped-read alignment with Bowtie 2. Nat Methods. 2012;9:357–9.
16. Zhang Y, Liu T, Meyer CA, Eeckhoute J, Johnson DS, Bernstein BE, et al. Model-based Analysis of ChIP-Seq (MACS). Genome Biol. 2008;9:R137. 17. Zhang Y, Lin Y-H, Johnson TD, Rozek LS, Sartor MA. PePr: a peak-calling
prioritization pipeline to identify consistent or differential peaks from replicated ChIP-Seq data. Bioinformatics. 2014;30:2568–75.
18. Shen L, Shao N-Y, Liu X, Maze I, Feng J, Nestler EJ. diffReps: detecting dif-ferential chromatin modification sites from ChIP-seq data with biological replicates. PLoS ONE. 2013;8:e65598.
19. Ross-Innes CS, Stark R, Teschendorff AE, Holmes KA, Ali HR, Dunning MJ, et al. Differential oestrogen receptor binding is associated with clinical outcome in breast cancer. Nature. 2012;481:389–93.
20. Azofeifa JG, Allen MA, Hendrix JR, Read T, Rubin JD, Dowell RD. Enhancer RNA profiling predicts transcription factor activity. Genome Res. 2018;28:334. https ://doi.org/10.1101/gr.22575 5.117.
Publisher’s Note