R E S E A R C H A R T I C L E
Open Access
Incorporating work experience of medical
staff into patient safety climate
management: a multi-group analysis
Seung-Hwan Kim
1and Shao-Jen Weng
2,3*Abstract
Background:This study aims to provide insights on how to incorporate the work experience of medical staff into safety climate management based on the relationships among several safety-related constructs such as teamwork climate, working condition, and job satisfaction.
Methods:A cross-sectional study was conducted in a regional hospital in Taichung City, Taiwan using a Safety Attitude Questionnaire (SAQ)-based questionnaire. The relationships among the constructs were modeled by a structural equation model, and a multi-group analysis was performed. Among the employees participating in the survey, only physicians and nurses were considered in the analysis, accounting for 1596 out of 2277 responses. The key measures were the difference between the unconstrained and fully constrained structural models, the statistically different coefficients, and their strengths across the high and low-experience groups.
Results: Our multi-group analysis showed that the effects of management leadership on job satisfaction and of teamwork climate on safety climate were statistically stronger for low-experience medical staff, whereas the effect of working conditions on safety climate was statistically stronger for high-experience medical staff. Conclusions: The findings demonstrate how to incorporate the work experience of medical staff into safety climate management. In summary, by focusing on different safety constructs for the less and more experienced staff—job satisfaction and teamwork climate for the less experienced, working conditions for the more experienced—management may be able to improve the organizational safety climate. Our suggestions in this study can be leveraged, should management implement the initiatives and action plans for safety climate improvement.
Keywords:Work experience, Management leadership, Safety climate, Moderation effect
Background
Safety culture is a set of attitudes and values that the members of an organization adhere to regarding safety [1], whereas safety climate has been viewed as a
snap-shot of safety culture within an organization [1, 2].
Though the culture of an organization is difficult to measure, climate can be measured through quantitative methods; as such, safety climate has been suggested as an effective indicator of the overall safety culture of an
organization [3–5]. There have been many studies that
have linked safety performance with safety climate [6–11], mostly showing that better safety measures were reported in health care organizations with better safety climate.
One of the organizational factors that affects safety cli-mate is work experience. As previously mentioned, safety climate measures the attitudes and values of em-ployees towards safety, and it has been suggested in human resource management literature that work ex-perience influences work-related attitudes, values, and
the performance of employees [12, 13]. Also, it is well
known that doctors and nurses have a strong hierarch-ical culture based on experience and seniority [14, 15]. In safety climate literature, work experience has been demonstrated to have significant associations with atti-tude, performance, and a climate of organizational safety * Correspondence:sjweng@thu.edu.tw
2
Executive Master Program for Health Administration, Tunghai University, Taichung City, Taiwan40704
3Department of Industrial Engineering and Enterprise Information, Tunghai
University, Taichung City, Taiwan40704
Full list of author information is available at the end of the article
in a number of studies [16–20]. Notably, Mark et al. [17] shows that work experiences of nurses affects the safety climate of a hospital more than overall nursing education.
Another critical factor that influences safety climate is
management leadership [7, 21]. It shows how well
man-agers or supervisors lead and support the medical staff in
terms of commitment to safety [22–26]. The impact of
management leadership on safety culture or climate has been well documented in the literature of High Reliability Theory (HRT) and the discipline of human resource man-agement [27–32]. HRT investigates how High Reliability Organizations (HROs)—organizations requiring near error-free operations, such as in construction, aviation, and the
nuclear power industries—manage to maintain such high
reliability in their operations [33]. Numerous safety related studies indicate that the role of management leadership is critical for achieving high levels of safety within organiza-tions [2,27–32,34]. In particular, Flin et al. [2] shows that how management leads and commits to safety is the most consistent factor that shapes the safety climate of a workplace.
The aim of this study is to investigate how management should approach the task of managing safety climate of medical staff differently based on the work experience of the staff. There are several measures that can represent work experience of an employee, and in our study the length of time each medical staff has worked in the current department of a hospital was used. Particularly we focus on how work experiences of nurses and doctors moderate the relationships among the construct of man-agement leadership, other safety-related constructs, and the safety climate of a health care organization.
Research hypothesis
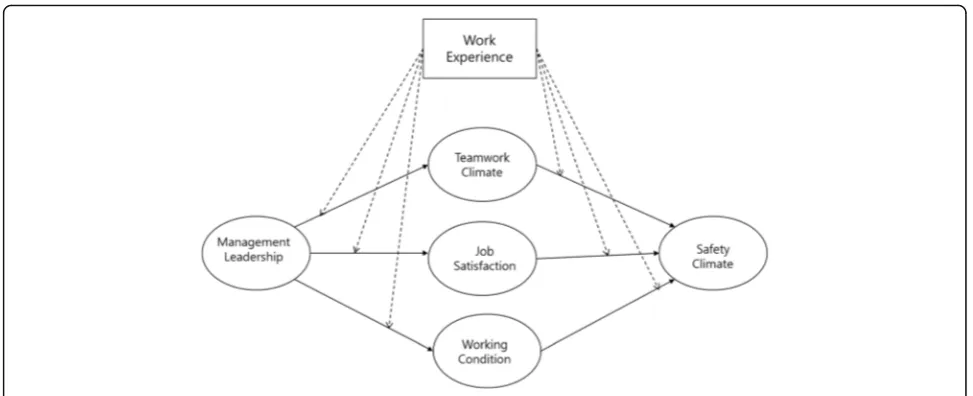
There were two major components to our research hy-pothesis: 1) the mechanism of how management leader-ship affects safety climate through other safety-related constructs; 2) how the work experience of doctors and nurses affects the mechanism. For the first component, initially the research model of our previous work in Weng et al. [21] was extended by incorporating the de-partment experience of medical staff as the moderators of all paths in the structural model. Based on previous studies, our model showed that the safety-related con-structs of teamwork climate, working conditions, and job satisfaction fully mediated the effect of management leadership on the safety climate of a medical staff [17].
For the second component, as mentioned in the background above, it has been shown that work ex-perience is associated with the safety climate of an organization [15–20]. In addition, a number of studies have suggested that the level of work experience may moderate relationships among the perceptions and
attitudes for work-related factors of the employees [35–37]. They indicate that inexperienced employees and those with more experience may show different levels of sensitivity to those relationships among the related factors. The safety-related factors considered in this paper— manage-ment leadership, teamwork climate, job satisfaction, and
working conditions—have been linked with work
experi-ence in the literature. First, Vecchio and Boatwright [38] re-ported that employees with longer job tenure and ones with shorter tenure responded differently regarding their preferences toward management leadership style. Flin et al. [39] and de Wet Carl et al. [40] showed that significant dif-ferences were found in issues related to leadership based on the level of experience. Also, Flin et al. [39], Thomas et al. [41], Kim et al. [42], and de Wet Carl et al. [40] indicated that the perception of the teamwork climate of employees is related to their work experience. For job satisfaction, Spector [43], Mwamwenda [44], and Traut et al. [45] sug-gest that the degree to which people are satisfied with their job may differ based on their length of employment. In terms of working conditions, Cox and Cheyne [46], and Mearns et al. [47] point out that the degree of influence people get from their working environment may vary with respect to their level of experience. Based on the aforementioned literature, this study examined the work experience of medical staff as a moderator in the relationships among management leadership, teamwork climate, job satisfaction, working conditions, and safety climate, and hypothesized that the strength of those relationships would not be the same amongst those with different levels of work experience. By combining
the first and the second components, Fig. 1 presents
the hypothesized model in this study.
Methods
Setting and sample
Our research was performed based on a cross-sectional study conducted at Taichung Veterans General Hospital in Taichung City, Taiwan. This hospital is a 1500-bed hospital with around 3000 employees. At full capacity, about 6000 outpatients are treated every day, with about 130 inpatients and 180 patients in the emergency room. Physicians, nurses, and other employees in the hospital were required to participate in the survey, but not all questions in the survey were suitable for all staff mem-bers. Therefore, we only considered the responses from physicians and nurses (1596 responses out of the total 2277).
Ethical approval
Measures and instruments
We adapted questions from the self-administered Safety Attitude Questionnaire (SAQ) [48] and the new Chinese version of SAQ [49], which have been validated and
widely used in the health care industry [50, 51]. There
are five safety-related constructs in the questionnaire— safety climate, management leadership, teamwork cli-mate, job satisfaction, and working conditions. To meas-ure management leadership, we selected questions from
the “hospital management support” scale developed by
the new Chinese version of SAQ [49] and the dimension of“perception of management”in the original SAQ. The other constructs were measured by adapting questions from the original SAQ [48]. The construct ‘stress recog-nition’in the original SAQ was excluded from our study based on Taylor and Pandian [51], Sexton et al. [48], and Lee et al. [52], which showed stress recognition does not fit into the overall safety climate construct in SAQ. Safety climate reflects the strength of the perception of a strong and proactive organizational commitment to safety [48]. Management leadership assesses the percep-tion of medical staff on how well the managers lead and support the medical staff in terms of commitment to safety [48]. Teamwork climate is the perceived quality of collaboration among personnel [48]. Job satisfaction shows the degree to which employees feel positive about their work experience [48]. Working conditions are de-fined as the perceived quality of the work environment, such as staff training and information support [48]. We chose the tenure in the department, not in the hospital to measure work experience of the medical staff. The reason the tenure in the hospital was not chosen was that the learning status of nurses can be affected by‘job rotation’, which transfers nurses from one department to another. Consequently, we assumed that an employee
with long hospital tenure do not always show higher skill and comfort level on their job. By choosing the depart-ment tenure, we assumed in our study that the length of tenure has a positive linear relationship with the skill and comfort level. The participating physicians and nurses were categorized into two groups based on their ‘ depart-ment work experience’which has seven levels in the ques-tionnaire. In our experiment, the first three levels (Under 6 months, 6–11 months, 1–2 years) were defined as ‘low’ and the last three levels (5–10 years, 11–20 years, Above 21 years) as ‘high’. The median level (3–4 years) was ex-cluded due to its ambiguity in terms of the level of experi-ence, which may hinder our objective in differentiating the effect of high and low work experience. The respon-dents answered each question based on a five-point Likert scale ranging from‘strongly agree’to‘strongly disagree’, or frequencies delineated as ‘never’,‘rarely’,‘sometimes’,‘most of the time’, and‘always’.
Data analysis
To perform the analysis, the research model in Fig. 1
was formulated into a structural equation model (SEM) with AMOS ver. 21.0. SEM provides an advanced plat-form for analyzing mediated or moderated relationships among not only variables but also constructs that en-compass variables. First, we verified the full mediation of teamwork climate, job satisfaction, and working condi-tions on the effect of management leadership to safety climate by analyzing the structural equation model. Next, based on Anderson and Gerbing [53], the two-step approach was employed where the measurement model is examined first with a confirmatory factor analysis (CFA). CFA allows researchers to test their hypotheses that certain relationships between observed variables and their underlying latent constructs exist, when the
[image:3.595.55.542.86.284.2]structure of observed variables and their constructs are predetermined based on existing studies. Then it is followed by a multi-group analysis of the structural model for two different levels of the department experi-ence of the medical staff in the hospital.
Results
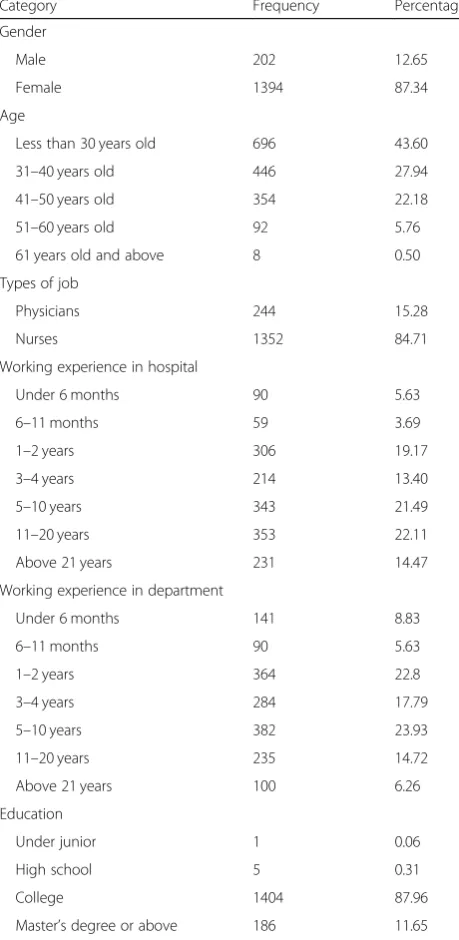
Among the physicians and nurses in the hospital (2205), 1596 participants gave valid responses, which resulted in a response rate of 72.38%.The analysis of measurement model and structural model was then performed based on the aforementioned responses from the survey. The overall demographic information of the participants is
summarized in Table1.
Table 2 presented descriptive statistics for the
con-structs considered in the study. It showed that all the observed variables had absolute values of skewness less than 2 and absolute values of kurtosis less than 7, indi-cating sufficient univariate normality.
Measurement model
A confirmatory factor analysis (CFA) was carried out for the total sample of 1312 responses (High: 717, Low: 595) to validate the latent constructs measured with the ori-ginal 29 items in the overall measurement model. Five items with low associated factor loadings were then
re-moved (two from ‘Teamwork Climate’ construct, three
from ‘Safety Climate’ construct). The resulting overall measurement model with 24 measures showed a good fit with χ2 of 874.809 (df = 212,p< 0.001); goodness-of fit index (GFI) = 0.927; adjusted goodness-of fit index (AGFI) = 0.895; Tucker–Lewis index (TLI) = 0.949; com-parative fit index (CFI) = 0.961; and root mean square error of approximation (RMSEA) = 0.049.
We then tested measurement invariance based on Byrne [54] and Yu [55], where the measurement invari-ance of factor loadings was tested before assessing the invariance of individual path coefficients for analyzing moderation effects. As mentioned above, the overall measurement model with all model parameters to be
es-timated freely in both groups showed a χ2 value of
874.809 (df = 212, p< 0.001). The factor loadings were then constrained to be equal across the groups, resulting in aχ2 value of 893.036 (df = 224, p < 0.001). The differ-ence between these two test statistics (χ2 with df = 12) was 18.23, which was not significant (p= 0.109), imply-ing that the measures showed full metric invariance. Since we verified measurement invariance of factor load-ings, a multi-group CFA was conducted to check the
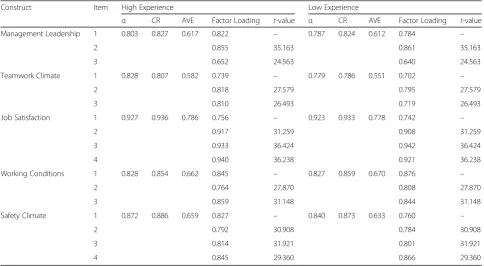
construct validity of the measurement model. Table 3
presented the outcome of a multi-group CFA. All the items were loaded significantly on their corresponding constructs (t> 1.96) with their factor loadings all above 0.6. The scale reliabilities of all constructs, which were
measured by Cronbach’s alpha, exceeded 0.7 and the
composite reliability (CR) values of the constructs were all above 0.8. Also, the average variance extracted (AVE) values of all constructs were over 0.5. These results all exceeded customary acceptable levels [56,57], indicating good construct validity of the measurement model.
Structural model
[image:4.595.305.535.103.574.2]To test the moderating effect of work experience hy-pothesized in Fig.1, a two-group analysis was performed on the structural model. First, the unconstrained model with all path coefficients to be estimated freely in both Table 1The demographic information of the participants
Category Frequency Percentage
Gender
Male 202 12.65
Female 1394 87.34
Age
Less than 30 years old 696 43.60
31–40 years old 446 27.94
41–50 years old 354 22.18
51–60 years old 92 5.76
61 years old and above 8 0.50
Types of job
Physicians 244 15.28
Nurses 1352 84.71
Working experience in hospital
Under 6 months 90 5.63
6–11 months 59 3.69
1–2 years 306 19.17
3–4 years 214 13.40
5–10 years 343 21.49
11–20 years 353 22.11
Above 21 years 231 14.47
Working experience in department
Under 6 months 141 8.83
6–11 months 90 5.63
1–2 years 364 22.8
3–4 years 284 17.79
5–10 years 382 23.93
11–20 years 235 14.72
Above 21 years 100 6.26
Education
Under junior 1 0.06
High school 5 0.31
College 1404 87.96
groups results in a good fit—χ2 of 872.193 (df = 214, p< 0.001); GFI = 0.928; AGFI = 0.897; TLI = 0.950; CFI = 0.961; and RMSEA = 0.048. The unconstrained model was then compared with the fully constrained model, where all the paths were constrained to be equal across the two groups. The difference between the test
statis-tics of the two models (χ2 with df = 6) was 25.143,
which was significant (p < 0.001). Therefore, there was evidence that the structural coefficients did differ
across the high and low-experience groups. Table4
pre-sented the results of structural models for the two ex-perience groups.
All structural coefficients in both groups were statisti-cally significant, with the exception of the path from working conditions to safety climate—the effect was sig-nificant in the high-experience group, but not sigsig-nificant in the low-experience group. In two paths, the effects were stronger in the high-experience group
(manage-ment leadership➔ working conditions, working
[image:5.595.57.539.98.281.2]condi-tions➔safety climate) and for the other four paths, the effects were stronger in the low-experience group (man-agement leadership➔job satisfaction, man(man-agement lea-dership➔teamwork climate, teamwork climate➔safety climate, job satisfaction➔safety climate). To identify Table 2Descriptive Statistics
Range Mean Std. Deviation Skewness Kurtosis
High Work Experience (N= 717)
Teamwork Climate 3.50 4.0600 .77988 −.769 .030
Safety Climate 3.43 4.0650 .71056 −.634 −.240
Job Satisfaction 4.00 4.0271 .88260 −.726 −.060
Management Leadership 3.33 3.9370 .74812 −.343 −.749
Working Conditions 3.25 4.0830 .79206 −.494 −.650
Low Work Experience (N= 595)
Teamwork Climate 4.00 4.1303 .70690 −.810 .515
Safety Climate 4.00 4.0953 .66181 −.859 1.097
Job Satisfaction 4.00 3.9650 .84661 −.584 −.059
Management Leadership 4.00 3.9616 .69347 −.524 .436
Working Conditions 4.00 4.0731 .77938 −.568 −.071
Table 3Multi-group CFA results
Construct Item High Experience Low Experience
α CR AVE Factor Loading t-value α CR AVE Factor Loading t-value
Management Leadership 1 0.803 0.827 0.617 0.822 – 0.787 0.824 0.612 0.784 –
2 0.855 35.163 0.861 35.163
3 0.652 24.563 0.640 24.563
Teamwork Climate 1 0.828 0.807 0.582 0.739 – 0.779 0.786 0.551 0.702 –
2 0.818 27.579 0.795 27.579
3 0.810 26.493 0.719 26.493
Job Satisfaction 1 0.927 0.936 0.786 0.756 – 0.923 0.933 0.778 0.742 –
2 0.917 31.259 0.908 31.259
3 0.933 36.424 0.942 36.424
4 0.940 36.238 0.921 36.238
Working Conditions 1 0.828 0.854 0.662 0.845 – 0.827 0.859 0.670 0.876 –
2 0.764 27.870 0.808 27.870
3 0.859 31.148 0.844 31.148
Safety Climate 1 0.872 0.886 0.659 0.827 – 0.840 0.873 0.633 0.760 –
2 0.792 30.908 0.784 30.908
3 0.814 31.921 0.801 31.921
4 0.845 29.360 0.866 29.360
[image:5.595.56.541.458.724.2]which particular effects differed statistically between the
two groups, two models were compared at a time—the
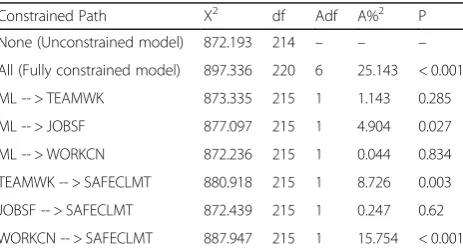
unconstrained model, and a model in which a particular path coefficient of interest was constrained. The statistical difference between the two models was then examined for each path. The outcome of the pairwise comparisons was presented in Table5.
The study showed that the effects of management leadership on job satisfaction, teamwork climate on safety climate, and working conditions on safety climate were found to be statistically different across the high and low-experience groups. Therefore, we inferred that the effects of management leadership on job satisfaction and teamwork climate on safety climate were stronger for low-experience medical staff, whereas the effect of working conditions on safety climate was stronger for high-experience medical staff.
Discussion
In this paper we investigate how management may in-corporate the work experience of medical staff in man-aging the safety climate of a health care organization. A multi-group analysis was conducted for the medical staff of a hospital with two different levels of department work experience. Our results showed that there was evi-dence of the structural coefficients differing across the high and low-experience medical staff. By performing
path-constrained model comparisons, the coefficients that were statistically different in those two groups were identified.
First, the multi-group analysis revealed that the effect of management leadership on job satisfaction was sig-nificantly stronger in the low-experience group. It has been reported that job satisfaction of employees is
af-fected by how managers lead them [58–62] and the
de-gree of job satisfaction generally increases as the work
experience and tenure of employees increase [43–45].
Even though there can be multiple factors that can con-tribute to the increase of job satisfaction with the in-crease of work experience, one of the factors is tolerance for the influence of authority [43]—as people accumulate more experience in an organization, they become more capable of dealing with the influence of managers with higher authority. Therefore, one possible explanation for our result is that the medical staff with low experience may be more sensitive (or less tolerant) to the influence of management on their job satisfaction. For this finding, the implication of how to incorporate work experience into safety climate management is that by showing more care and commitment particularly to the less experi-enced staff, management may be able to improve the safety climate of an organization indirectly by improving the job satisfaction of the less experienced, since job sat-isfaction mediates the effect of management leadership on safety climate.
Second, the multi-group analysis showed that the effect of teamwork climate on safety climate was statistically stronger in the low-experience group. The teamwork cli-mate construct in our measurement reflects the comfort level of each individual when working with other team members, which is closely related to ‘socialization’in an organization [63]. Socialization in an organization is the
process in which newcomers become ‘insiders’ of an
organization [64]. As people in an organization gain more experience and interact more extensively with others, their socialization process advances and they become more like
‘insiders’ who are comfortable in working with other
[image:6.595.58.539.99.209.2]members and adapting to the norms of the organization Table 4Results of structural models
Path High Experience Low Experience
Unstd. Est.t-value P Unstd. Est.t-value P
ML -- > TEAMWK 0.714 16.315 < 0.001 0.790 14.460 < 0.001
ML -- > JOBSF 0.662 18.472 < 0.001 0.799 15.578 < 0.001
ML -- > WORKCN 0.983 24.730 < 0.001 0.968 17.623 < 0.001
TEAMWK -- > SAFECLMT 0.465 10.109 < 0.001 0.739 9.513 < 0.001
JOBSF -- > SAFECLMT 0.098 2.105 0.035 0.131 2.933 0.003
WORKCN -- > SAFECLMT 0.375 8.200 < 0.001 0.091 1.834 0.067
Unstd.Est. Unstandardized Structural Coefficient,P p-value,MLManagement Leadership,SAFECLMTSafety Climate,TEAMWKTeamwork Climate,WORKCNWorking Conditions,JOBSFJob Satisfaction
Table 5Path constrained model comparisons
Constrained Path X2 df Adf A%2 P
None (Unconstrained model) 872.193 214 – – –
All (Fully constrained model) 897.336 220 6 25.143 < 0.001
ML -- > TEAMWK 873.335 215 1 1.143 0.285
ML -- > JOBSF 877.097 215 1 4.904 0.027
ML -- > WORKCN 872.236 215 1 0.044 0.834
TEAMWK -- > SAFECLMT 880.918 215 1 8.726 0.003
JOBSF -- > SAFECLMT 872.439 215 1 0.247 0.62
WORKCN -- > SAFECLMT 887.947 215 1 15.754 < 0.001
[image:6.595.58.290.588.713.2][65]. Therefore, our result may be attributed to their low level of socialization—since low-experienced members are not comfortable enough in working with other team members, their perception of safety climate may be af-fected more by their collaboration with other team mem-bers than the perception of the highly experienced. For the aforementioned finding, the implication on how to in-corporate work experience into safety climate manage-ment is that the managemanage-ment may have to put more effort into facilitating the socialization process of less experi-enced staff (i.e. aiding the less experiexperi-enced staff by imple-menting mentoring programs) in order to affect their perception of teamwork climate positively; this can signifi-cantly improve their safety climate, since teamwork cli-mate has been reported as a highly critical factor that affects patient safety [52,66–68].
Furthermore, the analysis demonstrated that the effect of working conditions on safety climate was significantly stronger in the high-experience group. One of the key com-ponents that the construct of working conditions in our measurement deals with is about staff training and supervi-sion, especially for new and inexperienced staff members [48]. The reasoning is that working with less-trained, inex-perienced personnel can seriously threaten the safety of patients and medical staff. Flin et al. [39] investigated the influence of seniority in terms of work experience in their study of 11 hospitals, and found that the degree to which medical staff is irritated by improperly trained members significantly differed between consultants (more experienced) and non-consultants (less
experi-enced)—the medical stuff with more experience became
more irritated than the less experienced. This may be related to the outcome of our results. It is possible that more experienced medical staff is more irritated and threatened by the incompetence of co-workers, which can negatively affect safety climate. The incompetence is mainly caused by the issues of training and supervis-ing new personnel, which is measured by the construct
of “working conditions” in our study. Therefore, we
may say that working conditions affect the experienced staff more than the less experienced, consequently re-sults in a stronger effect on safety climate. Regarding our discovery mentioned above, the implication on how to incorporate work experience into safety climate management is not only that management must con-tinue to train new personnel and educate medical staff regarding safety issues, but they also need to pay more attention to the complaints of experienced medical staff regarding the members that cause problems, and try to show strong commitment to deal with those personnel in a constructive manner. The management may then be able to positively affect the perception of working conditions for more experienced staff, which can result in improved safety climate.
Limitations
There are several limitations in our study that can lead to more future works. One concern is the limitation of reflecting different aspects of the safety related con-structs. In this study, our measurement tool was based on two SAQ-based questionnaires. Even though SAQ is a validated and widely used tool in the health care
indus-try [50, 51], the safety-related constructs in SAQ can
only measure certain aspects of each construct, and therefore our interpretations may be limited to those as-pects. For example, the working condition construct in our study mainly describes the issues of training and supervising new medical staff, whereas there may be health care organizations more concerned about other issues of working conditions such as the effectiveness and maintenance of equipment or the overall workforce levels of organizations compared to their demand. For this reason, future research may utilize other measure-ment tools that address different aspects of safety con-structs and extend the investigation of this topic.
Second, future research may further investigate the impact of cultural differences in different regions of the world. How people perceive and behave responding to their management or seniors can vary under different cultures, which in turn may draw different dynamics be-tween management leadership constructs and the other safety constructs. This study was conducted in Taiwan, which may limit our results to the Southeast Asia region. Consequently, we suggest researchers extend this study to various cultures in order to compare and analyze the outcomes.
Third, the perceptions of people regarding certain con-structs of organizations can change over time. Since our study was based on cross-sectional data, it would be meaningful to perform a longitudinal study that analyzes how the impact of work experience on the relationships among the safety-related constructs considered in this study change over time so that management may under-stand trends and construct future plans for organizational safety in the long term.
Lastly, we excluded the medium level of work
experi-ence (3–4 years) from the analysis. The reason we
Conclusions
This study investigated how to incorporate the work ex-perience of medical staff into safety climate management. Our results suggested that management should approach the more experienced and the less experienced differently by focusing on different safety constructs—more on job satisfaction and teamwork climate for the less experi-enced, and more on working conditions for the more ex-perienced. The findings in this study may be leveraged for efficient utilization of limited resources for safety climate improvement, especially at the planning stage of the initia-tives and action plans for the organization.
Abbreviations
AGFI:Adjusted goodness-of fit index; AVE: Average variance extracted; CFA: Confirmatory factor analysis; CFI: Comparative fit index; CR: Composite reliability; GFI: Goodness-of fit index; HROs: High reliability organizations; HRT: High reliability theory; RMSEA: Root mean square error of approximation; SAQ: Safety attitude questionnaire; SEM: Structural equation modeling; TLI: Tucker–lewis index
Acknowledgements
The data used in this study were provided by Taichung Veterans General Hospital in Taichung City, Taiwan.
Funding Not applicable.
Availability of data and materials
The datasets generated during and/or analyzed during the current study are not publicly available but are available from the corresponding author on reasonable request.
Authors’contributions
SHK conceived the study, designed the model, analyzed the data, discussed the meanings of the findings and prepared the first draft of the manuscript. SJW acquired and analyzed the data, discussed the meanings of the findings and prepared the second draft of the manuscript. All authors worked on the revisions of the manuscript until it was accepted. Both authors read and approved the final manuscript.
Ethics approval and consent to participate
Ethical approval for this study was obtained from the Institutional Review Board of Taichung Veterans General Hospital in Taiwan (IRB TCVGH No: CW15250A). Written consent was obtained from each participant prior to participation in the Safety Attitude Questionnaire. The right of withdrawal from the study was emphasized.
Consent for publication Not applicable.
Competing interests
The authors declare no competing of interests regarding the publication of this paper.
Publisher’s Note
Springer Nature remains neutral with regard to jurisdictional claims in published maps and institutional affiliations.
Author details
1Department of Business Administration, Ajou University, Suwon 443-749,
South Korea.2Executive Master Program for Health Administration, Tunghai University, Taichung City, Taiwan40704.3Department of Industrial
Engineering and Enterprise Information, Tunghai University, Taichung City, Taiwan40704.
Received: 10 July 2018 Accepted: 21 November 2018
References
1. Guldenmund FW. The nature of safety culture: a review of theory and research. Safety Sci. 2000;34(1–3):215–57.
2. Flin R, et al. Measuring safety climate: identifying the common features. Safety Sci. 2000;34:177–92.
3. Gadd S, Collins AM. Safety culture-A review of the literature. Sheffield: Health and Safety Laboratory; 2002.
4. Kristensen S, Hammer A, Bartels P, Suñol R, Thompson GO, CA WC. Quality management and perceptions of teamwork and safety climate in European hospitals. Int J Qual Health Care. 2015;27(6):499–506.
5. Zaheer S, Ginsburg L, Chuang YT. Patient safety climate (PSC) perceptions of frontline staff in acute care hospitals: examining the role of ease of reporting, unit norms of openness, and participative leadership. Health Care Manag Rev. 2015;40:13–23.
6. Weingart S, Farbstein K, Davis R, Phillips R. Using a multihospital survey to examine the safety culture. Jt Comm J Qual Saf. 2004;30(3):125–32. 7. Probst TM. Safety and insecurity: exploring the moderating effect of
organizational safety climate. J Occup Health Psychol. 2004;9:3–10. 8. McFadden KL, Stock GN, Gowen CR. Implementation of PSI in US hospitals.
Int J Oper Prod Manage. 2006;26(3):326–47.
9. Neal A, Griffin M. A study of the lagged relationships among safety climate, safety motivation, safety behavior, and accidents at the individual and group levels. J Appl Psychol. 2006;91(4):946–53.
10. Stock GN, McFadden KL, Gowen CR. Organizational culture, critical success factors, and the reduction of hospital errors. Int J Prod Econ. 2007;106(2): 368–92.
11. Vogus TJ, Sutcliffe KM. The impact of safety organizing, trusted leadership, and care pathways on reported medication errors in hospital nursing units. Med Care. 2007;45(10):997–1002.
12. Avolio BJ, Waldman DA, McDaniel MA. Age and work performance in nonmanagerial jobs: the effects of experience and occupational type. Acad Manag J. 1990;33(2):407–22.
13. Wageman R. Interdependence and group effectiveness. Adm Sci Q. 1995;40: 145–80.
14. Yi M, Oh JH, Hwang HM, Kwon EJ, Lee JH, Park EY. Hospital Workers' experience with hospital evaluation program: a focus group study. J Korean Acad Nurs. 2011;41(4):568–79.
15. Kim MY, Won JS. Adaptation to clinical experience by older graduate nurses who entered nursing after graduation in another field. J Korean Acad Fundam Nurs. 2007;14(3):361–70.
16. O-l S, Phillips DR, T-w L. Age differences in safety attitudes and safety performance in Hong Kong construction workers. J Saf Res. 2003;34: 199–205.
17. Mark BA, Hughes LC, Belyea M, Bacon CT, Chang Y, Jones C. Exploring organizational context and structure as predictors of patient falls and medication error. J Patient Saf. 2008;4(2):66–77.
18. Singer S, Falwell A, Gaba D, Baker L. Hospital patient safety climate: variation by management level. Med Care. 2008;46(11):1149–56.
19. Singer SJ, Hartman CW, Hanchate A, Zhao S, Meterko M, Shokeen P, Lin S, Gaba DS, Rosen A. Comparing safety climate between two populations of hospitals in the US. Health Serv Res. 2009;45(5):1563–84.
20. Beus JM, Bergman ME, Payne SC. The influence of organizational tenure on safety climate strength: a first look. Accid Anal Prev. 2010;42(5):1431–7. 21. Weng SJ, Kim SH, Wu CL. Underlying influence of perception of
management leadership on patient safety climate in healthcare organizations–a mediation analysis approach. Int J Qual Health Care. 2017; 29(1):111–6.
22. Colla JB, Bracken AC, Kinney LM, et al. Measuring patient safety climate: a review of surveys. Qual Saf Health Care. 2005;14:364–6.
23. Helmreich RL, Foushee HC. Why crew resource management? Empirical and theoretical bases of human factors training in aviation. In Wiener EL, Kanki BG, Helmreich RL (Eds.), Cockpit resource management. San Diego: Academic Press; 1993. pp. 3–45.
24. Sexton JB, Thomas EJ, Helmreich RL. Error, stress, and teamwork in medicine and aviation: cross sectional surveys. BMJ. 2000;320:745–9.
26. Donabedian A. The quality of care: how can it be assessed? JAMA. 1988;260: 1743–8.
27. Firth-Cozens J. Organisational trust: the keystone to patient safety. Qual Saf Health Care. 2004;13:56–61.
28. Dedobbeleer N, Béland F. Is risk perception one of the dimensions of safety climate. Occupational injury: Risk prevention and intervention; 1998. p. 73–81.
29. Fleming MT, Flin RH, Mearns K, Gordon RP. The offshore supervisor's role in safety management: law enforcer or risk manager. In: SPE health, safety and environment in oil and gas exploration and production conference. Society of Petroleum Engineers; 1996.
30. Hale AR, Heming BHJ, Carthey J, Kirwan B. Modelling of safety management systems. Safety Sci. 1997;26:121–40.
31. O’Dea A, Flin R. Site managers and safety leadership in the offshore oil and gas industry. Safety Sci. 2001;37:39–57.
32. Yule SJ, Flin R, Murdy AJ. Modeling managerial influence on safety climate. In: Poster presented at Society for Industrial and Organizational Psychology (SIOP) Conference; 2001.
33. Ruchlin HS, Dubbs NL, Callahan MA. The role of leadership in instilling a culture of safety: lessons from the literature. J Healthc Manag. 2004;49:47. 34. Luria G. The social aspects of safety management: trust and safety climate.
Accid Anal Prev. 2010;42:1288–95.
35. Cron WL, Dubinsky AJ, Michaels RE. The influence of career stages on components of salesperson motivation. J Mark. 1988:78–92.
36. Kohli AK. Effects of supervisory behavior: the role of individual differences among salespeople. J Mark. 1989:40–50.
37. Johnston MW, Parasuraman A, Futrell CM. Extending a model of salesperson role perceptions and work-related attitudes: impact of job tenure. J Bus Res. 1989:269–90.
38. Vecchio RP, Boatwright KJ. Preferences for idealized styles of supervision. Leadersh Q. 2002;13:327–42.
39. Flin R, Fletcher G, McGeorge P, Sutherland A, Patey R. Anaesthetists' attitudes to teamwork and safety. Anaesthesia. 2003;58(3):233–42. 40. de Wet C, Johnson P, Mash R, McConnachie A, Bowie P. Measuring
perceptions of safety climate in primary care: a cross-sectional study. J Eval Clin Pract. 2012;18(1):135–42.
41. Thomas EJ, Sherwood GD, Mulhollem JL, Sexton JB, Helmreich RL. Working together in the neonatal intensive care unit: provider perspectives. J Perinatol. 2004;24(9):552–9.
42. Kim J, An K, Kim MK, Yoon SH. Nurses' perception of error reporting and patient safety culture in Korea. West J Nurs Res. 2007;29(7):827–44. 43. Spector PE. Job satisfaction: Application, assessment, cause, and
consequences. SAGE: Thousand Oaks; 1997.
44. Mwamwenda TS. Teaching experience, job security, and job satisfaction among secondary school teachers in South Africa. Psychol Rep. 1998;82: 139–42.
45. Traut CA, Larsen R, Feimer SH. Hanging on or fading out? Job satisfaction and the long-term worker. Public Pers Manag. 2000;29:343–51.
46. Cox SJ, Cheyne AJT. Assessing safety culture in offshore environments. Saf Sci. 2000;34:111–29.
47. Mearns K, Flin R, Gordon R, Flemming M. Measuring safety climate on off-shore installations. Work Stress. 1998;12:238–54.
48. Sexton JB, Helmreich RL, Neilands TB, et al. The safety attitudes
questionnaire: psychometric properties, benchmarking data, and emerging research. BMC Health Serv Res. 2006;6:44.
49. Lee LJ, Hsu CH, Hong JC. Explore the impact of hospital restructuring medical practitioners of patient safety culture attitudes. J Health Manag. 2012;10(2):189–99.
50. Fujita S, Seto K, Ito S, et al. The characteristics of patient safety culture in Japan, Taiwan and the United States. BMC Health Serv Res. 2013;13:20. 51. Taylor JA, Pandian R. A dissonant scale: stress recognition in the SAQ. BMC
Res Notes. 2013;6:1.
52. Lee YC, Weng SJ, Stanworth JO, Hsieh LP, Wu HH. Identifying critical dimensions and causal relationships of patient safety culture in Taiwan. J Med Imaging Health Informatics. 2015;5(5):995–1000.
53. Anderson JC, Gerbing DW. Structural equation modeling in practice: a review and recommended two-step approach. Psychol Bull. 1988;103(3):411. 54. Byrne BM, Shavelson RJ, Muthen B. Testing for the equivalence of factor
covariance and mean structures: the issue of partial measurement invariance. Psychol Bull. 1989;105(3):456–66.
55. Yu PJ, Pysarchik DT, Kim YK. Korean Retailers' dependence level: the impact of power sources, satisfaction, conflict, and long-term orientation. J Glob Acad Mark Acad Sci. 2008;18(1):81–114.
56. Carmines EG, Zeller RA. Reliability and validity assessment. Sage University Paper Series on Quantitative Applications in the Social Sciences, no. 07-017. Beverly Hills: Sage; 1979.
57. Hair JF, Andreson RE, Tatham RL, Black WC. Multivariate data analysis. 5th (ed) ed. Unites States of America: Prentice-hall Inc; 1998.
58. Lashbrook WB. Business performance, employee satisfaction, and leadership practices. Perform Improv. 1997;36:29–33.
59. Bogler R. Two profiles of schoolteachers: a discriminant analysis of job satisfaction. Teach Teach Educ. 2002;18:665–73.
60. Heller W. Neuropsychological mechanisms of individual differences in emotion, personality, and arousal. Neuropsychology. 1993;7:476. 61. Mckee JG. Leadership styles of community college presidents and faculty
job satisfaction. Community/Junior College Quarterly of Research and Practice. 1991;15(1):33–46.
62. Judge TA, Piccolo RF. Transformational and transactional leadership: a meta-analytic test of their relative validity. J Appl Psychol. 2004;89:755.
63. Ostroff C, Kozlowski SW. The role of mentoring in the information gathering processes of newcomers during early organizational socialization. J Vocat Behav. 1993;42:170–83.
64. Bauer TN, Bodner T, Erdogan B, Truxillo DM, Tucker JS. Newcomer adjustment during organizational socialization: a meta-analytic review of antecedents, outcomes, and methods. J Appl Psychol. 2007;92:707–72. 65. Allen DG. Do organizational socialization tactics influence newcomer
embeddedness and turnover? J Manag. 2006;32(2):237–56.
66. Helmreich RL. On error management: lessons from aviation. BMJ. 2000;320: 7815.
67. Sexton B, Marsch S, Helmreich R, Betzendoerfer D, Kocher T, Scheidegger D. Jumpseating in the operating room. In: Simulators in anesthesiology education. Boston, MA: Springer; 1998. p. 107–8.