Estimating Commitment in Digital Marketplace Environment
Rajiv Mathur, James Irvine and John Dunlop
University of Strathclyde - Department of Electronic and Electrical Engineering – 204 George St. –
Glasgow G1 1XW – Scotland
Ph.: + 44 141 548 4072, Fax: +44 141 552 4968
e-mail: {
rajiv.mathur,j.m.irvine,j.dunlop}@strath.ac.ukABSTRACT
The future generation of mobile communication shall be a convergence of mobile telephony and information systems which promises to change people's lives by enabling them to access information when, where and how they want. It presents opportunities to offer multimedia applications and services that meet end-to-end service requirements. The Digital Marketplace framework will enable users to have separate contracts for different services on a per call basis. In order for such a framework to function appropriately, there has to be some means for the network operator to know in advance if its network will be able to support the user requirements. This paper discusses the methods by which the network operator will be able to determine if the system will be able to support another user of a certain service class and therefore negotiate parameters like commitment, QoS and the associated cost for providing the service, thus making the Digital Marketplace work.
1. INTRODUCTION
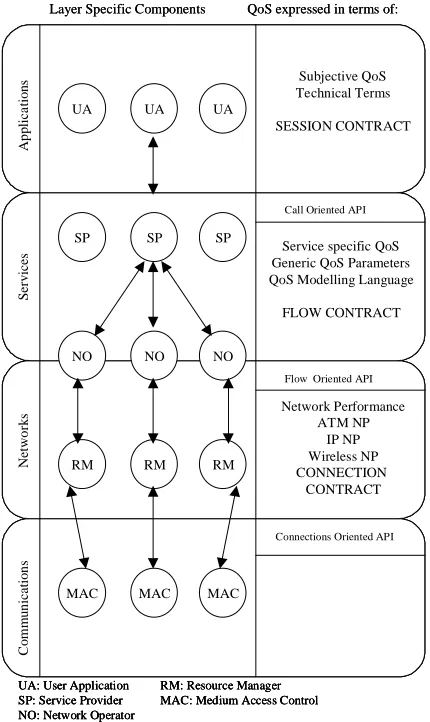
Digital Marketplace [10] is a framework proposed to introduce competition in mobile communications market by enabling users to select the service provider for each service they request. The working principle of the Digital Marketplace is that, unlike the user terminals in fixed networks, a multi-mode user terminal will have the physical ability to connect to various access networks possibly owned by different organisations. Customers will no longer be restricted to using the services of a single network operator. Figure 1 illustrates this framework. A competition at flow level is introduced by letting suppliers and customers of communications services compete for each service. The system enables the user to select the serving mobile network by negotiating, directly or indirectly, a contract with requirements in terms of service, price and quality.
The service provider negotiates user requirements with the network operator who will finally carry the user traffic over its network. The network operator decides if the new user can be taken onto the system and if so, at what cost. If the network has enough resources to support the user requirements and the user and their service provider agree, the user is taken onto the system, otherwise the negotiation fails. This takes place by means of ‘contracts’. If the user is taken onto the system, the network operator will also have to associate a certain degree of commitment to the contract. Commitment is defined as the probability that the network operator will be able to deliver what was
promised in the contract and the contract shall not have to be renegotiated before the natural termination of the call. For the Digital Marketplace to operate, it is necessary for network operators to have reliable means of calculating commitment and thus manage their systems accordingly [1].
Layer Specific Components QoS expressed in terms of:
UA UA UA
MAC MAC MAC
RM RM RM
NO NO NO
SP SP SP
Ap
p
lic
a
tio
n
s
S
er
v
ices
Netwo
rk
s
C
o
m
m
u
n
ic
atio
n
s
Subjective QoS Technical Terms
SESSION CONTRACT
Service specific QoS Generic QoS Parameters QoS Modelling Language
FLOW CONTRACT
Network Performance ATM NP
IP NP Wireless NP CONNECTION
CONTRACT Call Oriented API
Flow Oriented API
Connections Oriented API
UA: User Application RM: Resource Manager SP: Service Provider MAC: Medium Access Control NO: Network Operator
UA UA UA
MAC MAC MAC
RM RM RM
NO NO NO
SP SP SP
Ap
p
lic
a
tio
n
s
S
er
v
ices
Netwo
rk
s
C
o
m
m
u
n
ic
atio
n
s
Subjective QoS Technical Terms
SESSION CONTRACT
Service specific QoS Generic QoS Parameters QoS Modelling Language
FLOW CONTRACT
Network Performance ATM NP
IP NP Wireless NP CONNECTION
CONTRACT Call Oriented API
Flow Oriented API
Connections Oriented API
[image:1.595.318.533.276.637.2]UA: User Application RM: Resource Manager SP: Service Provider MAC: Medium Access Control NO: Network Operator
Figure 1: Digital Marketplace Framework The work presented here suggests the methods by which network operators will be able to make this decision and also gives insight into how commitment can be estimated.
2. DIGITAL MARKETPLACE
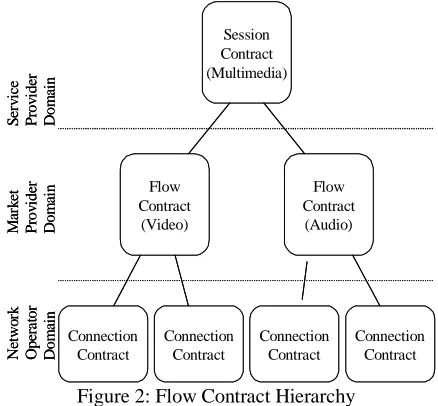
user is not restricted to having only one service provider. For example, one user may have a contract with one service provider for the provision of voice services and have a contract with another service provider for providing a videoconference service. This form of contract is called a session contract and is specified with service specific terms. The contract specification in the Digital Marketplace is hierarchical. A session contract is broken up into a number of flow contracts. Market provider, the entity that controls the Digital Marketplace, has the responsibility to see that the flow contracts are being fulfilled. Each flow contract specifies the quality of a flow in the session. A multimedia session, for example, is composed of a video flow and an audio flow. During the communications phase, the flow might be re-routed over more optimal connections, as during handover. Therefore, the flow contract can be considered as a sequence of connection contracts. The connection contract is a network specific means to specify the level of performance required by the application between the two points of the communications path. Figure 2 illustrates the concept of hierarchy of contracts.
In the beginning of any communications session, there is a contract negotiation phase in which the user requests a service by placing its requirements to the service provider(s). The user may specify the requirements in technical or non-technical terms. The service provider tenders user requirements in the Digital Marketplace and negotiates with the network operators for the provision of the required service.
Session Contract (Multimedia)
Connection Contract
Connection Contract Connection
Contract Connection
Contract Flow Contract
(Video)
Flow Contract (Audio)
S
erv
ic
e
Pr
ov
id
er
Do
m
ai
n
Ma
rk
et
Pr
ov
id
er
Do
m
ai
n
Net
w
o
rk
Op
era
to
r
Do
m
ai
n
Session Contract (Multimedia)
Connection Contract
Connection Contract Connection
Contract Connection
Contract Flow Contract
(Video)
Flow Contract (Audio)
S
erv
ic
e
Pr
ov
id
er
Do
m
ai
n
Ma
rk
et
Pr
ov
id
er
Do
m
ai
n
Net
w
o
rk
Op
era
to
r
Do
m
ai
[image:2.595.62.281.428.631.2]n
Figure 2: Flow Contract Hierarchy
In specific scenarios, the user can act as its own service provider and negotiate directly with the network operators for provision of the required service. At this point it is left to the network operator(s) to decide if their network has resources to support the user requirements. If there are sufficient resources in the system to support the incoming user without violating the contracts of the existing users the network operator takes the new user onto the system, otherwise the contract is refused.
The Digital Marketplace works on a penalty mechanism. If the network operator fails to deliver what
was negotiated in the contract, it is penalised and the reputation of the network operator goes down. This may result in fewer users or service providers offering contracts to the network operator, and so its network infrastructure will be under utilised. The network operator may wish to lower its price in order to make itself more competitive [2]. Thus, in order to maintain the reputation and earn good business, a network operator has to maintain its reputation in the marketplace. This depends on the ability of the network operator to have an estimate of how many users can be accommodated in its system and what is the level of commitment that can be associated. The problem becomes even more complicated in a heterogeneous system where users have substantially different QoS requirements. Such a multi-service system has been modelled. The simulation model used forms the subject of the next section, which will be followed by the results obtained and conclusions.
3. SIMULATION MODEL
System level simulation has been carried out to address the problem of estimating commitment in a network. The concept of commitment is independent of the choice of the air interface. However, specific values will be defined by the actual system. This paper models an EGPRS-like system to model the packet channels in EDGE, because of its ability to offer multimedia capabilities in GSM systems [7].
3.1 Cellular network Model
The simulation environment assumes a regular hexagonal macro-cell layout approximated by circular cells of 1km radius. The model considers a seven-cell cluster pattern. The centre cell is the cell under observation and is surrounded by six first tier interfering cells. The cell layout considered for the simulation purposes is shown in Figure 3.
[image:2.595.333.515.515.748.2]First Tier Interferers Cell Under Observation First Tier Interferers Cell Under Observation
3.2 Resources available
Like GSM, EDGE uses 200kHz carriers with each carrier divided in time domain into eight time slots. The model assumes 3 carriers per cell. This gives 24 channels per cell. The total bandwidth per cell is therefore 200×3 = 600 kHz and for a 7 cell cluster, the total bandwidth required will be 7×600 = 4200 kHz or 4.2 MHz.
3.3 Link Adaptation
The EDGE air interface is intended to facilitate high data rates, high spectral efficiency and moderate implementation complexity. The dynamic selection of modulation and coding scheme to suit radio link quality is referred to as Link Adaptation. Link adaptation is implemented in the simulation model whereby the most appropriate coding scheme is chosen for transmission. The modulation and coding schemes used here are listed in Table 1.
SCHEME MODULATION RAW DATA PER
BLOCK (bits)
DATA RATE kb/sec
MCS-9 1184 59.2
MCS-8 1088 54.4
MCS-7 896 44.8
MCS-6 592 29.6
MCS-5
8 PSK
448 22.4
MCS-4 352 17.6
MCS-3 296 14.8
MCS-2 224 11.2
MCS-1
GMSK
[image:3.595.50.292.286.406.2]176 8.8
Table 1: Link Adaptation, Modulation and Coding schemes in EDGE source [8]
3.4 Carrier to Interference (CIR) Calculation
Co-channel interference has been considered. The interferers have the same traffic and mobility pattern as the mobiles in the centre cell. Path loss is calculated using the plane earth propagation model [3]. Shadow fading is calculated using a log-normal distribution with mean 0 and variance of 6 dB. A new value of shadowing is calculated after the mobile has travelled a de-correletion distance of 20 meters. Shadowing is correlated with the precious value by averaging the new value with the previous value.
3.5 Traffic Models
The system supports users of three service types: Video (H263), Voice and Data (www access), although many more service types can be included.
The user requirements for different services can be grouped into different QoS Classes. Four service classes have been defined in UMTS [4]. For example, voice and videoconference services are classified as conversational class while world wide web access is classified as interactive class. The delay requirements for conversational class are very stringent while they are less so for interactive class. Traffic models are the statistical representation of the traffic generated by the sources of different service types.
The traffic model for video used for the simulation uses the packet size and arrival distribution of a H263 codec, which is aimed at providing low bit rate video
service in wireless networks. The mean bit rate of the codec model used is 16 kilobits per second, although the instantaneous bit rate of the H.263 codec varies considerably, and the mean call duration 150 seconds [9].
Voice service has been modelled by a ON-OFF model with alternate talk-spurts and silence spurts. Voice packets are generated as long as the talk-spurt lasts. The duration of the talk-spurt follows a negative exponential distribution with a mean of 1 second. The silence between talk-spurts also follows a negative exponential distribution but with a mean of 1.4 second. A voice packet generated every 20 ms in a talk-spurt has a size of 160 bits. The mean call duration of a voice call is 100 seconds.
[image:3.595.306.540.355.462.2]The model used for www access is also an ON-OFF model [5]. The users request pages and then there is a reading time also called the “INACTIVE OFF” time. For every page, a separate request is sent for each of the objects present in the page. The time difference between the request for one object and the next one is referred to as “ACTIVE OFF” time. The request sizes have been assumed to be 400 bytes. The distribution for the ACTIVE OFF and INACTIVE OFF times are shown in Table 2.
COMPONENT MODEL
PROBABILITY DISTRIBUTION FUNCTION
PARAMETERS
ACTIVE OFF
TIMES Weibull
b
a x b b
e a bx x
p (/) 1
)
( −
−
= a = 1.46;
b = 0.382
INACTIVE
OFF TIMES Pareto
) 1 ( )
(x =αkαx−α+
p α = 1.5
k = 1
Table 2: Parameters for Web Model Source [5]
3.6 System Dynamics
In order to approach the dynamics of a real system, the system is subjected to a load in terms of arrival rate of users per hour of each service type. Users of all three service types approach the system with a negative exponential arrival rate. The arrival rate of users of one service type is kept independent of the users of another service type. The system is dynamic, new users are created depending upon the load distribution of their service type. The users that have been served leave the system. Using the system dynamics as described above gives more accurate estimate of how many users of each service type the system is capable of handling. In other words, this gives more accurate estimate of the capacity of the system. Mobiles leaving the observation cell are replaced by mobiles entering at the same point.
3.7 Channel Allocation
or 2 channels respectively depending upon availability. A voice user only requires one channel.
The choice of the number of channels required for each service has also been derived from simulation. Allocation of less than 3 channels to a video user results in unacceptable transmission delays. Conversational class traffic such as video and voice are very sensitive to delays. A delayed packet arriving at its destination is considered to be useless. For this reason, if a packet from a video or voice user fails to get a channel after making two attempts, it is dropped.
4. RESULTS
In order to examine the effect of mixes of traffic, it is important to consider the arrival and departure of different flows. This is due to the fact that the different flows have different characteristics, which may be masked by considering a given number of flows of each type present in the system at a single point in time. Therefore, simulations were conducted on the basis of mean call or session rates over a period of time. The arrival and departure of sessions is in line with the traffic model for each source. This will result in a constant offered load at any point in time.
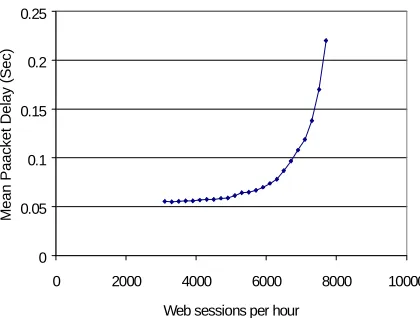
Since this is a packet based system, delay is the main metric. When the system is operated in single service mode, the delays for varying loads of voice, video and web traffic is shown in Figures 4, 5 and 6 respectively. If the load is increased, packets start being dropped. Voice and video traffic have tight delay constraints, which limits the number of sessions that can be supported. Web traffic is queued longer, which means that very large number of web sessions can be supported with a reasonable delay.
The situation becomes interesting when traffic mixes are considered. Simulations were undertaken while keeping the number of users of one service type constant and increasing the number of users of other service type until the performance of at least one service degrades. The typical value for maximum delay for video and voice service is assumed to be 40 ms and for web sessions equal to 0.3 seconds.
Figure 8 shows the trade off between video and voice traffic. Simulations were undertaken by varying the offered load to the system between voice and video calls. In a real system, an operator could vary the proportion of each traffic type by either prioritising one or other traffic type in the resource management system, or by varying the cost of contracts so that the traffic offered to that operator changes [2].
It can be seen that there is a fairly linear trade-off between video and voice calls, although the slope of the line is 5.6, which is significantly greater than the 3:1 trade-off in slots. This means that although a video service only costs an operator 3 times as many slots as a voice call, trunking effects mean that in practice the operator would have to charge 5.6 times as much for a video call as a voice call to recover the same revenue.
Trade-offs between voice and web and video and web are shown in figures 5 and 6 respectively. The voice versus web trade off is again fairly linear, with a relative cost of a voice call being about 3.75 times that of a web session. There is a greater trade off for a small
number of voice calls, since web traffic can be buffered, so that even a small number of voice calls requires a significant amount of capacity to be set aside for it. This effect could be reduced, to some extent, by partitioning resources between services as proposed in [6]. This trade off can be more clearly seen for the mix of web and video users. The cost trade off in web and video users is that a video user costs about 10 times as much as a web user.
0 0.01 0.02 0.03 0.04 0.05 0.06 0.07 0.08
0 500 1000 1500 2000
Voice calls per hour
[image:4.595.322.534.173.320.2]Mean packet delay (Sec)
Figure 4: Mean Packet Delay for Voice Users
0.034 0.035 0.036 0.037 0.038 0.039 0.04 0.041 0.042
0 50 100 150 200 250 300
Video calls per hour
[image:4.595.323.532.355.519.2]Mean packet delay (Sec)
Figure 5: Mean Packet Delay for Video Users
0 0.05 0.1 0.15 0.2 0.25
0 2000 4000 6000 8000 10000
Web sessions per hour
Mean Paacket Delay (Sec)
[image:4.595.321.531.560.719.2]requirements of the different services means that a small number of the more demanding service causes a disproportionate loss in the number of users the less demanding service can support. This is particularly noticeable between video and data users, where a small number of video users causes the loss of a large number of data users. This is because of the large difference in quality requirements, and in order to allow any video users on to the system with acceptable quality, there would be the loss of revenue from a large number of web sessions. This effect is also present between video and voice, and between voice and data.
Video/voice
0 200 400 600 800 1000 1200 1400 1600 1800
0 50 100 150 200 250 300
Video calls per hour
Voi
c
e c
a
lls
per
[image:5.595.320.532.72.205.2]hour
Figure 7: Trade off between Video and Voice Users
Voice/data
0 1000 2000 3000 4000 5000 6000 7000 8000
0 500 1000 1500 2000
Voice calls per hour
W
eb s
e
s
s
io
n
s
per hour
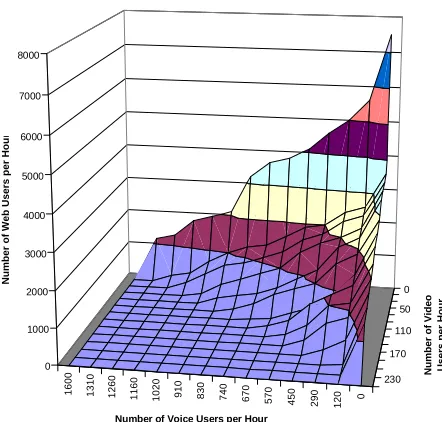
Figure 8: Trade off between Voice and Data Users The plotted surface in Figure 10 shows a ‘operating zone’ in which a network operator can aim to place its system at all times. A trade off between all three services is clearly shown. For example, a network operator can have 1300 voice users alone or 250 video users alone in the system instead of having a ‘service mix’. An important finding of the analysed system is that the system has given the ‘cost’ in terms of resources that a network operator pays for providing the different services discussed.
For example providing video service to a user will cost differently depending upon the number of users of different service types present in the system. Depending upon the prevailing ‘price’ of different services in the Digital Marketplace, there is a scope of optimising the system for maximum revenue using the information given by the plotted surface.
Video/data
0 1000 2000 3000 4000 5000 6000 7000 8000
0 50 100 150 200 250 300
Video calls per hour
W
eb
s
e
s
s
ions
[image:5.595.64.278.222.348.2]per hour
Figure 9: Trade off between Video and Data Users
0
120
290
450
570
670
740
830
910
1020
1160
1260
1310
1600
0 50
110
170
230 0
1000 2000 3000 4000 5000 6000 7000 8000
Number of Web Users per Hou
r
Number of Voice Users per Hour
Number of Video Users per Hour
Figure 10: Trade off between Video, Voice and Web users
It can also be observed that since the system can accommodate many more www users, it might be useful to have a few www users ‘embedded’ in the system without possibly affecting the contracts of the existing voice and video users.
Similarly, it may be useful for the network operator to take up more voice users or web users when the system is approaching the far end of either axes rather than taking up another video user.
5. CONCLUSIONS
[image:5.595.315.536.235.446.2] [image:5.595.66.280.405.541.2]Therefore, a network operator can give statistical guarantees. Simulation results show that if the network operator, on the arrival of a new call finds that the network will be well inside the operating zone even after accepting a new user, then a high commitment can be given. The network operator may also adjust the system and optimise it for maximum revenue by moving the system up and down in all three directions on the plotted surface. This optimisation will depend on the prevailing prices of different services in the digital marketplace. Following the surface in a digital marketplace environment will thus give a network operator an all win situation in terms of both, reputation and revenue.
ACKNOWLEDGEMENTS
The authors acknowledge the support of the UK Virtual Centre of Excellence in Mobile & Personal Communications (MVCE) in the funding of this work. More detailed information and software tools associated with this research are available to Industrial Members of MVCE.
REFERENCES
[1] G Le Bodic, J Irvine, D Girma and J Dunlop, “QoS Management with Dynamic Bearer Selection Schemes”, WPMC, November 2000, Bangkok, Thailand.
[2] G Le Bodic, D Girma, J Irvine and J Dunlop “Dynamic 3G Network Selection for Increasing the Competition in Mobile Communications Market ”,
in Proc. IEEE Vehicular Technology Conference (VTC), Boston, MA, September 2000.
[3] J Dunlop and D G Smith, Telecommunications Engineering, Third Edition. Chapman and Hall, 1994. ISBN 0 412 56270 7.
[4] “Universal mobile Telecommunications System (UMTS); QoS Concept and Architecture (3GPP TS 23.107 v3.5.0 Release 1999)” ETSI TS 123 107. [5] P Barford and M Crovella, “Generating
Representative Web Workloads for Network and Server Performance Evaluation”, Proc of SIGMETRICS’98/PERFORMANCE’98, p 151-160, June 1998, Madison, WI.
[6] J Irvine, G. Le Bodic, R. Atkinson and D Weerakoon, “Fair Resource Management in Diverse Cellular Systems”, in Proc. IEEE Vehicular Technology Conference (VTC), Boston, MA, September 2000.
[7] A Furuskar, S Mazur, F Muller and H Olofsson, EDGE: Enhanced Data Rates for GSM and TDMA/136 Evolution, IEEE Personal Communications June 1999.
[8] “Digital cellular telecommunications system (phase 2+); General Packet Radio Service; Overall description of GPRS radio ETSI TS 101 350 GSM 03.64 ”
[9] Lazaro, D Girma, “Modelling Streaming Video Traffic at Low Bitrates”, MVCE Internal Report. [10]J Irvine, “Adam Smith Goes Mobile, Managing
![Table 1: Link Adaptation, Modulation and Codingschemes in EDGE source [8]](https://thumb-us.123doks.com/thumbv2/123dok_us/1730643.126506/3.595.50.292.286.406/table-link-adaptation-modulation-codingschemes-edge-source.webp)