Kelly, Ursula and Marsh, Richard and McNicoll, Iain (2002) The impact of
higher education institutions on the UK economy. University of Strathclyde,
Glasgow, United Kingdom. ISBN 1 84038 078 x
http://eprints.cdlr.strath.ac.uk/
3110
/
Strathprints is designed to allow users to access the research
output of the University of Strathclyde. Copyright © and Moral
Rights for the papers on this site are retained by the individual
authors and/or other copyright owners. Users may download
and/or print one copy of any article(s) in Strathprints to facilitate
their private study or for non-commercial research. You may not
engage in further distribution of the material or use it for any
profitmaking activities or any commercial gain. You may freely
distribute the url (
http://eprints.cdlr.strath.ac.uk
) of the Strathprints
website.
The impact of higher
education institutions
on the UK economy
Ursula Kelly, Richard Marsh, Iain McNicoll
The impact of higher
education institutions
on the UK economy
Contents
Foreward 6
Executive Summary 7
Introduction 9
I. UK HEIs: The Income Base 11
II. Employment Profile of UK HEIs 16
III. Expenditure of UK HEIs 20
IV. The Knock-On Impact of UK HEIs on the UK Economy 21
V. The Additional Impact of Overseas Students and Overseas HEI Visitors 28
VI. Conclusions 30
Appendix One: Acknowledgements 33
Appendix Two: Methodology and Model Specification 34
Appendix Three: Index of Tables and Charts 40
Appendix Four: List of Survey Respondents 41
Appendix Five: Survey Questionnaire 43
Foreword
Some five years ago the then Committee of Vice Chancellors and Principals published the first UK-wide study of the impact of the higher education sector on the national economy. Produced by Professor Iain McNicoll and colleagues at the University of Strathclyde, the report explained how UK higher education was a significant business in its own right by assessing it against several standard economic measures including employment and output. It was clear from the results of the study that the sector has a major impact on job creation, income and export earnings.
Since 1997 major developments in the sector have reinforced this impact. The sector has continued to expand in the context of the government’s new target of 50% participation by 18-30 year olds in English higher education by the end of the decade. International student recruitment remains strong and institutions have been reinforced in their efforts by the Prime Minister’s initiative to develop this market further and to set a goal of 50,000 more such students by 2005. This growth in student numbers has been matched by other developments that will reinforce the economic impact of universities. There has been a notable increase in knowledge transfer activities and the introduction of new public funding for these ‘third stream activities’. At the same time the volume of research funded by industry and the charities has continued to rise.
These developments all pointed to the need to update the earlier assessment of the economic impact of the higher education sector and the University of Strathclyde was commissioned to produce a further report. The new report confirms the importance of a sector that has an income of £12.8 billion a year, gross export earnings of £2.7 billion and employs 1.4% of the total workforce. In terms of its wider economic impact the sector generated nearly £35 billion of output (it has a higher than average output multiplier) during the academic and financial year 1999/2000 and created nearly 563,000 jobs throughout the economy. A novel feature of this report is its assessment of the type of employment generated by the sector in the wider economy and these jobs are relatively higher skilled than those of the UK economy as a whole.
This report confirms that there is no room for doubt about the direct economic importance of higher education. It means that future levels of public investment in the sector will have a broader economic impact as well as determining whether universities and colleges are able to continue to provide high quality teaching and research as they have done in the past.
Professor Roderick Floud
Executive Summary
This study presents an up-to-date analysis of the impact of UK higher education institutions on the economy of the United Kingdom during the academic and financial year 1999/ 2000. It examines the role of higher education as a conventional industry and the economic activity generated in the UK as a result of higher education activity.
The UK higher education institutions (HEIs) included in this study are the 170 institutions returned to the Higher Education Statistics Agency (HESA) in the academic and financial year 1999/2000. The higher education sector is defined as comprising the UK HEIs plus all overseas students and overseas visitors to UK HEIs in the study year.
Key economic aspects of UK higher education institutions, in terms of income, expenditure and employment, are examined together with the secondary or ‘knock-on’ effects of UK HEI activity and that of the expenditure of overseas students and overseas visitors attracted to the UK by HEIs. The study additionally highlights the skills profile of employment generated by UK HEIs and by overseas student and visitor expenditure.
The overall impact of the higher education sector on the economy was estimated using a specially constructed type II UK input-output model, with data derived from the 1998 UK input-output tables together with 1998 Labour Force Survey data.
Higher education institutions
Income
Expenditure
In 1999/2000, the total income of UK HEIs amounted to £12.8 billion.
‘Core’ public sector income (i.e. funding council grants and academic fee payments from the public sector) accounted for 50% of all HEI income.
Total income of any kind from the UK public sector amounted to £8 billion or 63% of all income.
Income from the UK private sector accounted for approximately £3.7 billion or 27% of all HEI income.
HEI overseas income (or gross export earnings) were an estimated £1.3 billion, making up 10% of all HEI income.
• •
•
•
•
In 1999/2000 UK HEIs spent £12.7 billion, with the largest single component of expenditure being labour costs (58%).
The total personal (off-campus) expenditure of overseas students attending UK HEIs in 1999/2000 was estimated to be £1.3 billion. This was equivalent to 9.5 % of all UK receipts from overseas visitors to the UK in the year 2000.
•
Employment and output
Skilled employment
The total personal (off-campus) expenditure of overseas business and recreational visitors to UK HEIs was estimated to be £125 million or nearly 1% of all UK receipts from overseas visitors to the UK in 2000.
The HE Sector’s gross export earnings in 1999/2000 were estimated to be £2.7 billion.
In 1999/2000 UK HEIs, together with overseas students and overseas visitors (the HE Sector), spent over £12.3 billion on goods and services produced in the UK. This expenditure generated additional economic activity throughout the economy through ‘knock-on’ or multiplier effects.
•
•
•
In 1999/2000 UK HEIs directly employed an estimated 345,000 people, making up approximately 297,000 full-time equivalent (fte) jobs across all occupational groups. This was equivalent to 1.4% of total UK employment.
For every 100 jobs within the HEIs themselves, a further 89 jobs were generated through knock-on effects throughout the economy.
For every £1 million of HEI output a further £1.56 million of output is generated in other sectors of the economy.
In total the UK HE sector generated over £34.8 billion of output and over 562,600 fte jobs throughout the economy through direct and ‘knock-on’ effects. This was equivalent to 2.7 % of the UK workforce in employment.
•
•
•
•
Employment in UK HEIs is relatively higher skilled than employment in the UK as a whole, with a significantly higher concentration of jobs in NVQ 4 and NVQ 5 (first degree and higher degrees) and less in NVQ 3 and below.
The employment generated by the HE sector through ‘knock-on’ effects is also relatively higher-skilled than that of the UK as a whole.
•
The role of higher education in the economy has become a matter of considerable interest and policy focus in recent times. There is an increasing emphasis on the contribution of higher education to the development of a knowledge economy, particularly through higher education’s role in improving the skills base of the UK as well as in the development and application of university research.
It has also been noted that individual universities and colleges play a crucial role within their local economies, attracting revenue to the region and generating employment in the surrounding areas. Numerous studies have been conducted which measure the impact of higher education on different regions of the UK.
At a macroeconomic level, the value of higher education’s role in generating export earnings for the UK has begun to be recognised, with a range of government initiatives designed to boost the numbers of overseas students attending UK universities and colleges. Recent government encouragement of e-Learning activities (such as the UK e-University) also appears to be intended to support the development of UK higher education as a global player in the distance learning and continuing professional development markets, thereby maximising export earning potential.
However public debate on higher education is most often focused on social and ‘accountability’ issues such as the participation in higher education by particular social groups or an apparent desire to measure higher education’s success in terms of overall teaching and research outcomes. The reality of higher education as a major industry in the UK, measured in conventional terms of income, expenditure and employment, remains to be fully realised by government, by politicians, by the public at large and often indeed by the higher education institutions themselves.
This study seeks to provide an up-to-date analysis of key economic aspects of UK higher education institutions, the size of the sector as a whole, its sources of income, the employment it creates, and the export earnings it attracts. Using economic input-output analysis the study is able to examine the impact of HEI expenditure in generating employment and output throughout the economy. Additionally it examines the skill content of employment generated by the UK HE sector, and compares this with other UK industries.
The primary focus of the study is the activity of the higher education institutions, their revenue base, direct employment and the impact of institutional expenditure on the economy through secondary or ‘knock-on’ effects. In examining the overall knock-on effect, the off-campus personal expenditure of overseas students and that of overseas visitors to UK HEIs is also analysed. The personal expenditure of domestic UK students is excluded
as while this may be of significance in regional terms, reflecting transfers across regional boundaries, it is arguably not of any specific additional benefit to the UK as a whole, as the monies are likely to have been expended within the UK in any case.
For the purposes of this study therefore, the UK HE sector is defined as the 170 UK HEIs returned to the Higher Education Statistics Agency (HESA) in the academic and financial year 1999/2000 (the most recent year for which data were available), together with the personal expenditure of overseas students and overseas visitors to UK HEIs in that year.
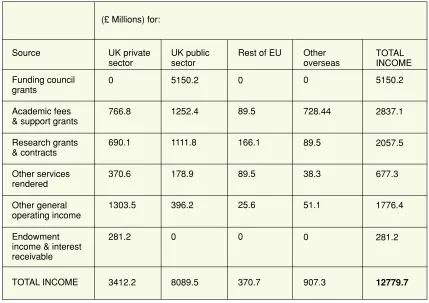
(£ Millions) for:
Source
Funding council grants
Academic fees & support grants
Research grants & contracts Other services rendered Other general operating income Endowment income & interest receivable TOTAL INCOME UK public sector 5150.2 1252.4 1111.8 178.9 396.2 0 8089.5 Other overseas 0 728.44 89.5 38.3 51.1 0 907.3 UK private sector 0 766.8 690.1 370.6 1303.5 281.2 3412.2
Rest of EU
0 89.5 166.1 89.5 25.6 0 370.7 TOTAL INCOME 5150.2 2837.1 2057.5 677.3 1776.4 281.2 12779.7 The Higher Education Statistics Agency (HESA) regularly publishes data regarding the income of higher education institutions (HEIs) in the UK. However data on the sources of HEI income are limited to only a few of the broad income categories and do not enable a full picture of trends in HEI income to be drawn. Therefore for this study HESA data were supplemented by collecting information direct from HEIs. A survey questionnaire circulated to 120 UK HEIs achieved a response rate of 54%. Using detailed returns from a sample of 55 institutions and grossing up by the reciprocal sample share of the HESA control totals, the study team was able to derive estimates for the pattern of UK HEI income by source and purpose.
I. UK HEIs: The Income Base
[image:11.595.83.512.284.587.2]As the table demonstrates, UK HEIs derive income from a wide variety of sources. In the study year of 1999/2000 the total income of UK HEIs amounted to £12.8 billion. This included revenue from the higher education funding councils, other UK government departments and public agencies, private sector UK industry and UK charities, EU sources and other overseas clients.
Figure 2: UK HEI income by source 1999/2000
Examination of the income base of UK HEIs reveals that while the UK public sector remains their largest single customer, 37% of HEI income is in fact derived from private sector and overseas clients. It is also worth highlighting that ‘core’ public sector income (defined as funding council grants together with academic fee payments deriving from the public sector) only accounted for 50% of all HEI income in 1999/2000. The remaining 13% of income from the public purse is that earned for a wide range of services, won on a competitive basis frequently against private consultancy firms, government research institutes and other bodies.
1 All income received by HEIs could ultimately be disaggregated into the specific purposes and projects/services for which
they were received. However income falls into a number of broad categories, some of which are self-explanatory at the aggregate level (e.g. research contracts). Funding council monies are intended to support teaching and research activity, and so where funding council monies are mentioned they are regarded as for teaching and research activity.
Figure 3: HEI income by purpose 1999/2000
While HEIs receive income from a variety of sources, the bulk of the income received (79%) is directly related to teaching and research activity1. However a significant proportion
[image:12.595.153.451.388.520.2]Sectoral gross output and comparisons with other industries
[image:13.595.160.463.228.378.2]In national accounting terms, HEI income is equivalent to sectoral gross output. With HEI income of £12.8 billion, higher education is clearly a significant industry in the UK context. To give some comparators of industries of similar size: in terms of sectoral gross output higher education was similar to the 1998 sectoral gross output of the entire UK aircraft and spacecraft industry, slightly larger than the air transport industry, slightly larger than advertising and slightly smaller than UK legal services and office machinery. It was about half the size of computing services2.
Figure 4: Sectoral gross outputs (1998)
Comparisons over time - the diversification trend
A similar survey on HEI income was conducted for the earlier (1997) study, and comprised data relating to the academic and financial year 1995/96. It is possible therefore to observe any change in the trend of HEI income by source and purpose by comparing income sources between the two study years.
Figure 5: Comparison of HEI income by purpose between 1995/96 and 1999/2000
2 Comparator sectoral gross outputs are taken from within the same UK input-output model used for this study, the base
[image:13.595.135.475.546.673.2]Figure 6: Comparison of the proportion of HEI income by source between 1995/96 and 1999/2000
Overall, the purpose for which HEI income is earned has not differed very much, which suggests that the portfolio of fundable activities in which HEIs engage has not changed to any great extent. However, there is an observable change in the pattern for the sources of income. Over the four year period from 1995/96 to 1999/2000, total income from the public purse as a proportion of HEI income has dropped from 73% to 63% (with ‘core’ funding falling from 56% to 50%). Income generated from private sector and overseas sources has risen to fill the gap, from 19% private sector income to 27% and overseas income now represents 10% of HEI income compared to 8% previously.
Looking beneath the headline figures, a pattern of where changes are emerging can be seen in the table below.
Figure 7: Percentage of income by source as a proportion of that type of income 1999/2000 (1995/96 figures in brackets)
Source of Income as a % of type Type of Income
Funding Council Grants 99/00 (95/96)
Academic Fees & Support Grants 99/00 (95/96)
Research Grants & Contracts 99/00 (95/96)
Other Services Rendered 99/00 (95/96)
Other General Operating Income 99/00 (95/96)
Leaving aside minor differences, which could be attributable to definitional changes in categorisation of income or to rounding-up factors, there appears to be an underlying trend towards private sector income making up a higher proportion of income in key areas. In all the main categories of income, aside from funding council grants, which by definition must be public money, public sector income has fallen as a proportion of total income received in each category.
Of particular note is the growth in private sector fee payments, which now make up 27% of all fee income compared to only 13% four years previously. While it was not possible to quantify precisely the amounts involved in the course of this study, it is almost certain that one reason underlying this switch from public to private fee payments is the 1998 introduction of the requirement for domestic and EU undergraduate students to pay a means-tested contribution towards the cost of their degree course. This will have led to a larger proportion of undergraduate fee income being classed as private fee payments.
In order to understand the role that HEIs play in the economy it is important to know how many staff they employ. However this is not information that is readily available from any published source and is indeed not collected on a regular basis UK-wide. HESA publishes data on academic staff numbers, comprising teaching and research staff. However academic staff only make up a minority of staff employed in HEIs and it is essential to take the totality of HEI employment into consideration.
Therefore information on staff data was requested from 120 Universities UK members. A sample of staff employment from 51 institutions provided sufficient detail to enable an estimate of total HEI employment to be made, using HESA statistics on academic staff to gross-up to the whole HEI staff population. Overall UK HEIs employed approximately
345,300 people in 1999/2000.
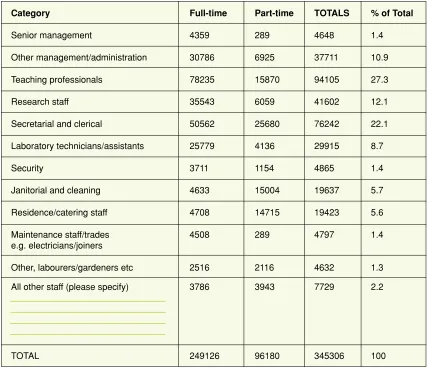
The total estimates of UK HEI employment are shown in Figure 8 below:
[image:16.595.84.513.351.719.2]II. Employment Profile of UK HEIs
Figure 8: Estimated employment in UK HEIs 1999/2000
(Number of jobs, questionnaire format)
Category Full-time Part-time TOTALS % of Total
Senior management 4359 289 4648 1.4
Other management/administration 30786 6925 37711 10.9
Teaching professionals 78235 15870 94105 27.3
Research staff 35543 6059 41602 12.1
Secretarial and clerical 50562 25680 76242 22.1
Laboratory technicians/assistants 25779 4136 29915 8.7
Security 3711 1154 4865 1.4
Janitorial and cleaning 4633 15004 19637 5.7
Residence/catering staff 4708 14715 19423 5.6
Maintenance staff/trades 4508 289 4797 1.4
e.g. electricians/joiners
Other, labourers/gardeners etc 2516 2116 4632 1.3
All other staff (please specify) 3786 3943 7729 2.2
3 For example, the University of Strathclyde has a total (headcount) student population of around 65,000, including continuing
professional development and continuing education students. While obviously full-time students may use facilities most often, the university still needs to provide access to its facilities e.g. computing, library and recreational, for all registered students.
4 This is the standard conversion adopted by the Office of National Statistics.
Since the primary purpose of higher education is teaching and research, it is not surprising that academic teaching and academic research staff make up the largest proportion of staff, with just under 40% of all HEI staff classified as either ‘teaching professionals’ or ‘research’ staff. However it is interesting to note that the vast majority of employment (60%) in HEIs is not of staff in academic positions but is spread across a range of other occupations. The next largest staff group is secretarial and clerical staff, who account for around 22% of all HEI employment.
Among the reasons for this is the fact that in order to deliver their teaching and research mission, HEIs require a substantial infrastructure, often comprising significant estates and buildings - not only laboratories, lecture theatres and offices, but also residential accommodation, catering facilities, sports and recreation centres. Indeed some of the larger UK HEIs could be compared to small or medium sized towns within themselves, with facilities required to serve populations of c. 60,000 people (staff and students) or more3.Such an infrastructure requires a wide range of management, administration, support
and maintenance staff. Given this, it is not surprising that individual HEIs are frequently among the largest employers in their locale, with a significant influence on the surrounding area.
Comparisons of HEI occupational structure with that of the UK
as a whole
[image:17.595.83.511.455.643.2]In order to compare the occupational structure of HEIs with that of the UK as a whole, HEI employment numbers were converted into full-time equivalents (ftes) by assuming that one part-time job is equal to half of a full-time job4. The results are shown in Figure 9.
It can be observed that HEIs were highly specialised in Standard Occupational Classification (SOC) 2 Professional Occupations, which is to be expected given that their main activity is the provision of education services. Conversely the HEIs do not directly employ any significant number of staff in SOC 7 Sales Occupations or SOC 8 Plant and Machine Operatives. Perhaps more surprising is the concentration of employment in SOC 4 Secretarial and Clerical Occupations, which is higher than the UK average. However it may also be the case that some jobs described as ‘secretarial and clerical’ within universities and colleges may be described as administrative or management in other industries and if reallocated would be classified in SOC 1 (management), raising the management proportion of employment closer to the UK average.
Overall UK HEIs employed an estimated 345,300 people in 1999/2000. This translates to 297,216 fte jobs in the UK, which is equivalent to 1.4% of the total UK workforce in employment5.
Skills profile of direct HEI employment
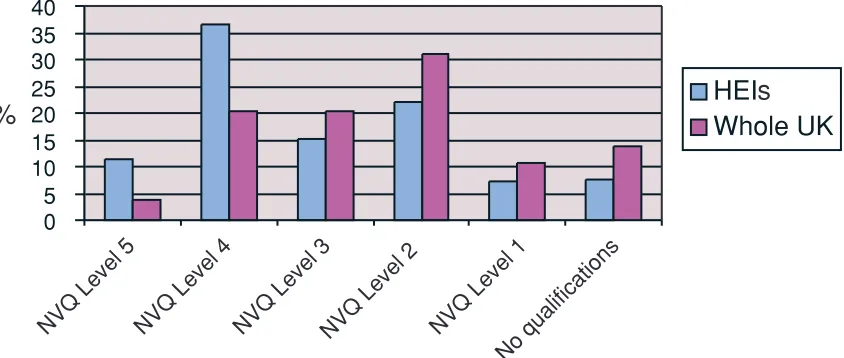
[image:18.595.89.511.418.597.2]The UK input-output model constructed for this study included a satellite labour market and qualifications extension. This enabled analysis of the qualifications and skills profile of UK HEI employment to be undertaken as well as analysis of the profile of knock-on employment generated (which will be discussed subsequently). It was therefore possible to compare the profile of skilled employment within UK HEIs with that of the UK workforce as a whole.
Figure 10: Comparison of skills profile of HEI employment and the UK as a whole
It can be noted that employment in UK HEIs was relatively higher skilled than employment in the UK as a whole, with a significantly higher concentration of jobs in NVQ 4 and NVQ 5 (first degree and higher degrees) and less in NVQ 3 and below. While at first glance this may be expected, given that academic staff would normally be expected to possess degree
5 This is calculated using the base year of the input-output model, which contains information on the total fte UK workforce
level qualifications, it should be remembered from the preceding analysis that the majority of staff employed in higher education are not in fact academic staff, but include many occupations which are common in other employment sectors. The weighted NVQ average for HEI employment is NVQ 3.0, whereas for the UK workforce as a whole it is NVQ 2.34.
In 1999/2000 UK HEIs spent £12.7 billion, which was approximately equal to their income, and is to be expected with non-profit making bodies. A summary breakdown of HEI expenditure is shown below. The largest single component of HEI expenditure was labour costs, which is not surprising for a skilled labour-intensive service industry.
Figure 11: Summary breakdown of UK HEI expenditure 1999/2000 (Total: £12.7 billion)
It is clear from the preceding sections that UK HEIs are a significant industry in the UK, with substantial revenue, expenditure and employment. However this study also sought to measure the total economic impact of HEIs, in terms of the economic activity generated through ‘knock-on’ or multiplier effects.
While the HEIs themselves produce service outputs that generate income and employment within the HEIs, the provision of these services also generates additional demand for UK goods and services, through both the wage expenditures of HEI employees and through HEI purchases of UK goods and services.
‘Knock-on’ or multiplier effects are generally recognised as comprising two types of economic interaction:
In order to provide estimates of these ‘knock-on effects’ it is necessary to use an operational model of the UK economy. For the purposes of this study a UK input-output model was specially constructed, using the 1998 UK Input-Output Tables6. Please see Appendix Two
for an explanation of the input-output model that was constructed. An additional feature of the specially constructed model was that it included a ‘skilled labour satellite’. This was achieved by marrying the core input-output model with a labour market extension7. This
enables not only an estimate of the number of fte jobs generated to be made, but in which occupations and at what level of qualification those jobs are likely to exist.
To run the model, it is necessary to disaggregate expenditure estimates of HEIs into that relating to different UK industry sectors and incorporate these into the model as a component of final demand in the corresponding industries.
IV. The Knock-On Impact of UK HEIs
on the UK Economy
Indirect effects: HEIs purchase goods and services from other sectors in order to support their own activity, thereby stimulating activity in those industries. The supplying industries also make purchases from other suppliers in order to fulfil the orders from HEIs, and those suppliers in turn make purchases, so there is a rippling-out effect.
Induced Effects: HEIs pay wages and salaries to their employees, who spend this income on consumer goods and services. This creates wage income for employees in other sectors, who also spend their income, and so on, rippling throughout the economy.
•
•
In the earlier 1997 CVCP study, extremely detailed information on operating expenditure of HEIs was collected. This had proved extremely resource-intensive for HEIs to provide and so for this study it was decided that key expenditure aggregates would be accessed from HESA data. It was assumed that the detailed UK sectoral pattern of expenditure was the same in 1999/2000 as it had been in 1995/96. While this was decided for practical reasons, it is highly unlikely that there has been any major shift in HEI expenditure behaviour during the four year period, and this assumption regarding the pattern of HEI expenditure will not have any significant effect on the overall assessment of aggregate economic impact.
Incorporating the disaggregated expenditure estimates into the input-output model enabled the calculation of the impact of:
The results are summarised below.
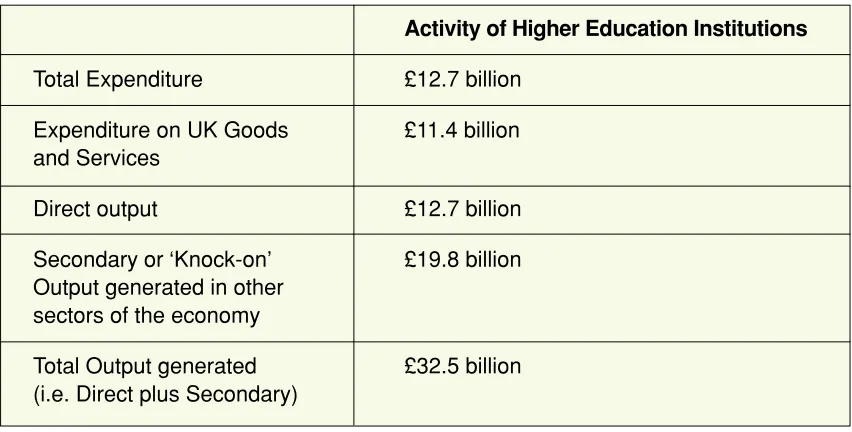
[image:22.595.85.511.496.712.2]Output generated in the economy
Figure 12: Output generated in the UK by the activity of UK HEIs 1999/2000
Sectoral Gross Output: This is measured in monetary units and for most industries it is approximately equivalent to turnover or gross receipts. For distribution and transport industries, it is a measure of gross margins.
Household income: Again measured in monetary units, this is income from employment and includes employers’ NI and pension contributions. In other words it is a measure of labour costs.
Employment: Measured in terms of full-time equivalent jobs (physical units), where 1 part-time job = 0.5 of a full-time job.
•
•
•
Activity of Higher Education Institutions
Total Expenditure £12.7 billion
Expenditure on UK Goods £11.4 billion and Services
Direct output £12.7 billion
Secondary or ‘Knock-on’ £19.8 billion Output generated in other
sectors of the economy
As the table reveals, in 1999/2000, UK HEIs spent £12.7 billion, of which £11.3 billion was estimated to have been expended on UK goods and services.
[image:23.595.141.458.178.277.2]This generated total output within the UK of £32.5 billion, of which £12.7 billion was the output of the HEIs and £19.8 billion was output generated in other UK Industries.
Figure 13: Total output generated by UK HEIs 1999/2000 (Total: £32.5 billion)
The output multiplier for UK HEIs was 2.56. Therefore for every £1 million of HEI output, a further £1.56 million is generated in other sectors of the economy. It is interesting to note that the output generated outside the HEIs was spread across a wide range of other sectors, with a slight emphasis on manufacturing and also on business activities. The output multiplier for HEIs ranked 43rd out of the 123 input-output sectors in the UK model constructed for this study, which would suggest that the proportion of HEI expenditure on UK goods and services was relatively high.
[image:23.595.126.442.459.723.2]In the study year 1999/2000 UK HEIs paid £7.3 billion in wages, which represents household income for HEI employees. HEI employees spend this income on goods and services which in turn generates activity within the economy and wages and salaries for other employees, who in turn spend their wages etc.
[image:24.595.87.512.235.390.2]It is estimated that the employment income paid by HEIs resulted in an additional £5.3 billion of household income throughout the UK.
Figure 15: Household income generated by HEI activity
Figure 16: Total household income generated in the UK economy by HEIs 1999/2000 Total income: £12.6 billion
The household income-output multiplier for UK HEIs was calculated as 0.998, which held a ranking of 7th out of the 123 input-output sectors within the UK model constructed for the study. This is a measure of household income generated per unit of output and would suggest that HEIs were relatively efficient in creating household income within the UK.
The HEI income multiplier was measured to be 1.72, indicating that for every £100 of wages paid directly by HEIs, a further £72 was paid as wages elsewhere in the economy as a result of HEI activity.
Household income
Activity of Higher Education Institutions
Direct income paid by HEIs to households £7.3 billion through wages
Household income generated through wages £5.3 billion paid in other sectors as a result of secondary
effects
[image:24.595.121.457.436.565.2]We have seen from earlier sections that UK HEIs directly employed an estimated 345,300 people in 1999/2000, which translates into full-time equivalent employment of 297,216.
Through the secondary or ‘knock-on’ effects of the expenditure of HEIs and their employees, a further 240,032 full-time equivalent jobs were generated outside higher education institutions.
Figure 17: Employment generated by UK HEIs 1999/2000 Total: 537,248 ftes
537,248 fte jobs in the UK are equivalent to 2.6% of the total UK workforce in employment8.
This clearly indicates that UK HEIs are of significant importance in generating employment throughout the UK.
The employment multiplier for HEIs is 1.80, indicating that for every 100 jobs created directly within an HEI, another 80 jobs are generated elsewhere in the economy.
The occupational profile of the employment generated through secondary effects can be compared with the profile of employment within the HEIs themselves.
Employment generated by HEIs
8 This is calculated using the base year of the input-output model, which contains information on the total fte UK workforce
Figure 18: Occupational profile of employment generated by UK HEIs 1999/2000 Total: 537,248 ftes
It can be noted that where employment directly within HEIs is relatively specialised in Standard Occupational Classifications (SOCs) 2 and 4 (professional and clerical), the pattern of secondary employment is more similar to the occupational profile of the UK as a whole (Figure 9).
It is also possible to observe in which industries the secondary employment generated by HEIs is created (Figure 19). As the graph demonstrates, employment was created across all major industrial sectors, but with an emphasis on manufacturing, wholesale and retail, and business activities. Given that this is the outcome of the expenditure of HEIs and their staff, this ultimately reflects both the nature of the purchases made and the processes through which those purchases are made. Hence it is not surprising that the wholesale and retail sector figures quite highly.
[image:26.595.134.440.525.703.2]Comparisons of multiplier values for HEIs with other
sectors
Two key multiplier values for a sector are those for output and employment:
Output multiplier
The output multiplier is a reflection of the domestic purchasing linkages of the sector in question; i.e. a sector which purchases a higher than average proportion of its operating requirements (including labour) domestically, will tend to have a higher Type II output multiplier.
Employment multiplier
An industry which tends to have higher than average direct labour inputs per unit of output (i.e. is labour intensive) will tend to have a smaller Type II multiplier.
[image:27.595.86.513.358.617.2]It is possible to compare the multipliers for higher education institutions with those from other sectors within the input-output model. Some examples are given in Figure 20 below.
Figure 20: Comparator multipliers for HEIs with selected other UK Industries
It can be seen that HEIs had a relatively higher output multiplier than the selected industries, which suggests that HEIs tended to make a larger proportion of purchases on UK goods and services than the comparator industries.
At 1.80, the employment multiplier of HEIs can be taken to reflect its relatively labour-intensive activity, compared to, for example, a capital labour-intensive sector like office machinery.
Industry Type II Multiplier Type II Multiplier Output Employment Higher Education Institutions 2.56 1.80
Aircraft and Space Craft 2.21 2.87 Office Machinery 1.81 3.72
Air Transport 1.60 2.04
Banking/Finance 1.35 1.27 Research & Development 1.29 1.27 Computing Services 1.28 1.31 Legal Activities 1.26 1.22 Oil Processing and Nuclear Fuel 1.13 1.46
Agriculture 1.11 1.10
9 These payments are captured within the data on HEI revenue.
10 There are a number of tourist board initiatives designed to support HEIs in this way - for example the Glasgow Ambassadors’
Programme run by the Greater Glasgow Tourist Board is intended to provide the support required for individual academics to persuade major international learning societies to come to the city.
11 A recent study undertaken for the DfEE Changing Student Finances: Income, Expenditure and the Take-up of Student
Loans Among Full-time and Part-time Students in 1998/99(Callender and Kemp Dfee, London, 2000) indicates that
expenditure among those under 26 has risen by 7% in real terms since 1995 and by 3% in real terms for those over 26.
UK HEIs attract a substantial number of overseas students and overseas visitors (both business and recreational) every year. As well as making payments directly to the HEIs for tuition fees, accommodation and catering costs9, these students and visitors incur
additional personal expenditure off-campus and this also has an impact on the economy, generating employment and output in the UK. In many ways overseas students are analogous to ‘long-stay tourists’; while their per diem expenditure may not be as a high as a short-stay tourist, they stay for a much longer time and their overall expenditure therefore represents a significant injection into the economy.
The attraction of overseas visitors to the UK is also a feature of UK HEI activity, and one that a number of regional tourist boards and development agencies are seeking to encourage. For example many UK HEIs are encouraged to promote their city and their university or college as a location for major international academic conferences10.
Data sources on overseas students
In 1999/2000, HESA data indicated that 224,660 overseas domiciled students were registered at UK HEIs. Survey data on overseas student expenditure was not collected specifically for this study. However data on domestic student personal expenditure were used within the previous study to map types of overseas student to particular domestic student categories and an average personal expenditure (off-campus) figure of £5600 p.a was derived. Domestic student expenditure has been observed to rise since the previous study11; however overseas students do not always exhibit the same spending
patterns as domestic students. Therefore it was decided to assume that overseas student per capita personal expenditure had remained the same. To that extent, assumptions regarding overseas student personal expenditure within the study are conservative.
Data sources on overseas visitors
Survey data on overseas visitors (business and recreational) to HEIs had been collected for the earlier 1997 study which had indicated nearly 870,000 business visitor bednights and 551,000 recreational visitor bednights in 1995/96. An estimate of the number of overseas visitors to HEIs within the study year was obtained by assuming that the pattern of overseas visitors to UK HEIs had risen modestly, following the same trend as overseas visitors to the UK as a whole. Information on trends was obtained from the Office of National Statistics Travel Trends 1999. The same publication provided information on the
average per diem spend of overseas business and recreational visitors. It was therefore possible to derive an estimate of total overseas visitor expenditure in 1999/2000.
A similar approach was adopted for the treatment of overseas student and visitor expenditure to that adopted for the HEIs; i.e. that the pattern of their expenditure on consumer goods and services was assumed to have remained broadly similar to that observed in the 1997 study. To avoid double-counting, the estimated expenditures of both overseas students and overseas visitors take account of amounts paid to HEIs e.g. for residence and catering.
[image:29.595.87.513.257.460.2]The results are shown in the table below:
Figure 21: Impact of overseas student and overseas visitor expenditure 1999/2000
It is clear that while the activity of HEIs has the most significant impact on the economy, activity generated by the personal expenditure of overseas students and overseas visitors to HEIs is not trivial. The £1.4 billion of student and visitor expenditure in the UK also represents export earnings, attracted into the UK by HEIs. So while the expenditure of the HEIs themselves has the most significant impact, the off-campus expenditure of overseas students and visitors must also be considered as an additional bonus of HEI activity, to the UK economy.
Overseas Students Overseas Visitors
Total personal expenditure £1.3 billion £125 million (off-campus)
Expenditure on UK goods £933 million £94 million and services
Knock-on output generated £2 billion £235 million throughout the UK economy
Knock-on household £499 million £68 million income generated
This study was intended to provide an up-to-date analysis of key economic characteristics of UK HEIs. It is apparent from the evidence presented that the UK’s higher education institutions play a significant role within the UK through the economic activity they generate, aside from any intrinsic value that may be placed on the actual educational services they provide.
Overall impact of the HE sector
Taking the HE sector as defined12, there are a number of key points to be highlighted. In
[image:30.595.86.513.347.571.2]1999/2000 the UK Higher Education Sector generated £2.7 billion in export earnings for the UK. It generated over 562,600 full-time equivalent jobs, or around 2.7% of total UK employment. Output dependent on the HE sector amounted to £34.8 billion and £13.3 billion was paid in wages to UK households as a result of the HE sector’s activity. Details are shown in Figure 22 below.
Figure 22: Overall impact of the UK higher education sector on the UK economy
The skills profile of employment generated by the HE sector
The study has also provided an analysis of the skills profile of the UK HEIs, as a contribution to the debate on the importance of increasing the UK skills base. While higher education is most frequently viewed as being a means to that end through increasing throughput of higher education students, it is also worth noting that higher education may contribute in other ways to the UK skills base. Figure 23 shows the relative skill profiles of employment within higher education institutions, employment generated by HE sector expenditure and that of the UK as a whole.
VI. Conclusions
Total Output (Direct plus ‘knock-on’)
Figure 23: Skill profile of HEI employment, knock-on employment generated by the HE sector and UK workforce as a whole
An interesting feature of this comparison is that while the skill profile of the knock-on employment generated by the expenditure of the HE sector is lower than that of employment directly within the HEIs, it remains more concentrated in the higher NVQ bands than the skill profile of the UK workforce as a whole. This is likely to be a result of the particular types of expenditure that the HE sector makes, with an emphasis on services. In any event it could be suggested that not only does the HE sector generate employment, but it tends to generate higher skilled employment than that in the UK as a whole.
Higher education activity and diversification of the income base
While the overall portfolio of fundable activities in which HEIs engage has not changed substantially in the four year period between this study and its predecessor, there is considerable evidence that HEIs are rapidly diversifying sources of income to support these activities.
Between 1995/96 and 1999/2000, the proportion of public sector income to the HEIs has fallen from 73% to 63%, with private sector income moving from 19% to 27%. Overseas income as a proportion of all HEI income has increased from 8% to 10%.
Given the increasing diversification of the sources of HEI income highlighted in this report, it could be suggested that more attention may need to be paid in the future to the higher education sector as an important UK industry.
Acknowledgements
Thanks to Stewart Dunlop of the Fraser of Allander Institute, University of Strathclyde, for helpful comments at various stages of the study and to Donald McLellan of the Economics Department for his assistance in data compilation.
Particular thanks must go to all of the Higher Education Institutions that completed and returned the study questionnaire, without which key aspects of this study could not have been undertaken.
Methodology and model specification
Part 1: Construction of balanced industry-by-industry UK input-output tables
The model was constructed using an extended Input-Output (IO) framework that measures both the impacts upon the economy and the demand for skilled employment. The economy and the labour market were constructed as two distinct but linked components.
Information on industry linkages between domestic sectors and outside of the UK was drawn from the 1998 IO accounts to form the basic IO model. Information on the skilled occupational, social class and qualified profile of industrial employment was drawn from the Labour Force Survey (LFS) and the Annual Business Inquiry (ABI) to form the extended labour market component. The Office for National Statistics (ONS) compiled both the LFS and the UK IO accounts.
The UK accounts included a table showing the purchases of all goods and services made by domestic industrial sectors; this was called the use table. A second table showed the purchases of all goods and services by UK final markets such as consumers’ expenditure and exports.
To construct an IO model the import content of the above purchases had to be removed to provide estimates of domestic purchases. This was undertaken for all domestic industrial sectors and all final demand markets except exports. Import penetration coefficients were calculated for all goods and services. The value of the coefficients was the ratio of total purchases of imports divided by total purchases for all goods and services. This is shown in (1) below:
By multiplying the final demand markets and use table by the vector of import penetration coefficients, a set of domestic final demand markets and use table can be estimated. This is shown in (2) and (3).
The resulting matrices x, f, and a set of purchases of primary inputs, including the separated imports, gave the domestic use table. To produce a table of industrial sector purchases from industries, the domestic use table needed to be multiplied by a make table.
The make table shows the value of all the goods and services produced by each industrial sector. Unfortunately the 1998 UK make table was not made publicly available and therefore had to be estimated. Data for the share of a sector’s principal product from total production within the sector was available. Information on secondary and by-products was not published.
However a fully balanced industry by industry table for 1998 Scotland was available. Therefore UK non-principal production for each sector was distributed to secondary and bi-products on the same basis as for Scotland. This was reasonable as the non-estimated principal production for 104 of the 123 UK sectors accounted for 80% or more of total production.
Matrices
X
,Y
and the set of purchases of primary inputs provided the domestic industry by industry table. Although the table now provided the required inter-industry transactions it was not balanced. That is, the sum of purchases by each sector (domestic and primary inputs purchases) did not equal the sum of sales by each sector (domestic and final demand market sales).A RAS procedure was applied to the matrices
X
ij andY
lk , the set of primary inputs including imports was assumed to be correct. The total sales for each sector were constrained to the value of total sectoral purchases. Then the total domestic purchases were constrained to the value of total sectoral purchases minus purchases of primary inputs. This iterative process was repeated until the difference between the RAS produced total sectoral sales and total sectoral purchases, from the original accounts, was less than 0.5% for all sectors.Part 2: The extended labour market input-output model
The basic UK input-output balance equation is:
Appendix Three
Index of tables and charts
Figure 1: Estimated sources and purpose of income to UK HEIs 1999/2000 Page 11 Figure 2: UK HEI income by source 1999/2000 Page 12 Figure 3: HEI income by purpose 1999/2000 Page 12 Figure 4: Sectoral gross outputs (1998) Page 13 Figure 5: Comparison of HEI income by purpose between 1995/96
and 1999/2000 Page 13
Figure 6: Comparison of the proportion of HEI income by source between
1995/96 and 1999/2000 Page 14 Figure 7: Percentage of income by source as a proportion of that type
of income 1999/2000 (1995/96 figures in brackets) Page 14 Figure 8: Estimated employment in UK HEIs 1999/2000 Page 16 Figure 9: Comparison of HEI and UK occupational structures Page 17 Figure 10: Comparison of skills profile of HEI employment and the UK as a whole Page 18 Figure 11: Summary breakdown of UK HEI expenditure 1999/2000 Page 20 Figure 12: Output generated in the UK by the activity of UK HEIs Page 22 Figure 13: Total output generated by UK HEIs 1999/2000 Page 23 Figure 14: Total Output generated by UK HEIs by sector Page 23 Figure 15: Household income generated by HEI activity Page 24 Figure 16: Total household income generated in the UK economy by HEIs
1999/2000 Page 24
Figure 17: Employment generated by UK HEIs 1999/2000 Page 25 Figure18: Occupational profile of employment generated by UK HEIs
1999/2000 Page 26
Figure 19: Secondary employment created by HEIs, by sector Page 26 Figure 20: Comparator multipliers for HEIs with selected other UK industries Page 27 Figure 21: Impact of overseas student and overseas visitor expenditure
1999/2000 Page 29
Figure 22: Overall impact of the UK higher education sector on the UK economy Page 30 Figure 23: Skill profile of HEI employment, knock-on employment generated
List of survey respondents
01. University of Aberdeen
02. University of Wales, Aberystwyth 03. University of Wales, Bangor 04. University of Bath
05. University of Birmingham 06. University of Brighton 07. University of Bristol 08. University of Cambridge 09. Cardiff University
10. Cheltenham & Gloucester College of Higher Education (University of Gloucestershire) 11. City University
12. Coventry University 13. De Montfort University 14. University of Derby 15. University of Dundee
16. The University of Edinburgh 17. University of Essex
18. University of Exeter 19. The University of Glasgow 20. Glasgow Caledonian University 21. Heriot-Watt University
22. University of Hertfordshire 23. University of Huddersfield 24. The University of Hull 25. Kingston University 26. Lancaster University 27. University of Leeds
28. Leeds Metropolitan University 29. University of Leicester
30. London Guildhall University
31. London School of Economics and Political Science 32. University of Luton
33. University of Manchester
34. The Manchester Metropolitan University 35. Middlesex University
36. Napier University
37. North East Wales Institute of Higher Education 38. University of North London
39. University of Northumbria 40. University of Nottingham 41. University of Oxford 42. University of Paisley
43. University of Plymouth
44. Queen Mary, University of London 45. Queen’s University, Belfast
46. The University of Reading 47. The Robert Gordon University 48. Royal College of Music
49. The Royal Veterinary College, University of London 50. The University of Salford
51. Sheffield Hallam University 52. The University of Sheffield 53. University of Strathclyde
54. University of Surrey Roehampton 55. University of Wales, Swansea 56. University of Teesside
57. University of Ulster 58. UMIST
59. University of Wales, College of Medicine 60. The University of Warwick
61. University of Westminster 62. University of Wolverhampton 63. The University of York
Universities UK study: Economic aspects of UK higher education
For the financial year 1999/2000
All returned questionnaires will be treated in confidence.
Institution
Questionnaire completed by
SECTION 1: Staff data
I. Please give the numbers of staff in each of the following categories:
Appendix Five: Survey Questionnaire
Category Full-time Part-time
Senior management
Other management/administration
Teaching professionals Research staff
Secretarial and clerical
Laboratory technicians/assistants
Security
Janitorial and cleaning
Residence/catering staff
Maintenance staff/trades e.g. electricians/joiners
Other, labourers/gardeners etc
All other staff (please specify)
TOTAL
SECTION 2: Income data financial year 1999/2000
I. Total Income
Where it is not possible to exactly identify the split between UK public sector and UK private sector or overseas/EU, please give your ‘best guess’ estimate.
Please also indicate if possible the total amount of means-tested tuition fees paid directly to the University by individual UK/EU students
Are these fees included above in ‘UK public sector’ or ‘UK private sector’?
Please return this questionnaire by Friday 12 October or as soon as possible thereafter to:
Ursula Kelly
Policy and Communications Officer Information Resources Directorate University of Strathclyde
Alexander Turnbull Building 155 George Street
Glasgow G1 1RD
Tel: 0141 548 4206 Fax: 0141-553 4121
Email: u.kelly@mis.strath.ac.uk
(£ 000) for:
Source UK private UK public Rest of EU Other TOTAL sector sector overseas INCOME
Funding council grants
Academic fees & support grants
Research grants & contracts
Other services rendered
Other general operating income
Endowment income & interest receivable
Callender and Kemp Changing Student Finances: Income, Expenditure and the Take-up of Student Loans among Full and Part-time Students in 1998/99 DfEE 2000
Higher Education Statistics Agency Resources of Higher Education Institutions 1999/ 2000 (HESA 2001)
Higher Education Statistics Agency Students in Higher Education Institutions 1999/2000
(HESA 2001)
Higher Education Statistics Agency HE Finance Plus 1999/2000 (HESA 2001)
ONS Travel Trends 1999 The Stationery Office 2000
McNicoll, McCluskey & Kelly The Impact of Universities and Colleges on the UK Economy
CVCP 1997
McNicoll, Kelly & McLellan Economic Aspects of Scottish Higher Education Institutions
COSHEP 1999
The Independent Review of Higher Education Pay and Conditions: Report of a Committee chaired by Sir Michael Bett The Stationery Office 1999
Our mission is to be the essential voice of UK universities by promoting and supporting their work.
Universities UK
Woburn House, 20 Tavistock Square, London WC1H 9HQ
Tel +44 (0)20 7419 4111 Fax +44 (0)20 7388 8649
Email info@UniversitiesUK.ac.uk Web www.UniversitiesUK.ac.uk