RIT Scholar Works
Theses Thesis/Dissertation Collections
1996
Post service customer satisfaction measurement
Jason KarrFollow this and additional works at:http://scholarworks.rit.edu/theses
This Thesis is brought to you for free and open access by the Thesis/Dissertation Collections at RIT Scholar Works. It has been accepted for inclusion in Theses by an authorized administrator of RIT Scholar Works. For more information, please [email protected].
Recommended Citation
by
Jason Harlan Karr
A project submitted to the
Faculty ofthe Food, Hotel and Travel Management at
Rochester Institute ofTechnology
in partial fulfillment ofthe requirements
for the degree
of
MasterofScience
(Chairperson) School of Food, Hotel and Travel Management
Department or Graduate Studies
M.S. Hospitality-Tourism Management Presentation of ThesislProiect Findin2s
Name: Jason Karr Date?/15/99 SS#:
-Title of Research: Post Customer Satisfaction Measurement
Specific Recommendations: (Use other side if necessary.)
Thesis Committee: (1) Dr. Richard Marecki
(2) _
OR (3) _
Faculty Advisor:
Number of Credits Approved: _
t
I/(lif
IDate Committee Chairperson's Signature
'If
1/11
Date Department Chairperson's Signature
Note: This fonn will not be signed by the Department Chairperson until all corrections, as suggested in the specific recommendations (above) are completed.
cc: Departmental Student Record File - Original Student
ROCHESTER INSTITUTE OF TECHNOLOGY School of Food, Hotel and Travel Management
Depart~entof Graduate Studies
M.S. Hospitality-Tourism.Management
Statement Grantin2 or Denyin2 Pennission to Reproduce ThesislProject
The author of a thesis or project should complete one of the following statements and include this statement as the page following the title page. "
I,-JCUG11
14-(. ,
hereby(gr~permisSion
to theWallace Memorial Ubrary of R.I.T., to reproduce the document titled above in
whole or part. Any reproductionwill not be for commercial use or profit.
OR
I, -', prefer to be contacted each time a
request for reproduction is made. I can be reached at the following address:
Signature
ABSTRACT
This study provides restauranteurs with information on how to
create, implement and evaluate a strategy of customer satisfaction
measurement after the service has been delivered and the
respective patrons have left the establishment. By measuring and
evaluating customers perceptions of the quality of service they
received, an organization can determine how they are doing both
internally and externally. Application of this information into the
business environments will ultimately effect the "moments of
truth"
with the customers by promoting a better organizational
understanding of the customers'
wants and needs as well as
Abstract
Chapter I - Review of the Literature
History of the Restaurant Industry The Need for Service
Total Quality Service Management Total Quality Service Measurement
Consumer Expectations, Perceptions and Attitudes
Chapter II - Statement of
Study
Statement of Purpose
Statement of Problem
Significance
Assumptions
Scope and Limitations
Hypothesis
Definition of terms
Chapter III
-Methodology and Research Design
Creation of the Service Quality Measurement Instrument
Sampling Procedures
Chapter IV - Findings
and Analysis Results of Service Satisfaction Findings
Results of Demographic/Frequency Findings
Chapter V - Conclusions
Summary of Results
Conclusions
Tables Statement 1 Statement 2 Statement 3 Statement 4 Statement 5 Statement 6 Statement 7 Statement 8 Table 1.1 Table 1.2 Table 1.3 Table 1.4 Table 1.5 Table 1.6 Table 1.7 Table 1.8 Table 2.1 Table 2.2 Table 2.3 Table 2.4 Table 2.5 Table 2.6 Table 2.7 Appendix 1
Section #1 Service Statement Survey
Appendix 2
Section #2 Demographic/Dining Pattern Survey
Appendix 3
Review of Literature
History of the Restaurant Industry:
Quantity cookery has existed for thousands of years, as long as
there have been large groups of people to feed such as armies. Evidence suggests that nearly 12,000 years ago tribes in Denmark
cooked food in large quantities and ate together as a group. The first cabarets (shops selling wines and liquors) were established around 4,000 B.C. and went onto flourish in the Roman and Byzantine
empires. In addition to the Cabarets, thermopoliums which served hot food and drink came into existence during this time. The
thermopoliums became the forerunner to the modern restaurant
(Gray, 1980).
Around the year 1200 A.D., public cook shops were opened in
London and provided precooked food for the customer to take home.
Another 200 years passed and the restaurant concept continued it's
metamorphosis. Certain amenities were added such as table linens,
food creations and serve in generally smaller quantities.
As America began it's colonization, the stage had been set for
many of Europe's food service concepts and ideas to be implemented.
History shows that a Samuel Cole opened what is considered to be
the first American tavern in 1634. It was in 1656 when
Massachusetts passed a law that required every town in the colony
to have a tavern or be subject to state fines. The first coffee house
was opened in 1670 and this marked the birth of the restaurant
industry in America.
In the past few decades, the restaurant industry in the United
States has grown at an unprecedented rate. The fast paced life style
of our society has created the need for a wide variety of food service
establishments. Franchise and chain organizations, serving both the
upscale and the fast food markets, have enjoyed the majority of the
growth in the past years. This massive growth has made the
restaurant industry a very competitive business environment. So
competitive, that nearly half of the independent restaurants that
are opened today are closed five years later. An independent
operation is classified as being owned by one or more parties with
no chain affiliations (Gray, 1980). Why is it that nearly 50 percent
are relatively easy/ventures to start up. They require a little
amount of capftol and land, while the facilities and equipment can be leased/ With a limited amount of credit, opening inventories may
be secured and the establishment is more or less ready to operate.
In an industry dominated by large chain and franchise
operations, where is the place for the independent operator? The answer lies in the entrepreneurs ability to spot a market whose
wants and needs are not currently being met. Once this has been
established, the operation needs to provide a value and level of
service that consistently out paces the customers expectations.
Consumer perceptions and expectations regarding specific
service factors such as the cost:value relationship, speed of service,
menu selection, ambience, and safety are the keys to a successfully
operated restaurant. It will be the operations that identify these
expectations in their environment and go on to surpass them that
will prosper. Customer expectations and perceptions are an
omnipotent force in any business setting. If they are not
acknowledged and benchmarked as a standard of service, it can
result in a loss of business.
More often than not, the customer of a restaurant doesn't even
effect the customers decision in whether or not to return to that
particular restaurant. It can also effect their decision on whether to
recommend the establishment to their peers, and to the smaller,
independent restauranteur with a limited budget, word of mouth
advertising is their primary source of exposure.
What this amounts to is that restaurant owners/operators are
extremely interested in what service essentials were or were not
met in the customers dining experience. The profitability and
productivity of the restaurant depends on their ability to meet or
exceed these expectations. With this in mind, the successful
restauranteur will need certain tools which will enable them to
illustrate the strengths and weaknesses of their service delivery
network. The following study utilizes a smaller sized, fine dining
independent restaurant located in Rochester, New York which is
doing just that.
The Need for Service
"Customer service is a set of activities preformed in a company
that interacts with it's customers, to ensure their satisfaction with
the company's product's or
services"
today. There is a multitude of literature concerning the customer
service issues and how to implement better service to the customer,
yet, some organization's have yet o realize the importance.
Service is important for the following reasons (Disend, 1991):
(1) Customer expectations are higher than ever before.
(2) The service industry is growing.
(3) Competition keeps increasing.
(4) Service quality means repeat business.
(5) Quality service is profitable.
As the United States shifted from a manufacturing focus to a
service focus, customers demanded specific kinds of products and
services. Consumers now have the ability to get what they want,
the way they want it (Albrecht, 1990).
In todays competitive economy, every service organization
should strive to obtain service excellence. "Service excellence is a
level of service quality, compared to your competitors, that is high
enough in the eyes of your customer that it enables you to charge a
higher price for your product, gain an unnaturally large market
share, and/or enjoy a higher profit margin than your
competitors"
(Albrecht, 1988).
management. "Service management is a total organizational
approach that makes quality of service, as perceived by the
customer, the number one driving force for the operation of the
business"
(Albrecht, 1988).
Quality service delivery needs to be the primary focus in every
aspect of a business. Policies, procedures, facilities, and every
employee should be developed in order to meet customer needs (Disend, 1991). A customer can be an appreciating asset, one that
grows in value over time. These results come from providing
customer satisfaction, which in turn creates customer loyalty (Albrecht, 1988).
In 1988, a leading management consultant, Karl Albrecht, developed what considered the essential outline of a service
management initiative called the "Service Triangle". It is a visual
illustration of the whole service management philosophy, and is
recognized throughout world wide business circles. The "Service Triangle"
involves three essential parts (Albrecht, 1988).
1. A vision or strategy for the service product.
2. Customer oriented front-line people.
element which is the customer. All three mechanisms must be
operating as cohesive whole to ensure quality service delivery. The
customer is the apex of the model. It underlines the fact that an
organization needs to understand their customer so that they can
meet and exceed their needs. Today, the need for quality service is the primary demand of the learning consumer.
Total Quality Service Management
In "Service America"
by Karl Albrecht and Ron Zemke, the
issue of total quality service management is summed up by the
saying, "service is now the business of business in America". In
today's highly competitive global economy, it is the organizations
that provide the highest level of service, both tangible and
intangible, that will survive and prosper into the next century. "The
capacity to serve customers effectively and efficiently is an issue
every organization must face. No one can evade this challenge:
manufacturers and traditional service providers, profit making and
nonprofit organizations, private sector and public enterprises must
all face the task of responding effectively and efficiently to
of every purchase". (Albrecht & Zemke, 1985)
The Total Quality Management or Service philosophies can be
identified in some shape or form in the majority of hospitality
operations as well as other industries today. It began to become
popular in the 1970's and is flourishing among industries today.
Organizations that employ it's customer driven operating
philosophies are seen to have a strategic operating advantage.
Dan Ciampi (1992) states that Total Quality may be described
in at least three distinct ways. The first of which is by describing
the unifying principle that is the basis for all strategy, planning and
activity in an organization that utilizes this philosophy. That
principle being Total Dedication to the customer (Ciampi, 1992).
The second means of defining Total Quality is to illustrate the
benefits or results of a Total Quality initiative. These results may be
categorized in four categories: increased customer loyalty,
decreased response time to issues and problems as well as decreased
costs, a positive and productive work environment, and a general
ethic of continuous improvement (Ciampi, 1992).
The final means Ciampi uses in describing Total Quality is to
illustrate the tools, techniques and procedures that are employed to
yield the Total Quality benefits or results. In short, to describe the
internal and external customer satisfaction and development
programs, traditional quality control and assurance mechanisms,
Just-In-Time management techniques, and visionary, team oriented
leadership (Ciampi, 1992).
To further simplify the workings of the Total Quality principles,
it can be stated that there are two primary components, one
technical and the other people related. They have been combined to
create this powerful organizational excellence paradigm of the
1990's (Ciampi, 1992). This Total Quality Service paradigm involves
complete organizational centering around customer needs and wants
(Albrecht, 1992). Albrecht also states that everything an
organization does should revolve around creating a superior and
beneficial Customer Value Package for the consumer.
A critical element to the Total Quality process is the ability of
the organization to take the customers perspective because in the
final analysis, quality is what the customer says it is. "Customers
make quality judgments based not on a detailed reading of the
supplier's operation specs, but on a much more impressionistic scale:
'Did you or didn't you give me what I thought I was paying for? Did
you or didn't you meet my
expectations?'"
(Ciampi, 1992) This is
measurement (SQMS - Service
Quality Measurement System) of
customer (both internal and external) satisfaction to identify the
strengths and weaknesses of the organization's service delivery
format (Albrecht, 1988). Constant and accurate measurement of
these satisfaction factors forces a company to relinquish it's
assumptions of what their customers want and to deal with the
actual consumer need and want set (Albrecht, 1988).
Total Quality Service Measurement
A Total Quality Service Measurement program will allow an
organization determine how well the business process is working,
know where to create improvements or make changes, if changes
are needed, and determine if the changes led to improvement
(Hayes, 1992). Various measurement techniques in the Total
Quality environments can index businesses products, services and
processes. For the most part, measurements of quality typically
focus on the hard or soft indices, often referred to as the tangible or
the intangible aspects of service quality. (Hayes, 1992).
A Service Quality Measurement System is one of the significant
bonds between the organization and the customer because it
(Albrecht, 1988, Heskett, Sasser, & Hart,1990). Many aspects in
an organizations operating environment may be very volatile, and
one of those is the every changing wants and needs of the customer.
An organizations success depends largely on their ability to stay
abreast of these changes. It is for this reason that measurement
must be institutionalized by an organization to be truly effective.
The measurement effectiveness depends on how consistent and
comprehensive it is. Only by monitoring the established services
and processes can a operation know if introduced changes and daily
performance levels are effective and meeting stated objectives.
(Richardson, 1992).
There exist a variety of means by which an organization can
effectively measure the quality of services that it delivery's to it's
customers. They include one on one interviews, focus groups,
comment cards, questionnaires, suggestion boxes, benchmarking,
telephone surveys and simply observing and listening.
Consumer Expectations, Perceptions & Attitudes
Customers perceptions of the quality of a service and their
overall satisfaction, or dissatisfaction, have some observably
indicators. The terms often used, "customer
satisfaction"
"perception of quality are labels that are used to summarize a set of
observable actions related to the product or service rendered
(Hayes, 1992).
By having a Total Quality Service Measurement system in
place, an organization can draw conclusions and make decisions
concerning a customers perception. This is accomplished by
examining observable manifestations related to a product or service.
(Hayes, 1992). In this research project, the observable
manifestations are the responses given on the customer satisfaction
questionnaire.
Expectations, perceptions and attitudes of consumers are as
unique and varied as the individuals who possess them. Customer
expectations can actually be divided into three distinct categories:
desired
-what is wanted
adequate what is considered adequate
predicted what is believed will occur (Zeithaml et al., 1993)
Ron Zemke (1989) states that that there are five operating
principles of distinctive service, the first of which is to "Listen,
Understand, and Respond to the Customers". When organizations
continuously listen carefully to the customers and understand what
they are saying as it applies to the business of serving them, they
In the "Service Edge", Ron Zemke (1989) highlights four
reasons for listening to the customers
- to
understand the "moments of
truth"
-to keep tabs on the market's - the
aggregate of the
individual customers'
changing wants needs and expectations
- to hear the
unexpected ideas customers and those who work
for them can bring to an organization
-listening carefully is a valuable way to bring the customers
into the business
In their perceptions and expectations literature, Zeithaml et al.
(1993) discuss a "zone of
tolerance"
which refers to the level of
service that consumers consider acceptable during a given service
encounter. The customer zone of tolerance is specifically concerned
with the availability and accessibility of perceived options for
parallel services and products. In other terms, the consumer zone
of tolerance becomes smaller as the perceived choices become
greater. On todays competitive business environments,
organizations must consistently offer outstanding service delivery in
the eyes of the consumer. This is due to the fact that there are
numerous viable competing alternatives to the consumer.
As the consumer zone of tolerance shrinks, it becomes more
time (Parasuraman et al.,1991). Service recovery can be costly and
time consuming and the best course of action is for a business to try
and avoid the need to perform it altogether (Rosander, 1985;
Albrecht, 1992; Zeithaml et al., 1993).
A service
"gap"
will occur when the consumer perceptions are
not aligned with their expectations, that is, the perceptions fall
short of the expectations. (Zeithaml et a., 1988, 1993). Thus, it can
be said that the degree to which a customer is satisfied with a
product or a service depends largely on the size of the gap between
what they expected to occur and what they perceived to have occur.
This is a phenomenon that many of today's leading management
scientists refer to as gap management and the significance it plays in
a service providers operating environment.
When a service provider reaches a point when a standard or
level of expectation has been established, it then must gauge what
the actual post service perception of the customer is. As reported in
the Total Quality Service Measurement section, there are a variety
of means by which this may be accomplished: face to face, formal
research, frontline contact, customer hot lines, comment and
complaint analysis, consumer advisory panels, and mutual
education (Zemke, 1989).
correlation with the type of service or product that is being
delivered. Many sources site that value, or price, play a significant
role in the establishment of consumer expectations of a service or
product. The more that is paid for a service, the greater are the
expectations associated with that anticipated service ( thus, inferring
that the higher the cost of service, the higher the quality from the
customer viewpoint) (Barsky, 1992; Parasuramann et al., 1991).
However, this correlation between price and perception must not be
interpreted that poor service is justified in low cost situations. Poor
Chapter II
STATEMENT OF THE STUDY
Statement of Purpose:
The purpose of this study is to provide the restaurant industry
with a useful customer satisfaction measuring instrument which
examines customers perceptions of the quality of service they
received as well as defining the demographics of the customer base.
By having customers identify areas of service satisfaction and
dissatisfaction, restaurant establishments are able to obtain a better
understanding of customers wants and preferences. By establishing
and understanding customer demographics, an organization can
determine potential wants and needs. This information should help
optimize organizational effectiveness and customer satisfaction.
Understanding the customers perceptions and expectations of quality
service can help the organization identify areas of operation which
are meeting or exceeding customers standards or areas that
In todays competitive economy, it's vitally important to listen
to and respond to your customers. This will lead to a profitable and
positive organizational environment where the customers are
pleased with the service they received and the employees are
pleased with the money they are making.
Numerous objectives existed for this study but the primary
goal was the development of a service evaluation form designed
specifically for a smaller sized, fine dining establishment. The form
was completed by customers who had just concluded their dining
engagement. It was focused towards rating the restaurant on
specific performance categories related to the quality of the
customers dining experience. The purpose of the evaluation form
was to illustrate to the restaurant the specific areas in which they
were performing at quality levels as well as those that required
improvement. The demographic section was designed to illustrate
the locations of the customer base, establish dining patterns and
isolate the means by which the restaurant was discovered.
Statement of Problem
How does a restaurant identify the areas of service which are
consistently measure the services provided to assure uniform delivery?
Significance
The majority of the hospitality market has witnessed
phenomenal growth in all facets of the industry. This has created an over supply of hospitality service providers in many markets,
including restaurants. The result is that many of these institutions
are competing for the same customers. In order for the smaller, independent restauranteur to successfully compete in an industry
saturated with large chain/franchise operations, a strategic service vision and delivery system needs to be created and implemented on
a continual basis.
Due to the fact that many of the independent operators have a
limited budget, they need to utilize every means possible to
establish if the needs and wants of their patrons are being met. This
study will provide a cost effective survey, promoting
operator/customer interface in addition to attaining information on the organizations service delivery abilities, needs and successes.
The innovation of this study is found in several distinct areas.
The Triphammer Grill. The creation of the service oriented questions
were based largely upon the works Albrecht, Bradford, Heskett,
Sasser, Hart and Ciampi whose works typically focus on the
measurement of service delivery systems, expectations,
perceptions, research and measurement.
Secondly, the survey solicits information about the customer
themselves such as dining frequency, purpose, cuisine preferences
and demographics. The significance being that knowing "who" your
customers are is just as vital as knowing "what" your customers
want and expect.
Ideally, the survey will highlight who the customers are and
what the expect of the Triphammer's service abilities. It is also
designed to create service dialogue amongst the owners, staff and
the customers themselves. A catalytic mechanism used to orient the
owners and employees with the wants and expectations of the
customers.
Assumptions
There are several assumptions that need to be addressed with
the implementation of any service questionnaire. The first is that
opinion, preferences or outside influences that are not relevant to
service critique objectives. An example may be that a patron on a
business lunch is not accurate in the service evaluation because the
purpose of the business luncheon was not achieved. This may reflect
on the questionnaire an instance of negative service delivery when
in actuality, influences outside the restaurants control where
effecting the service critique.
The second assumption is that the staff and ownership possess
a genuine concern for the delivery of quality services to the
customers. That is, there needs to be a consistency and constant
level of service standards in order to reflect effective or ineffective
service delivery.
Scopes and Limitations
This research project focused primarily on the formulation of
and effective questionnaire geared for the small, independent
restaurant with a limited budget. The end result being the
compilation of data which can easily be run through the SPSS
statistical software package. This in turn will provide an objective
view from the customers vantage point as to the effectiveness of the
expectations. Encompassed in the questionnaire is also a brief series
of questions designed to give a snapshot view of the type, origin and dining patterns of those patrons.
The primary limitation of this research project was that the
survey instrument was handed out during the course of the business day. Therefore, completion of the questionnaire was voluntary. The
result being that some customers may not have filled out the
questionnaire. In some instances, this could result in a certain server being evaluated, a certain menu item, or a particular period
of service such as lunch, dinner or happy hour.
The second limitation was that total commitment from the
service staff may at times be questionable. The factors being that a completed questionnaire with some negative service evaluations
may be viewed by the service provider as being detrimental to their
employment tenure. It might also be that the service provider
simply does not feel comfortable handing out a questionnaire. It
may be viewed as slowing up their ability to "turn over"
the table.
Hypothesis:
From this study, I believe the viability of a service/population
apparent. I feel that many small operations are of the impression
that an examination of their patrons is either to costly, not
necessary or beyond their capacity. Customer expectations are not
easily meet, but are a vital part of a business environment, no
matter what the size of that business. By becoming aware of your
patrons likes and dislikes, the reason they came to your
establishment, and where they came from, can mean the difference
between being a mediocre service provider and being an outstanding
service provider.
Definition of Terms:
Fine Dining Restaurant
-a full service, refined dining establishment
with prices ranging from moderately expensive to very expensive.
Key Service Quality Attribute - a tangible and measurable aspect of
a dining establishment, as perceived by the customer. (Albrecht &
Bradford)
"Moments of
Truth"
- all instances in which the customer comes into
contact with a service establishment and/or it's representatives and
Cycle of Service - the "complete
sequence of the moments of truth a
customer
experiences"
in the process of getting some need/want
fulfilled. (Albrecht, 1992)
Perceptions - what the
customers believed to have actually
transpired during a dining/service encounter.
Qualitative Research - research that
explores, in-depth, the
attitudes/feelings of a small, sample population and produces
findings which are not statistically definitive if applied to a larger
population.
Quality a measurement of the degree to which a service or product
fulfills a need, adds value for a customer (Albrecht, 1992), or
satisfies a desire.
Service a task performed by one party for the benefit of another
(Albrecht, 1992).
Service Quality "The comparison between customer expectations
and perceptions of
service"
Total Quality Service- a
complete dedication to the customer
(patrons, employees, stockholders, and suppliers) that behaves as
the single driving force in all organizational activities. (Ciampi,
1992; Albrecht, 1992).
Value- the benefit
perceived by the customer to have been
obtained or the satisfaction received from a dining experience, in
relation to the cost experience.
Value-Added the extra worth/desirability given to a
service/product by some form of augmentation; in this case,
excellent service.
SPSS-X Statistical Software A computer program which is used in
correlation with designed questionnaires to generate specific
Chapter III
METHODOLOGYAND RESEARCH DESIGN
Creation of the Service Quality Measurement Instrument
This chapter describes the steps involved in developing an
instrument that is designed to effectively measure a restaurants
service delivery system, gauge the dining tendencies of patrons,
and illustrate some customer demographics. In addition to this,
there will be discussion of the research methods employed.
Creating the Service Delivery Measurement Instrument
To create an instrument that would measure customer
perceptions about the quality of service they received as well as
other statistical facts, a culmination of items were generated from
past experiences in the restaurant industry, along with information
derived from service oriented literature.
The questionnaire was broken down in two sections. The first
upon the point at which the guest arrived at the restaurant, to when
the final check was delivered. The items were broad and general in
nature, but meant to highlight major service functions for
evaluation. The service sections items covered were:
1. Table Service Functions
2. Promptness and Attentiveness of Service
3. Services Offered
4. Range of Menu Items
5. Menu Item Temperatures
6. Menu Item Presentation
7. Atmosphere
8. Price/Value Relationship
All of these items are significant factors that affect the overall
satisfaction of a guests dining satisfaction. The items were arranged
into an eight item, seven point rating scale, the customers judged
each statement on the scale according to the degree they felt
represented their true feelings and opinions. The items on the
survey were stated in a positive fashion, so that a "strongly
agree"
or
"agree"
response reflected a positive perception to the area of
service questioned. The "strongly disagree" or
"disagree"
responses
reflected a negative perception of the service questioned.
For evaluation purposes, the questionnaire was divided into
two sections. The second section asked for demographic information
such as age, sex, occupation and place of employment or residence.
In addition to the demographic questions, it was also surveyed at
what time period the patron visited the restaurant, dining
frequency, favorite type of cuisine and means by which they heard
of the restaurant. (Appendix #2)
Concluding the two survey sections was an area for addition
comments and suggestions. This is an important aspect of any
satisfaction measuring instrument because it allows the survey to
address any issues which may not be covered in the surveying
questions.
Upon completion of the survey instrument, a pilot testing was
decided against. Typically, a pilot test from a small sample of
customers would have been utilized to access and rectify ambiguous
questions, readability problems and response clarity. However, it
would not be suitable to subject actual patrons to anything other
than 100% percent. One must be careful not to create dissatisfaction
when attempting to evaluate satisfaction, therefore, the instrument
was reviewed by a number of hospitality professors, restaurant
managers and employees, who all made various suggestions until
survey is clear and concise, examining broad topics and general
concerns, which if utilized by the establishment in question, can
pinpoint areas of satisfaction and dissatisfaction.
Sampling Procedures:
The service personnel delivering the questionnaire were
briefed prior to the implementation of the study. The purpose of
this was to create a standard dialogue that explained the purpose of
the survey to the customers. The briefing was meant to familiarize
the personnel with the questionnaire so that they could answer
potential questions the customers may have concerning the survey.
In addition to the briefing, written instructions were placed on the
cover page (Appendix #3) and at the beginning of both sections for
the customer to read.
It was emphasized to the servers not to "push" the
questionnaire on the customers. Many diners frequent the
Triphammer Grill for business purposes and in some instances, it
may not be appropriate for the diners to complete a questionnaire.
Whenever an establishment attempts to survey their customers,
precaution must be exercised so that resulting action is a dissatisfied
With the final instructions in mind, the service personnel
distributed the questionnaires were over a two week period, from
February 1st, 1995, to February 14th, 1995. Typically a slower
time of year at the restaurant, compared to the summer season,
resulted in 121 surveys being completed. An estimated 200 guests
visited the restaurant during this time period producing an
CHAPTER IV
FINDINGS AND ANALYSIS
The following represents the results of the distributed
questionnaires. The chapter is divided in two sections corresponding
to the survey. The first illustrates the completed results of the
service analysis, while the second highlights the demographic data
and dining frequencies of the questionnaire respondents.
Results of the Service Satisfaction Findings
The design of the first section of the survey was such that the
customer would respond to a statement posed by the extend to
which they agreed or disagreed to that statement. The scale being
from one through seven. A response of one (1) represented strong
disagreement with the statement where as a response of seven (7)
represented strong agreement with the statement. The following
format was utilized in eight questions or statements comprising the
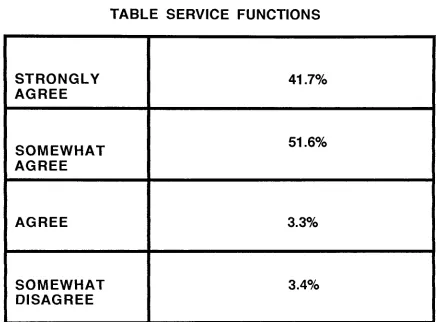
Statement #1: "The server performed table service V*
functions at a satisfactory level". (Table #1.1)
\
^^
\^In response to this statement, 41.7% of the customers
'strongly
?agreed", 51.6 % "somewhat agreed", 3.3% "agreed", while 3\l%
"somewhat disagreed".
Statement #2: "The service was prompt and attentive".
(Table #1.2)
The responses to the second statement resulted in 40.8% of the
customers "Strongly Agreed", 47.5% "Somewhat Agreed", 6.7%
"Agreed", and 5.0% "Somewhat Disagreed".
Statement #3: "The services offered at the Triphammer
Grill met my needs". (Table #1.3)
In the third statement, 44.6% "Strongly Agreed", 47.9%
"Somewhat Agreed", 5.0% "Agreed", and 1.7% "Somewhat
Disagreed".
Statement #4: "The range of menu items offered met my
expectations and needs". (Table #1.4)
The fourth declaration solicited the following responses, 24.2%
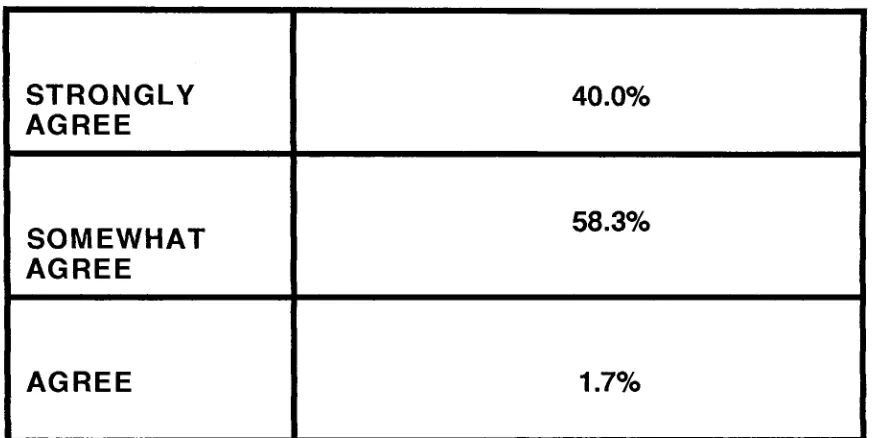
Statement #5: "Menu items were served at appropriate
temperatures". (Table #1.5)
In the fifth category, 1.7% "Agreed", 58.3% "Somewhat
Agreed", and 40.0% "Strongly Agreed".
Statement #6: "Menu items were presented in an attractive
manner". (Table #1.6)
In the sixth statement, 5.0% responded that they "Agreed",
51.6% "Somewhat Agreed", while 43.3% "Strongly Agreed".
Statement #7: "The atmosphere of the Triphammer Grill
met my expectations". (Table #1.7)
In the seventh statement, 6.6% of the customers responded
that they "Somewhat Disagreed", 1.7% "Agreed", 52.5 "Somewhat
Agreed", while 39.2% stated that they "Strongly Agreed".
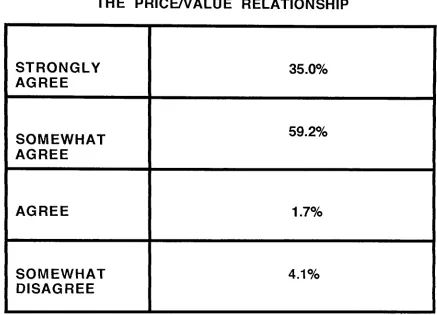
Statement #8: "The price/value relationship met my
expectations". (Table #1.8)
In the final statement of the service oriented section, 4.1%
"Somewhat Disagreed", 1.7% "Agreed", 59.2% "Somewhat Agreed",
and 35.0% "Strongly Agreed".
Results of the Demographic/Frequency Findings.
questions. In brief, it was designed to establish dining patterns,
place of residence or business, and pinpoint how the restaurant was
discovered. Questions five through eight are meant to provide
statistical significance in the survey. In general, it is convenient to
know the gender of the majority of your customers, age groups and
occupations. However, in this survey the decision to include these
questions was based on the potential to use T-tests in the X-SPSS
program which in the end was not done.
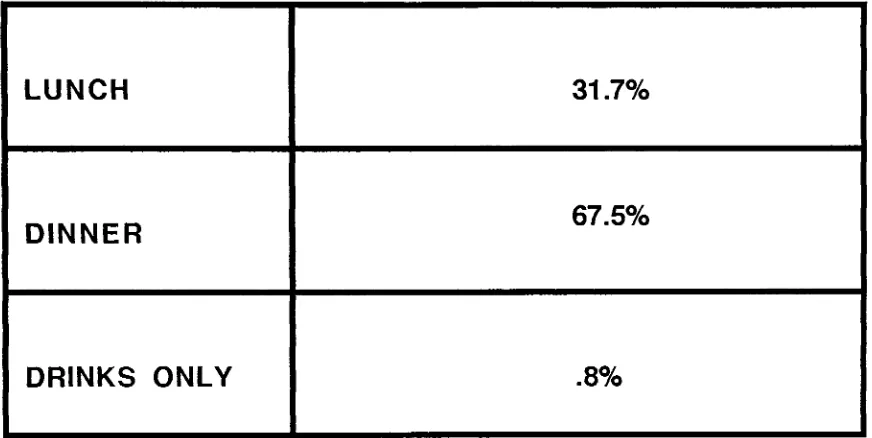
The first question which dealt with the dining period at whichthe
customers frequented the Triphammer Grill. Overwhelmingly,
67.5% the customers surveyed were during the dinner period. There
presentation during lunch was 31.7%, while "drinks
only"
accounted
for .08%. (Table #2.1)
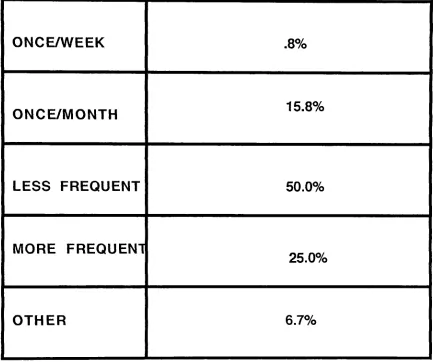
The second question established the frequency that the
particular customer dines at the Triphammer Grill. There were five
potential answers:
1. Once a Week
2. Once a Month
3. Less Frequent
4. More Frequent
5. Other
was the case, 15.8% visited the restaurant "Once a Month", 50.0%
indicated less frequent, 25.0% indicated "More Frequent" and 6.7%
stated "Other". (Table #2.2)
The third question asked the circumstances under which the
Triphammer was visited, for example, leisure, business or tourism.
Corresponding to the particular response in question three, the
customers were directed to four subcategories. If the customer
selected business as the circumstance for the Triphammer visit, the
subcategory asked the "Location" of the business and number of
"Business meals per week". If the customer stated the visit was for
leisure purposes, the subcategory asked the location of their
"Residence". If the customer stated that they were a tourist, they
were asked to provide the location of their hometown and state.
In response to the third question which again was the
circumstances surrounding the dining, 34.2% indicated "Business",
61.7% indicated "Leisure", 3.4% indicated "Other", and .07 indicated
"Tourist". (Table#2.3)
For those customers that stated their visit was business
related, 63.3% were located within the City of Rochester, 24.2%
were from suburbs of Rochester and 12.7% indicated "Other".
(Table#2.4)
of their residences was as follows: 22.5% City of Rochester, 18.3%
Brighton, 11.7% Brockport, 1.7% Churchville, 1.7% East Rochester,
3.3% Henrietta, 7.5% Mendon, 6.7% Rush and 26.7 Other.
(Table#2.5)
There were a total of17 responses indicating Tourist to the
area. The majority, 55.8%, were from the New York City area,
27.5% were from Canada, while 16.7% indicated "other".
(Table#2.6)
The final question to be examined asked the customers the
source from which they heard about the Triphammer Grill. The
highest percentage was the newspaper accounting for 43%, next
came friends, 29.8%, then radio at 4.1%, and television at .8%.
*a''#tffcft&ei, ii5.tft-ffifcaAihe ?r^^urrait "(^ce :Months 50.0%
*-,,-;. ifetfif-mt-eil Sess %$&8&-?-2&& indicated "-Moxe ffissmieuC" imd 6 ./%
^ttfid -^Dthor". fTalbie #23)
i: :,,-. VlG^iiktrd:^^^ wJiiejs j3e
:r.^...:r2Sii!8aa_i^ .Taasiness or v-nrism.
:";-. wcusisaasjri^-m^ "iHf-the.
;^iE6r3mc^'
^c.^'-tsi-iisss-ia-l #^ i^xijjii-^umici v-^.x, the
-. _v!r.f_cateor*r-sjke_d *:l;T3cmt?on''
.of the tuisiwis-s and number f
:.-:.
-^
ri^j5^^.:^e^-.^s^^!-'fcM..- ^L^^he. euxtiKer-sf^tea .tlie .vis?..!
' - .or
iga^sc.spa-Eposes, w jufee ^&&3teg<ary .asked rthe IsGafron of [their
-> '"Residence".; If <the .cu&femerstaled that
.they ;ene a tourist,
>;
^y
-.v ":r'.
rtvjvwi---ri"n- lr..ca'aov.'
-o.". tn.re?'ovi', 7.n--: -7"
Ja)._xesp<m>s.e to AUe..Uir.vcl.-que-s tion. vvhi.e.0 <*e&,n wa-s
in^
*
-.. %
>^'7.'i--SiKhc^.53fJ-tLjiiutc"
-3.4r/r indioai.-1-.-;- "'OTma'"'. -jarl 0/ j Seated
'*. set. .St
^Of liiost v'_iM_t>Eiei.> ti,_-< 'j.uicii t!ic_i \i_.r?_ *';. bu-.'.ric--^
**...,.-! r-.:. 63-.".'?'w;"--'
U--..<!./! ^jtfjtr. the 0,\ oi koi h_>;.. (- <
v-rt-from suburbs of Rochester and 12.7'^ indicate! "Orh7r
?Table#2 4i
of adjustments are:
1. Table Service Functions
2. Attention and Promptness of Service Delivery
3. Restaurant Services offered
4. Restaurant Atmosphere
5. Price/Value Relationships
Judging from the small percentages of responses disagreeing
with several of the positive statements, simply sharing that
knowledge with the restaurant personnel may be enough to improve
results. A consistent service monitoring policy coupled with a progressive employee evaluation system are examples of
preventative action plans that can improve many service delivery environments.
The demographics of the surveyed population illustrate that the majority of the customers are there for leisure purposes. This
suggests that advertising intiatives may be focused on surrounding
businesses in an attempt to bolster that clientel. In addition, the majority of surveyed business clients came from the immediate City
of Rochester. A strategic advertising campaign aimed at businesses
in the suburbs could produce positive results for this market
segment. Suggested means of reaching this target market would be
of the recently surveyed population heard of the restaurant through
the newspaper. The ads would serve a daul purpose because the
surveyed leisure market represents similar statistics with the
majority of the surveyed population residing with the City of
Rochester.
IMPLICATIONS FOR FURTHER RESEARCH
This study provides serveral areas for continued research. The
first would be to create a database of surveyed customers. When
these customers return to the establishment, the survey would be
administered again to compare and contrast results from previous
visits. This would prove to be an effective method in measuring
whether or not service oriented changes have have had a positive
impact on the customers. This would also establish a network of
repeat customers that could be contacted through mailings or
telephone contact for special events or promotions.
Secondly, distribute the survey during the summer months
which is typically a busier season for the restaurant. This would
increase the number of responses providing more insight into
service qualities as well as demographics of a larger customer base.
same survey but seek out alternative computer programs to XSPSS.
There are several on the market that are more "user" friendly yet
provide similar results. This would make this type of project less
complex for the average restaurant and easier to implement in an
BIBLIOGRAPHY
Albrecht, Karl., (1988) At America's Service: How Corporations Can
Revolutionize The Way They Treat Their Customers. Homewood, IL:
Dow Jones Irwin.
Albrecht, Karl., Branford, Lawrence J., (1990) The Service
Advantage: How To Identify and Fulfill Customer Needs. New York:
Dow Jones Irwin.
Albrecht, Karl., (1992) The Only Thing That Matters: Bringing The
Power of the Customer into the Center of Your Business. New York:
Harper Business.
Anderson, Kristen, & Zemke, Ron. (1991). Delivering Knock Your
Socks Off Service. New York: Amacom
Babbie, Earl., (1990). Survey Research Methods. California:
Wadsworth Publishing Company
Bender, Paul S., (1976). Design and Operation of Customer Service
Berry, Leonard L., Parasuraman A., (1991) Marketing Services:
Competing Through Quality. New York: The Free Press.
Carlzon, Jan., (1987) Moments of Truth: New Strategies for Today's
Customer-Driven Economy. New York: Ballinger Publishing Co..
Ciampa, Dan., (1992) Total Quality: A User's Guide for
Implementation. Reading. MA:
Addison-Wesley Publishing Co., Inc..
Davidow, William, H., (1989). Total Customer Service: The Ultimate
Weapon. New York: Haroer & Row.
Disend, Jeffrey E. (1991). How to Provide Excellent Service in Any
Organization: A Blueprint For Making All Theories Work. Randor.
Pa: Chilton Book Company.
Dunham, Randell B., & Smith, Frank, J., (1979). Organizational
Surveys: An Internal Assessment Of Organizational Health.
Glenview, IL: Scott, Foresman
Gray, William S., & Liqori, Salvatore C, (1980) Hotel and Motel
Greenwood, Frank., (1992) "Continuous Improvements to Meet
Customer Expectations", (February 01) V43 N2 pp. 13-15.
Hayes, Bob E., (1992) Measuring Customer Satisfaction:
Development and Use Of Questionnaires. Milwaukee, WI. ASQC
Quality Press
Heskett, James L., Sasser, W. Earl Jr., Hart, Christopher W.L.,
(1990) Service Breakthroughs: Changing the Rules of the Game. New
York: The Free Press.
Morgan, Gareth., (1986) Images of Organization. California: Sage
Publications, Inc..
Myers, James H., (1991) "Measuring Customer Satisfaction: Is
meeting Expectations Enough?", Marketing Research. (December)
pp.35-43.
Parasuraman, A., Berry, Leonard L., Zeithaml, Valerie A., (1991)
"Understanding Customer Expectations of Service", Sloan
Peters, Tom., (1987) Thriving On Chaos: Handbook For A
management Revolution. New York. HarperCollins Publishers.
Rategan, Cathie., (1992) "Total Quality Management". Journal of
Property Management. (September 01), V57 N5 pp.32-34.
Reich, Robert, B., (1992) The Work of Nations. New York: Vintage
Books.
Richardson, Helen L., (1992) "Do You Know What Your Customers
Want?", Transportation and Distribution. (September 01) V33 N9
pp.40.
Senge, Peter M., (1990) The Fifth Discipline: The Art and Practice of
the Learning Organization. New York: Doubleday.
Townsend, Patrick L. (1992). Quality in Action: 93 Lessons in
Leadership. Participation. and Measurement. New York: J. Wiley.
Wheatley, Margaret, J., (1992). Leadership and the New Science:
Learning about Organizations from an Orderly Universe. California:
Zeithaml, Valerie A., Berry, Leonard L., Parasuraman, A., "The
Nature and Determinants of Customer Expectations of Service",
Journal of the Academy of Marketing Science. (Winter) V21 pp.1-12.
Zeithaml, Valerie A., Parasuraman, A., and Berry, Leonard.,
(1990). Delivering Service Quality: Balancing Customer Perceptions
TABLE #1.1
TABLE SERVICE FUNCTIONS
STRONGLY AGREE
41.7%
SOMEWHAT AGREE
51.6%
AGREE 3.3%
SOMEWHAT
DISAGREE
[image:52.556.52.489.98.420.2]TABLE #1.2
PROMPT AND ATTENTIVE SERVICE
STRONGLY AGREE
40.8%
SOMEWHAT AGREE
47.5%
AGREE 6.7%
SOMEWHAT DISAGREE
[image:53.556.52.489.86.420.2]TABLE #1.3
RESTAURANT SERVICES
STRONGLY
AGREE
45.0%
SOMEWHAT
AGREE
48.3%
AGREE 5.0%
SOMEWHAT
DISAGREE
TABLE #1.4
RANGE OF MENU ITEMS
STRONGLY
AGREE
24.2%
SOMEWHAT
AGREE
67.5%
[image:55.556.54.490.130.349.2]TABLE #1.5
CUISINE TEMPERATURE
STRONGLY AGREE
40.0%
SOMEWHAT AGREE
58.3%
[image:56.556.54.490.130.349.2]TABLE #1.6
MENU ITEM PRESENTATION
STRONGLY AGREE
43.3%
SOMEWHAT
AGREE
51.6%
TABLE #1.7
RESTAURANT ATMOSPHERE
STRONGLY
AGREE
39.2%
SOMEWHAT
AGREE
52.5%
AGREE 1.7%
SOMEWHAT DISAGREE
[image:58.556.56.490.129.421.2]TABLE #1.8
THE PRICE/VALUE RELATIONSHIP
STRONGLY AGREE
35.0%
SOMEWHAT AGREE
59.2%
AGREE 1.7%
SOMEWHAT DISAGREE
TABLE #2.1
DINING PERIODS
LUNCH 31.7%
DINNER 67.5%
TABLE #2.2
DINING FREQUENCIES
ONCE/WEEK .8%
ONCE/MONTH 15.8%
LESS FREQUENT 50.0%
MORE FREQUEN1
25.0%
TABLE #2.3
CIRCUMSTANCES FOR TRIPHAMMER GRILL VISIT
BUSINESS 34.2%
LEISURE 61.7%
TOURIST .7%
OTHER
[image:62.556.56.487.135.423.2]TABLE #2.4
BUSINESS LOCATIONS
CITY OF
ROCHESTER
63.3%
SUBURBS 24.2%
[image:63.556.55.488.66.351.2]RESIDENCE LOCATIONS
57
CITY OF
ROCHESTER 22.5%
BRIGHTON 18.3%
BROCKPORT 11.7%
CHURCHVILLE 1.7%
EAST
ROCHESTER 1.7%
HENRIETTA 3.3%
MENDON 7.5%
RUSH 6.7%
[image:64.556.50.489.65.713.2]TABLE #2.6
TOURIST LOCATIONS
NEW YORK CITY 55.8%
CANADA 27.5%
[image:65.556.52.491.104.347.2]TABLE #2.7
HOW CUSTOMERS HEARD OF THE RESTAURANT
NEWSPAPER 43%
FRIENDS 29.8%
TELEVISION .8%
[image:66.556.53.488.123.424.2]APPENDIX #1
Section I: Triphammer Service
Please indicate the extent to which you agree with the statement by circling a
numberfrom 1-7. One (1) is thelowest value, and seven (7) is thehighest
value.
1) The server performed table service functions at a satisfactory level.
Strongly Strongly
Disagree 12 3 4 5 6 7 Agree
Comments
2) Theservice was prompt and attentive.
Strongly Strongly
Disagree 12 3 4 5 6 7 Agree
Comments
3) The services offered atthe Triphammer Grillmet my needs.
Strongly Strongly
Disagree 12 3 4 5 6 7 Agree
Comments
4) Therange of menu items offered met my expectations and needs.
Strongly Strongly
Disagree 12 3 4 5 6 7 Agree
Comments
5) Menu items were served at appropriate temperatures.
Strongly Strongly
Disagree 12 3 4 5 6 7 Agree
Comments
6) Menu items were presented in an attractive manner.
Strongly Strongly
Disagree 12 3 4 5 6 7 Agree
Comments
7) The atmosphere of theTriphammer Grill met my expectations.
Strongly Strongly
Disagree 12 3 4 5 6 7 Agree
Comments
8) The price/value relationship met my expectations.
Strongly Strongly
Disagree 12 3 4 5 6 7 Agree
APPENDIX #2
Section II: The Triphammer Customer
Please circle one answer.
1) Yourvisit to theTriphammer Grill was atwhich period?
1) Lunch 2) Dinner 3) Drinks Only
2) Doyoudine here...
1) Once/week 2) Once/month 3) Less Frequent 4) More Frequent
5) Other
3) Your visit to the Triphammer Grill was for?
1) Business 2) Leisure Dining 3) Tourist 4) Specify Other
(A) Corresponding to question #3, ifyou specified "Business", please indicate the area in which your business is located.
1) Brighton 2) Brockport 3) Churchville 4) East Rochester
5) Fairport 6) Henrietta 7) Mendon 8) Penfield 9) Pittsford
10) Rush 11) Webster 12) CityRochester 13) SpecifyOther
(B) Please indicate the number of business meals per week
(C) Corresponding to Question #3, ifyou specified "Leisure Dining", please indicate the area in which your residenceis located.
1) Brighton 2) Brockport 3) Churchville 4) East Rochester
5) Fairport 6) Henrietta 7) Mendon 8) Penfield 9) Pittsford
10) Rush 11) Webster 12) City Rochester 13) Specify Other
(D) Corresponding to Question #3, ifyou specified "Tourist", please indicate your home town and state inthe space provided.
4) How did you hear about the Triphammer Grill?
1) Friend 2) Newspaper 3) Radio 4) Television 5) Hotel
6) Information Center 7) Convention Visitors Bureau
7) Specify Other
*
The following questions are for statistical purposes only *
5) Please indicate your gender.
1) Male 2) female
6) Please indicate your age bracket.
1) 1 20 2) 21-39 3) 40-59 4) 60-79 5) 80 ->
7) Your occupation is
8) Your favorite type of restaurant is?
1) American 2) Chinese/Asian 3) French 4) Italian 5) Mexican
6) Specify Other
Please utilize the following space for any additional comments or suggestions you feel will better help us serve you in the future.
The Triphammer Grill would like to thank you for 3'our time and
opinions. We hope you enjoyed your dining experience and we look forward
APPENDIX #3
In order to better serve you, the Triphammer Grill, in conjunction with
a graduate student at the Rochester Institute of Technology, has devised this
informational survey. We would like to determine your opinion on the quality
of our service and products. In Section I, pleaseindicate the extent to which
you agree or disagree with the statements by circling the appropriate
response. In Section II, please indicate the answer that most accurate^/