Int. J. Electrochem. Sci., 12 (2017) 11373 – 11386, doi: 10.20964/2017.12.31
International Journal of
ELECTROCHEMICAL
SCIENCE
www.electrochemsci.orgSynthesis and Characterization of Silver-Modified
Micro-Diamond as an Electrocatalyst for Oxygen Evolution and
Reduction Reactions in Alkaline Medium
Hao Huang1, Xilong Ma1,2, Yuanyuan Liu1, Jie Hu1, , Zhefeng Xu2, Kazuhiro Matsugi2
1
State Key Laboratory of Metastable Materials Science & Technology, Yanshan University, Qinhuangdao, 066004, P.R. China
2
Department of Mechanical Materials Engineering, Graduate School of Engineering, Hiroshima University, Higashi-Hiroshima, 739-8527, Japan
E-mail: [email protected]
Received: 10 September 2017 / Accepted: 25 October 2017 / Published: 12 November 2017
Silver-modified micro-diamond composites are synthesized through the chemical reduction of silver nitrate and characterized via X-ray diffraction, scanning electron microscopy (SEM), transmission electron microscopy (TEM), X-ray photoelectron spectroscopy, and Raman spectroscopy. SEM and TEM images show that silver nanoparticles 10–30 nm in size are uniformly deposited on the surface of the micro-diamond. Electrochemical properties are investigated through cyclic voltammetry, linear sweep voltammetry, and electrochemical impedance spectroscopy. Results show that 10 wt% Ag/Dia (silver content is 10% of the diamond) exhibits better bifunctional performance than the commercial Pt/C (20 wt% Pt on carbon) electrocatalyst under the same testing conditions. Compared with pristine micro-diamond and nanodiamond, 10 wt% Ag/Dia demonstrates lower onset potential and higher current density during oxygen reduction reaction and oxygen evolution reaction. The electron transfer number of 10 wt% Ag/Dia is approximately 3.987 at −0.08 V, which indicates that the reaction is almost dominated by an efficient 4e- process. The satisfactory performances of the compositesprovide a novel potential application for electrochemistry.
Keywords: silver; micro diamond; oxygen reduction reaction; oxygen evolution reaction; electrocatalyst.
1. INTRODUCTION
electroplating materials, drug delivery vehicles, cutting tools, and biotechnological and biomedical applications [6–9]. Surface modification and composite with other materials have been widely studied to extend the application of diamond [10, 11]. Diamond can be modified by different surface functional groups. Diamond functionalized with nitrogen-containing groups is particularly interesting for biotechnological applications [12, 13]. A diamond surface modified by hydrogen or oxygen exhibits hydrophobicity or hydrophilicity and negative or positive electron affinity [14–17]. Modifying the surface of diamond with precious metals (Au, Ag, and Pt) greatly improves the performance of the gemstone in electrochemical and bio-antimicrobial applications. Wang et al. [18–21] reported the electrochemical behavior of nanodiamond (ND) modified with nano Titania, platinum nanoparticles, and graphite. Some articles also reported the electrochemical behavior of diamond-like carbon and boron-doped diamond [10, 14, 22]. Their results showed that diamond is a satisfactory support or substrate.
However, NDs display different size distributions and possess surface impurities (a spot of sp2 carbon) depending on the synthetic method. Separation and purification of these impurities are complex. Given their high surface energy, ND particles tend to form agglomerates, which significantly affect their physical and chemical properties. Micron diamond powder possesses excellent characteristics, such as ultrahigh hardness, high thermal conductivity, capability to withstand high temperatures, and outstanding chemical stability in both acidic and alkaline media. In addition, micro-diamond (Dia) shows a weaker tendency to form agglomerates than ND [23]; the sizes of Dia are relatively concentrated and can be easily purified and fabricated. Pristine diamond powder is almost an insulating material, but its conductivity is acquired when the surfaces are modified with some functional groups and noble metals [17–21]. Silver nanoparticles (AgNPs) are known antibacterial and antifungicidal agents [24, 25], as well as ideal conductors because of their excellent electronic conductivity. Ag displays comparable electrochemical properties with Pt and Au, but Ag is cheaper than Pt and Au [26, 27]. Recent studies have reported [28, 29] that Ag can catalyze the direct four-electron (4e−) reaction and, thus, significantly improve the electron charge-transfer over the electrode.
Some investigations have focused on diamond modified by silver [10, 30]. However, reports on Dia modified by silver and their electrochemical performances remain lacking. In the present study, Dia with excellent stability was used as a substrate, and AgNPs were deposited on the surface of Dia through the chemical reduction of silver nitrate. As confirmed by electrochemical testing, silver-modified micro-diamond (Ag/Dia) shows a better bifunctional performance compared with commercial Pt/C during oxygen reduction reaction (ORR) and oxygen evolution reaction (OER). This composite is a good candidate as a catalyst in electrochemical applications, which expands the application range of micro-diamond.
2. EXPERIMENTAL 2.1 Chemicals
chemicals were analytical grade, which were purchased from Qingdao Uoso Chemical Technology Co. Ltd. and used without additional purification. Deionized water was used throughout the experiments.
2.2 Preparation of Ag/Dia composites
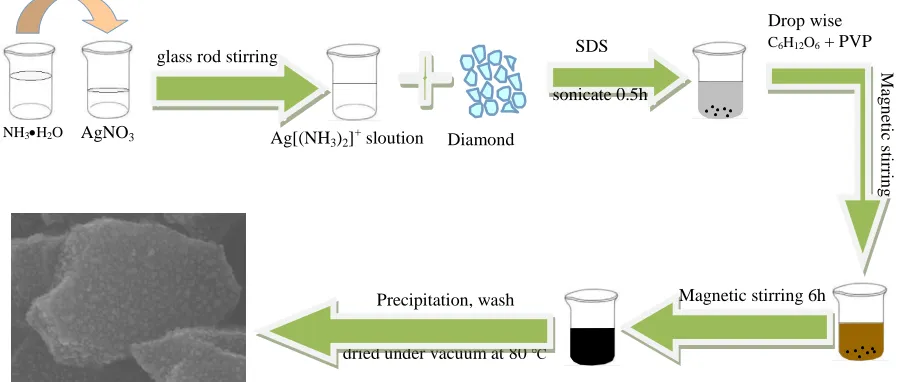
Ag/Dia composites were prepared by a traditional Ag+ reduction reaction. As illustrated in Fig. 1, NH3·H2O with a concentration of 0.1 M (25 wt%) was slowly added to 50 mL of AgNO3
solution (0.2%; w/w) until the brown precipitate of Ag2O appeared. Then, 0.1 M NH3·H2O was added
continuously until the precipitate disappeared, forming a transparent Ag[(NH3)2]+ solution. Dia (1, 2,
and 4 g) was dispersed into 50 mL of Ag[(NH3)2]+ solution, and 0.5 g of sodium dodecyl sulfonate was
added for 30 min of ultrasonic dispersion. The reducing solution was prepared by mixing 4.5 g glucose solution and 0.25 g poly-vinylpyrrolidone. Silver mirror reaction was performed by mixing dropwise Ag[(NH3)2]+ and the reducing solution at a volume ratio of 1:1 under room temperature and with
continuous magnetic stirring for 6 h. The final composite was obtained by filtration, washed, and then dried at 80 °C under vacuum. The samples were denoted as 5, 10, and 20 wt% Ag/Dia depending on the silver content on the diamond surface. For comparison, pristine Dia and ND were also prepared.
Figure 1. Schematic illustrations of preparation of Ag/Dia composite.
2.3 Characterization
Crystalline structures of Ag/Dia were determined by X-ray diffraction (XRD) with a D/max-2500/PC diffractometer and Cu Ka radiation (λ = 0.15405 nm) generated at 40 kV and 100 mA. Transmission electron microscopy (TEM, JEOL-2010, 200 kV) and scanning electron microscopy (SEM, Hitachi S-4800) were used to observe the surface morphology of the samples. The binding energy of the elements was measured at room temperature by X-ray photoelectron spectroscopy (XPS, ESCALAB250) with a monochromatic Al-Mg X-ray source (Al h = 1486.6 eV; Mg h = 1253.6 eV).
dried under vacuum at 80 ℃
Precipitation, wash Magnetic stirring 6h Diamond
M
ag
n
eti
c
stirri
n
g
SDS glass rod stirring
NH3H2O AgNO3
sonicate 0.5h
Drop wise
C6H12O6 + PVP
[image:3.596.73.524.368.559.2]
Raman spectra were collected using a Raman microscope inVia (Renishaw) with a 514 nm laser source at a range of 100–3200 cm−1.
2.4 Electrochemical testing
The Ag/Dia composite (5 mg) and acetylene black as catalyst (5 mg) were mixed with 4 mL of water and 25 µL of Nafion (5 wt%, DuPont, USA) and then ultrasonicated for 30 min to form a homogeneous soliquoid. A 25 µL catalyst ink was dropped onto the glassy carbon (GC) electrode; the diameter of the electrode is 5 mm. The loading of catalyst was 317 µgcm−2
. For comparison, Pt/C (20 wt% Pt on carbon) was tested instead of the Ag/Dia composite.
A three-electrode system was constructed for the electrochemical measurements. A GC disk electrode coated with the catalyst served as the research electrode; platinum foil (1 cm 1 cm) and Ag/AgCl electrode were used as the counter and reference electrodes, respectively. The electrochemical characteristics of the composites for the ORR were studied by RDE techniques between 0.1 and −1.0 V in 0.1 M KOH using an electrochemical workstation (AFMSRX rotator and AFCBP1 bipotentiostat). Cyclic voltammetry (CV) was investigated from 0.4 V to −0.9 V at a scan rate of 10 mV·s−1. OER activity was performed in N2-saturated 0.1 M KOH from 0 V to 1.0 V at a
rotation speed of 1600 rpm. The AC impedance spectra were obtained at 20 C with a frequency range of 106 Hz to 10−1 Hz, and the signal amplitude was 10 mV.
[image:4.596.151.444.497.730.2]3. RESULTS AND DISCUSSION 3.1 XRD analysis
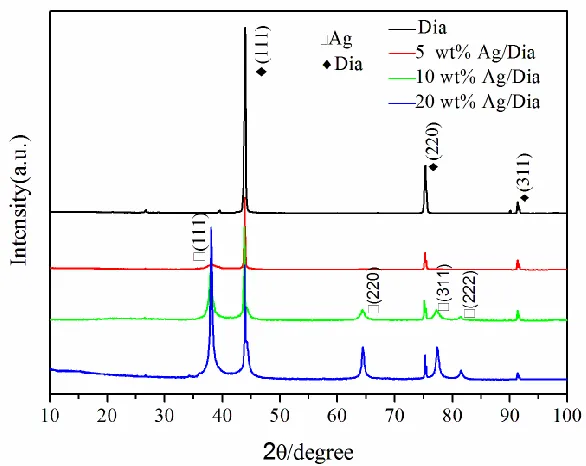
The XRD patterns of pristine Dia and 5, 10, and 20 wt% Ag/Dia are shown in Fig. 2. The obtained diffraction peaks (2θ=43.9°, 75.3°, and 91.4°) correspond to the diamond (111), (220), and (311) crystal planes (PDF reference code 06-0675), respectively. Compared with pristine Dia, the obtained diffraction peaks (2θ=38.1°, 64.1°, 77.5°, and 81.5°) are intense and sharp in the Ag/Dia samples with different Ag contents; these peaks correspond to the silver metal phase (111), (220), (311), and (222) crystal planes (PDF reference code 04-0783), respectively. Fig. 1 shows no additional peaks for Ag2O, AgO, or other silver oxides. When the content of silver is lower, the peaks of silver in
the composite at 64.1°, 77.5°, and 81.5° are not obvious. The above analysis shows that Ag/Dia is a composite material with two-phase structure and that Dia as the substrate is the main crystalline phase. The peak intensities of metallic silver are remarkably increased with increasing Ag concentration. The average crystallite size of Ag microcrystal in 10 wt% Ag/Dia is approximately 20 nm, which was calculated in terms of the Scherrer’s formula based on the diffraction peak of Ag (111).
[image:5.596.179.417.329.704.2]3.2 SEM–energy-dispersive X-ray spectroscopy (EDS) analysis
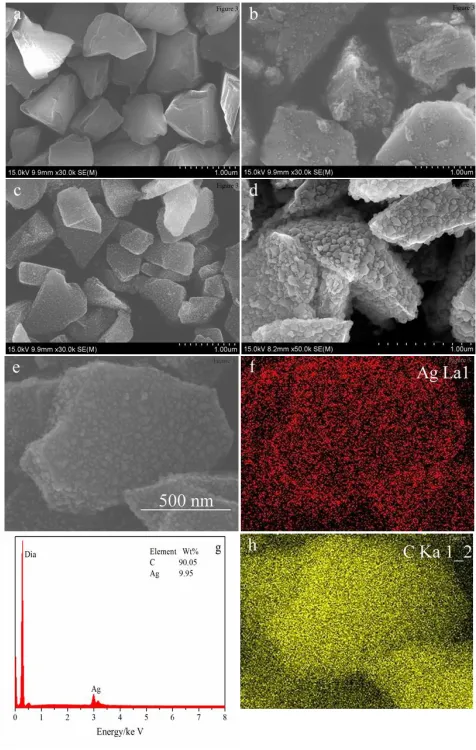
Fig. 3a shows the SEM image of pristine Dia with an average particle size of 1 µm. The Dia particles produced by mechanical crushing exhibit clear and smooth surfaces that originated from the splitting of large crystals along their cleavage planes [18]. As shown in Fig. 3b, the silver particles are not uniformly distributed on the surface of Dia because of low Ag/Dia content. By contrast, when the content is 10 wt%, silver particles are well dispersed without obvious aggregation throughout the surface of Dia (Fig. 3c). As shown in Fig. 3d, when the silver content is 20 wt%, silver particles are crowded in stacks and completely cover the surface of diamond. In addition, the cost of electrocatalyst is also increased as silver content increasing. The pristine picture corresponding to the color maps in Figs. 3f and 3h is a closer view of the surface of the 10 wt% Ag/Dia particles in Fig. 3e. The image clearly reveals that the average diameter of the silver particles is in the range of 10–30 nm. Elemental analysis of 10 wt% Ag/Dia by EDS presents the distribution of the Ag and diamond particles as shown in the color map in Fig. 3 (f, h). The EDS images reveal that all elements in the samples are detected and well dispersed. The EDS data of the 10 wt% Ag/Dia composite (Fig. 3g) indicate the presence of C and Ag. The ratio of Ag to diamond is approximately 1:9, which is consistent with the experimental results.
3.3 TEM analysis
[image:6.596.127.473.379.728.2]
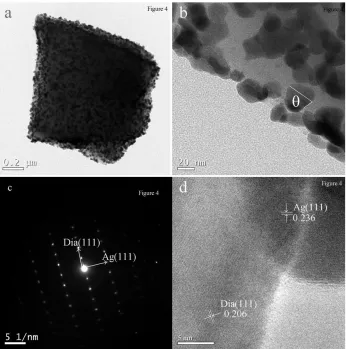
The TEM image of individual 10 wt% Ag/Dia particles is shown in Fig. 4a. The distribution of Ag nanoparticles on the diamond surface is uniform. To investigate the holding strength between silver particle and diamond powder, a contact angle parameter was given and measured from Fig. 4b, which is the amplification of Fig. 4a. It can be seen from Fig. 4b, the contact angle between silver nanoparticles and diamond surface is less than 90°, which reveals a strong interfacial bonding between diamond and silver [5, 31]. The selected area electron diffraction patterns in Fig. 4c distinctly indicate the diffraction lattices of the Dia (111) and Ag (111) planes of the 10 wt% Ag/Dia composite, which agree with the results of XRD analysis. Fig. 4d shows the HRTEM image of the 10 wt% Ag/Dia composite, in which the lattice fringe of diamond is about 0.206 nm, which corresponds to the (111) crystalline planes. The other lattice spacing measures 0.236 nm, which agrees with that of the Ag (111) crystal plane.
[image:7.596.93.503.314.469.2]3.4 XPS analysis
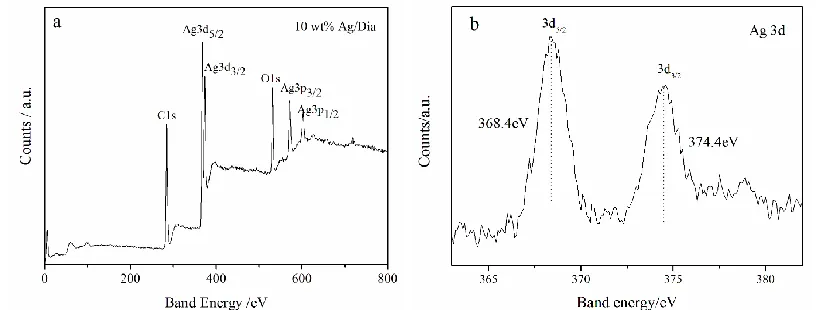
Figure 5. XPS spectra of 10 wt% Ag/Dia composite: (a) Overall spectrum, (b) high-resolution curve of Ag 3d region.
XPS was used to investigate the chemical element valence of 10 wt% Ag/Dia. As shown in Fig. 5a, the presented peaks accurately contain all the elements of the composite. The O 1s peak at 531.1 eV is mainly attributed to the adsorbed oxygen on the sample surface. In the Ag 3d spectrum (Fig. 5b), the Ag 3d peaks (368.4 eV for Ag 3d5/2 and 374.4 eV for Ag 3d3/2) are similar to the binding
energy of metallic Ag (368 eV for 3d5/2 and 374 eV for 3d3/2) [22], which conforms to the XRD results.
The existence of metallic silver can expand the active zone for O2 adsorption and shorten the
conduction path for the adsorbed oxygen, thereby conveying superior eletrocatalytic properties for ORR.
3.5 Raman analysis
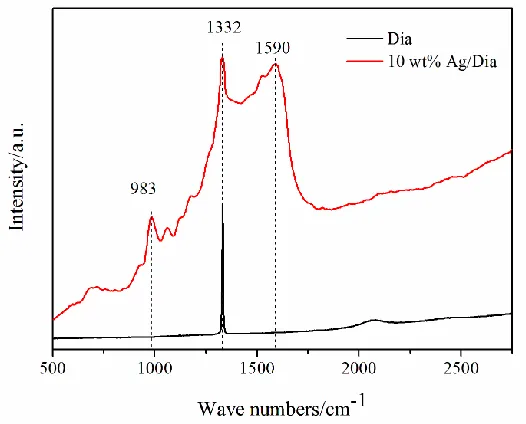
pristine Dia, the prominent peak at 1332 cm−1 corresponds to diamond and consists of C-C sp3 hybridization. The typical Raman spectrum of diamond at 1332 cm−1 in the 10 wt% Ag/Dia sample is observed. In addition, the peaks at 1590 cm−1 can be observed because of the surface-enhanced Raman effect of Ag nanoparticles [33]. This effect of Ag nanoparticles is attributed to the high sp3 hybridization. Ag nanoparticles are effective substrates for SERS [34]. In consideration of the remarkable localized surface plasmin resonance properties of Ag nanoparticles, the peak that appeared at 983 cm−1 can be attributed to the glass substrate [35].
Figure 6. Raman spectra of pure Dia and 10 wt% Ag/Dia.
3.6 Electrocatalytic activity
The electrochemical behaviors of the samples were investigated by half-cell testing in 0.1 M KOH (CV and LSV). As shown in Fig. 7a, Dia and ND show obvious reduction peaks at −0.389 and −0.337 V, respectively. The peaks correspond to ORR (O2+2H2O+4e-→4OH
-) in O2-saturated KOH
within the range of −0.9 V to 0.4 V. Given the presence of silver, 10 wt% Ag/Dia shows an obvious improvement for CV performance with a more positive value of 0.058 V than Dia. The peaks that appeared at −0.331, 0.08, 0.262, and 0.331 V correspond to the oxidation–reduction process of silver coated on the surface of Dia [36], as shown in the following equation:
A1: 2Ag+2OH-=Ag2O+H2O+2e (1)
A2: Ag2O+2OH-=2AgO+H2O+2e (2)
B1: 2AgO+H2O+2e=Ag2O+2OH− (3)
B2: Ag2O+H2O+2e=2Ag+2OH− (4)
[image:8.596.166.429.218.430.2]
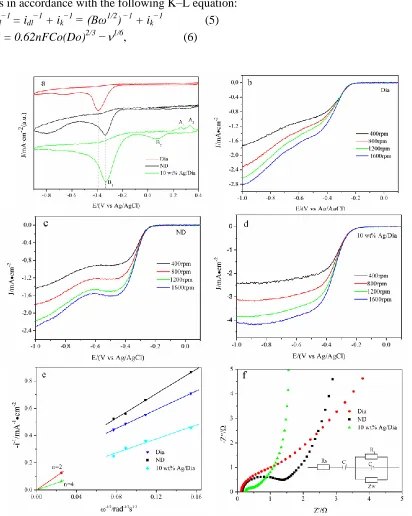
Levich (K–L) plots in Fig. 7e were used to analyze the electron transfer numbers for ORR at different potentials in accordance with the following K–L equation:
Id−1 = idl−1 + ik−1 = (Bω1/2) −1 + ik−1 (5) B = 0.62nFCo(Do)2/3 −1/6, (6)
Figure 7. (a) CV scans of the Dia, ND and 10 wt% Ag/Dia catalysts in 0.1 M KOH solutions saturated with O2 at a scan rate of 10 mVs-1. Polarization curves of ORR on RDE coated with (b) Dia,
(c) ND and (d) 10 wt% Ag/Dia catalysts in O2-saturated of 0.1 M KOH solutions with a sweep
rate of 5 mVs-1
and various rotation rates. (e) Koutecky-Levich plots (i−1 Vs ω−1/2) relationship of the Dia, ND and 10 wt% Ag/Dia at -0.80 V. (f) Nyquist plots of Dia, ND and 10 wt% Ag/Dia, inset is the electrical equivalent circuit used for fitting impedance spectra.
[image:9.596.93.505.95.611.2]
the number of electrons in the oxygen reduction; F is the Faraday constant (96500 Cmol−1); Co is O2
volume concentration in 0.1 M KOH (1.15 ×10⁻⁶ molcm−3); is the kinematic viscosity of the electrolyte (0.01 cm2s−1); and Do is the diffusion coefficient of O2 in 0.1 M KOH (1.95 ×10⁻⁵ cm2s−1)
[37].
According to Equations (5) and (6), the points of the K–L plots are linear and parallel at different potentials, implying the first-order kinetics for oxygen reduction. The electron transfer numbers of Dia, ND, and 10 wt% Ag/Dia were calculated to be approximately 2.96, 2.27, and 3.987, respectively. The 10 wt% Ag/Dia composite shows an almost 4-electron transfer pathway. This favored reaction is due to the AgNPs coated on the surface of Dia. The coated AgNPs shortens the conduction path of the absorbed oxygen and expands the active zone for O2 adsorption on the Ag
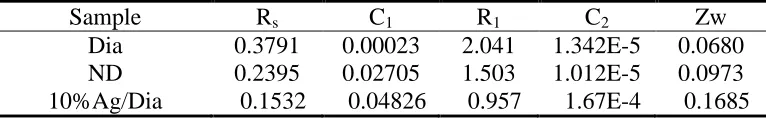
[image:10.596.107.490.602.661.2]particle surface and Ag/Dia interfacial regions. The electrochemical impedance spectra in Fig. 7f were evaluated in the 0.1 M KOH electrolyte, which provides further insight into the kinetics of electrode reactions. The Nyquist plots (imaginary part vs. real part) of the above samples consist of a depressed semicircle in the high-frequency region (corresponding to charge transfer resistance, Rct) and a quasi-sloping line in the low-frequency region (corresponding to mass transfer resistance). The 10 wt% Ag/Dia composite is fitted using the following equivalent circuit: RsC1(WR1C2), as shown in the inset. Rs is the combined ionic resistance of the electrolyte, intrinsic resistance of the substrate, and contact resistance at the active material/current collector interface. C1 is the space charge capacitance (Ag/Dia-electrolyte interface) [38]. As shown in Fig. 7f, the 10 wt% Ag/Dia composite possesses the smallest semicircle in the high frequency range, which corresponds to the least charge transfer resistance R1 caused by the faradaic reactions and the double-layer capacitance C2 on the grain surface. This finding indicates that the modification of silver improves the electrical conductivity of Dia. Fitting of the impedance data by an equivalent circuit is presented in table 1. The slope of the curve is called the Warburg resistance Zw, which is the result of the frequency dependence of ion diffusion/transport in the electrolyte to the electrode surface. The image shows that the slope of 10 wt% Ag/Dia is the largest of all samples in the low frequency region. This finding is due to the fact that the modification of AgNPs increases the active site of Dia, thereby increasing the three-phase reaction interface for easy electrolyte ion transfer.
Table 1. Results of fitting EIS based upon the proposed equivalent circuit.
Sample Rs C1 R1 C2 Zw
Dia 0.3791 0.00023 2.041 1.342E-5 0.0680 ND 0.2395 0.02705 1.503 1.012E-5 0.0973 10%Ag/Dia 0.1532 0.04826 0.957 1.67E-4 0.1685
[image:11.596.179.414.553.731.2]
because AgNPs possess an excellent oxygen solubility and mobility caused by the modest binding energy between oxygen and silver. The comparison of similar ORR/OER electrocatalysts preformances of different catalysts are shown in table 2.
Table 2. The preformances comparison of different electrocatalysts.
Catalyst
Eonset
(v) ORR
Eonset
(v) OER
JORR (mAcm−
2
)
JOER (mAcm−
2
)
Δ(Ej=10 mA-E1/2)
References
Au-Pd NPs/RGO 0.09 / -2.94 / / [28]
10%Ag/Dia -0.124 0.648 -4.12 27.49 1.166 This work
Urchin-like LSM -0.227 0.75 -4.41 5.13 / [37]
Pt/C -0.115 0.735 -4.77 10.52 1.215 This work
NiCo2S4@N/S-rGO -0.106 0.642 -3.96 42.37 0.94 [39]
Pt/C 0.023 0.435 -4.91 10.67 1.10 [39]
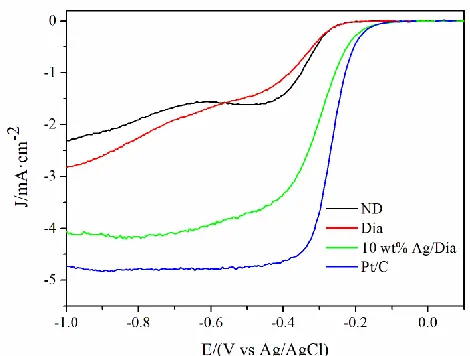
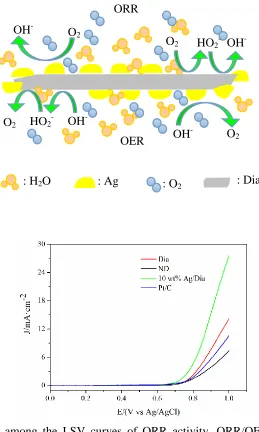
As shown in table 2, the composite exhibits inferior ORR activity relative to the Pt/C catalyst because the electrical conductivity of the composite is weaker than that of commercial Pt/C. Aside from ORR activity, excellent OER activities are particularly critical for bifunctional catalysts. Fig. 8 shows the OER polarization curves of the above samples in N2-saturated 0.1 M KOH with a sweeping
rate of 5 mVs−1
at 1600 rpm. Among the samples, 10 wt% Ag/Dia shows the best OER performance, with a high current density of 27.49 mAcm−2
at 1 V and an onset potential of 648 mV, whereas commercial Pt/C exhibits the weakest OER activity. The overall electrocatalytic activity and the reversibility of 10 wt% Ag/Dia as an oxygen electrode in alkaline electrolyte can be conveniently estimated by the variance matrices Δ (Ej=10 mA-E1/2) between ORR and OER [39]. The value is 1.166 V
Figure 8. Comparison among the LSV curves of ORR activity, ORR/OER mechanism, and OER activity of Dia, ND, 10 wt% Ag/Dia and Commercial Pt/C at 1600 rpm.
The ORR and OER mechanisms of silver modified Dia are also shown in Fig. 8. ORR can occur via a 4e- process where oxygen is reduced to OH- or alternatively, via a serial pathway where oxygen is initially reduced by 2e- to HO2-.
Subsequently, HO2- can be further reduced using an additional 2e-, forming the final product of
OH-. Ag catalyzes the direct 4e- reaction pathway and the HO2- anion decomposition [40]. OER is an
inverse process compared with ORR. The SEM images show that the AgNPs are homogeneously dispersed on the surface of Dia and greatly enhance the catalytic activity for both ORR and OER.
4. CONCLUSIONS
Silver-modified micro-diamond composites are synthesized, and their electrocatalytic properties are investigated. Dia is used as a support, and AgNPs 10–30 nm in size are uniformly deposited on the Dia surface. The 10 wt% Ag/Dia composite with high conductivity shows a better
ORR OH
-O2 HO2- OH
-O2
OER OH
-O2 HO2- OH
-O2
[image:12.596.163.422.73.505.2]
bifunctional performance than ND, Dia, and commercial Pt/C in alkaline medium. The electron transfer numbers of Dia, ND, and 10 wt% Ag/Dia are approximately 2.96, 2.27, and 3.987, respectively. This finding indicates that Ag catalyzes the direct 4e- reaction pathway during ORR and OER. All these features indicate that silver-modified micro-diamond is a promising material for bifunctional electrocatalysts, which may also expand the application range of diamond.
ACKNOWLEDGEMENTS
The authors gratefully acknowledge the support of the Natural Science Foundation of Hebei Province (Nos. B2016203172 and E2017203160), the National Natural Science Foundation of China (No. 51402253) and the Research Program of the College Science & Technology of Hebei Province (No. ZD2017073).
References
1. C.L. Lin, C.H. Lin, H.C. Chang and M.C. Su, J. Chem. Phys. A, 199 (2015) 7704.
2. X.N. Zhao, K. Ma, T.F. Jiao, R.R. Xing, X.L. Ma, J. Hu, H. Huang, L.X. Zhang and X.H. Yan, Sci. Rep., 7 (2017) 44076.
3. J. Song, S.H. Cheng, H.D. Li, H.Y. Guo, S.P. Xu and W.Q. Xu, Mater. Lett., 135 (2014) 214. 4. T. Guillemet, A. Kusiak, L.S. Fan, J.M. Heintz, N. Chandra, Y.S. Zhou, J.F. Silvain, Y.F. Lu and
J.L. Battaglia, ACS Appl. Mater. Inter., 6 (2014) 2095.
5. Y.S. Liu, C.H. Hu, W. Feng, J. Men, L.F Cheng and L.T. Zhang, J. Eur. Ceram. Soc., 34 (2014) 3489.
6. S. Turchetta, W. Polini, G. Gelfusa and E. Venafro, Int. J. Adv. Manuf. Tech., 70 (2014) 73. 7. J. Li, Y. Zhu, W.X. Li, X.Y. Zhang, Y. Peng and Q. Huang, Biomaterials, 31 (2010) 8410-8418. 8. M.F. Ismail, K. Yanagi and H. Isobe, Wear, 271 (2011) 559.
9. A. Gismondi, G. Reina, S. Orlanducci, F. Mizzoni, S. Gay, M.L. Terranova and A. Canini, Biomaterials, 38 (2015) 22.
10. Š.Meškinis, A. Vasiliauskas, K. Šlapikas, G. Niaura, R. Juškėnas, M. Andrulevičius and S.Tamulevičius, Diam. Relat. Mater., 40 (2013) 32.
11. G. Xiong, J.N. Sang and J Mol. Catal, J. Mol. Cata. A: Chem., 392 (2014) 315.
12. N. Simon, G. Charrier, A.M. Gonçalves, D. Aureau, P. Gautier and M. Ndjeri, Electrochem. Commun., 42 (2014) 17.
13. Y.D. Ma, H. Jin, Y. Dai and B.B. Huang, Appl. Surf. Sci., 256 (2010) 4136.
14. M.R. Baldan, A.F. Azevedo, A.B. Couto and N.G. Ferreira, J. Phys. Chem. Solids, 74 (2013) 1830.
15. F. Cavani, N. Ballarini and A. Cericola, Catal. Today, 127 (2007) 113.
16. P. Ashcheulov, J. Sebera , A. Kovalenko1, V. Petrak, F. Fendrych, M. Nesladek, A. Taylor, Z. Vlckova Zivcov, O. Frank, L. Kavan, M. Dracınsky, P. Hubık, J. Vacık, I. Kraus and I.
Kratochvlov, Eur. Phys. J. B, 86 (2013) 443.
17. C.E. Nebel, B. Rezek, D. Shin and H. Watanabe, Phys. Stat. Sol., 203 (2006) 3273.
18. Y.H. Wang, Y.L. Zhao, R. Lu, L. Dong, J.B. Zang, J. Lu and X.P. Xu, J. Electrochem. Soc., 162 (2015) 211.
19. Y.L. Zhao, Y.H. Wang, X.Z. Cheng, L. Dong, Y. Zhang and J.B. Zang, Carbon, 67 (2014) 409. 20. J.B. Zang, Y.H. Wang, L.Y. Bian, J.H Zhang, F.W. Meng, Y.L. Zhao, R. Lu, X.H. Qu and S.B.
Ren, Carbon, 50 (2012) 3032.
22. Ö.D. Coşkun and T.Z. Optical, Diam. Relat. Mater., 56 ( 2015) 29.
23. N. Petrova, A. Zhukov, F. Gareeva, A. Koscheev, I. Petrov and O. Shenderova, Diam. Relat. Mater., 30 (2012) 62.
24. M. Radetic, J. Mater. Sci., 48 (2013) 95.
25. M. Metzler, M. Chylińska1 and H. Kaczmarek, J. Polym. Res., 22 (2015) 146.
26. H. Huang, Y.T. Meng, A. Labonte, A. Dobley and S.L. Suib, J. Phys. Chem., 117 (2013) 25352. 27. S.M. Yang, E. Strelcov, M.P. Paranthaman, A. Tselev, T.W. Noh and S. V. Kalinin, Nano Lett., 15
(2015) 1062.
28. J.J. Lv, S.S. Li, A.J. Wang, L.P. Mei, J.R. Chen and J.J. Feng, Electrochim. Acta, 136 (2014) 521. 29. Y. Lin, R. Ran and Z.P. Shao, Int. J. Hydrogen Energ., 35 (2010) 8281.
30. T. Xu, L.Z. Wu, Y. Yu, W.Y. Li and J.F. Zhi, Mater. Lett., 114 (2014) 92. 31. M. Kalin and M. Polajnar, Appl. Surf. Sci., 293 (2014) 97.
32. R. Shimizu and Y. Ogasawara, Lithos, 207 (2014) 201.
33. S.C.H. Kwok, W. Zhang, G.J. Wan, D.R. McKenzie, M.M.M. Bilek and P.K. Chu, Diam. Relat. Mater., 16 (2007) 1353.
34. S.Y. Lin, W.Q. Zhu, Y.H. Jin and K.B. Crozier, Nano Lett., 13 (2013) 559. 35. M. Fana, G.F.S. Andradec and A.G. Brolo, Anal. Chim. Acta, 693 (2011) 7.
36. Y. Wan, X.M.Wang, Y. Zhang, S.Y. Liu and H. Sun, Chin. J. Nonferr. Metal., 24 (2014) 535. 37. J.Chao, X.C. Cao, L.Y. Zhang, C. Zhang and R.Z. Yang, J. Power Sources, 241(2013) 225. 38. Z.V. Zivcova, V. Petrak, O. Frank and L. Kavan, Diam. Relat. Mater., 55 (2015) 70.
39. Q. Liu, J.T. Jin, and J.Y. Zhang, ACS Appl. Mater. Inter., 5 (2013) 5002. 40. J. Hu, L.N. Wang, L.N. Shi and H. Huang, J. Power Sources, 269 (2014) 144.