Int. J. Electrochem. Sci., 14 (2019) 8494 – 8505, doi: 10.20964/2019.09.03
International Journal of
ELECTROCHEMICAL
SCIENCE
www.electrochemsci.org
Electrochemical Sensor for Detection of Ascorbic Acid Using a
Methylene Blue-Doped Polyimide-Modified Glassy Carbon
Electrode
Tian Yang1, Yue Wang1,*, Yasushi Hasebe2, Lin Chen3, Zhiqiang Zhang1, Zhizhi Hu1,*
1 School of Chemical Engineering, University of Science and Technology LiaoNing, 185 Qianshan
Middle Road, High-tech zone, Anshan, LiaoNing, 114051, China.
2 Department of Life Science and Green Chemistry, Faculty of Engineering, Saitama Institute of
Technology, 1690 Fusaiji, Fukaya, Saitama 369-0293, Japan.
3 Department of Chemistry and Materials Engineering, Yingkou Institute of Technology, Yingkou,
LiaoNing, 115014, China.
*E-mail: [email protected]; [email protected]
Received: 8 May 2019 / Accepted: 21 June 2019 / Published: 31 July 2019
Methylene blue (MB)-doped polyimide-modified glassy carbon electrodes were first employed for the detection of ascorbic acid (AA). The fabricated electrode exhibited excellent electrochemical catalytic activities. The structure of the modified electrodes was evaluated by an advanced mineral identification and characterization system (AMICS), high-temperature confocal laser scanning microscopy (HLSM) and atomic force microscopy (AFM). The electrochemical behavior toward ascorbic acid was studied by amperometric i-t curve measurements and cyclic voltammetry. Moreover, the influences of the conditions such as the volume ratio of methylene blue and polyimide, buffer solution pH, applied potential were optimized in this paper. Under the optimized conditions, the sensitivity of the prepared electrode is 27.19 A-1·M-1·cm-2, with a wide linear range of 3 M to 3000 M and a detection limit of
1.05 μM. The as-prepared sensor also shows good selectivity, fast response and long lifetime for the determination of AA. This study creates a new application for polyimides in the electrochemical field.
Keywords: polyimide, ascorbic acid, methylene blue, electrochemical sensor
1. INTRODUCTION
clear that accurately and rapidly detecting AA is highly important in medical diagnosis [6]. However, uric acid (UA), dopamine (DA) and AA always coexist in real biological samples. These compounds show nearly the same electrochemical properties, complicating the selective determination of these compounds with traditional electrodes [7,8]. Therefore, it is increasingly imperative to exploit a highly selective and sensitive method for the detection of AA in mixtures [9]. Due to their high sensitivity, enzyme-based biosensors are usually prepared for the detection and determination of ascorbic acid [10,11]. However, enzymatic biosensors can easily be affected by environmental conditions such as pH, temperature and pollution. Therefore, various materials such as carbon nanomaterials [12-16], polymers [2,17], natural sulfide minerals [18], and nanometal materials [19-22] have been applied to the fabrication of AA-based nonenzymatic sensors.
Methylene blue (MB) is usually used in photocatalyzed reactions because of its great absorptivity and redox properties [23,24]. Additionally, as a typical phenothiazine dye, MB has been widely used in some basic fields, such as solar cells [25], electrochemical enzyme-fuel cells and enzyme-based biosensors [26]. Zhang and coworkers reported a novel electrochemical nanostructure containing MB and graphene to illustrate the absorption characteristics between MB and graphene [27]. An original alkanethiol-modified electrode with MB was also fabricated to reveal the electrochemical properties of MB in electrochemical biosensors [28].
Polyimide (PI), a kind of amorphous structure, is a class of polymers with outstanding performance comparable to that of porphyrin-modified materials [29]. Due to its outstanding characteristics, such as dimensional stability, thermal stability, mechanical and electrical properties, PI has been widely used as an electronic material in mobile liquid crystal displays and other applications [30-32]. A Mo doped reduced graphene oxide/polyimide composite membrane (Mo-rGO/PI)-based sensor was constructed that showed excellent catalytic activity for DA [33]. Dongmei Li’s group reported the effects of a polyimide coating on metal insulator semiconductor (MIS) sensors, which was used to selectively detect H2 in a mixed-hydrocarbon environment [34]. These studies illustrate that PI
is a promising material for the fabrication of efficient sensors.
Due to the specific characteristics of MB and PI, we would like to combine the advantages of two materials to develop a new type of electrochemical sensor. In this paper, we fabricated a novel sensor based on the physical mixing of MB and PI that could quantitatively and qualitatively detect ascorbic acid. The surface morphology and electrochemical behavior of MB/PI were evaluated. In addition, the optimized conditions (the volume ratio of methylene blue and polyimide, buffer solution pH, applied potential) were examined to obtain the best performance. Because of the water solubility of MB, it cannot be immobilized on the electrode surface. This study provides a new combination methodology for methylene blue and polyimide. This approach can not only enhance the conductivity of PI but also prevent the MB from leaking to the solution.
2. EXPERIMENTAL SECTION
2.1 Reagents and materials
Chemical Co., Ltd., and was recrystallized from acetic anhydride and vacuum-dried before use. 9,9’-Bis(4-hydroxyphenyl) fluorene (BHF) was purchased from Sinosteel Anshan Research Institute of Thermo-energy Co., Ltd., China. N,N’-Dimethylacetamide (DMAc), ethanol, Pd/C (10%), hydrazine hydrate, acetone, nitric acid, pyridine, acetic anhydride, K2HPO4, KH2PO4, UA, DA, AA, glucose,
fructose, hydrogen peroxide (H2O2), sodium hydroxide (NaOH), phosphoric acid, glacial acetic acid,
boric acid and potassium chloride (KCl) were purchased from Sinopharm Chemical Reagent Co. Ltd., Beijing, China. Polishing powder (1.0, 0.3, 0.05 m Al2O3) was obtained from Xin Hui Electronic
Technology Co., Ltd. Changsha, China. Before use, DMAc was dried by anhydrous molecular sieves. Methylene blue was purchased from FUJIFILM Wako Pure Chemical Corporation, Tokyo, Japan. Glassy carbon electrodes (GCEs, 3.0 mm in diameter) were purchased from Shanghai Chen Hua Instrument Co., Ltd., Shanghai, China. Britton-Robinson (BR) buffer was prepared for the pH-dependence experiment. BR buffer was prepared by the following procedures: acid solution was prepared by mixing 0.1 mol/L phosphoric acid, 0.1 mol/L glacial acetic acid and 0.1 mol/L boric acid. The pH was adjusted by mixing the acid component and 0.1 mol/L NaOH. Additionally, 0.1 M phosphate buffer solution (PBS, made using K2HPO4 and KH2PO4) was used as the electrolyte. Deionized water
was used throughout the experiments.
2.2 Apparatus
An advanced mineral identification and characterization system (AMICS, AMICS-Mining/SIGMA 500, ZEISS/Bruker) was used to evaluate the morphology of the modified surface. High-temperature laser confocal scanning microscopy (HLSM, VL2000DX, Yonekura MFG Co. LTD) was performed to understand surface roughness. Atomic force microscopy (AFM) images were recorded with a multimode scanning probe microscope system operated in tapping mode using a Being Nano-instruments CSPM-5500 (Ben Yuan Ltd., Beijing, China). CV and amperometric i-t curve measurements were performed on a CHI 660E electrochemical workstation (Shanghai, China). The conventional three-electrode system was applied for all electrochemical experiments, which consisted of a Ag/AgCl/saturated KCl electrode as the reference electrode, a platinum wire electrode as the auxiliary electrode, and a glass carbon electrode modified with MB/PI as the working electrode. All measurements were carried out in an air atmosphere at room temperature (~20 °C).
2.3 Preparation of the MB/PI-modified GCE
electrode. Then, 10 L MB/PI solution was cast onto the GCE surface and maintained for 6 hours in air. The preparation procedure of the MB/PI-GCE is shown in Scheme 1.
Scheme 1. Preparation scheme of the MB/PI-modified GCE
3. RESULTS AND DISCUSSION
3.1 Characterization of the modified electrode
Figure 1. AMICS images of MB-GCE (A) and MB/PI-GCE (B).
[image:4.596.134.461.127.360.2]
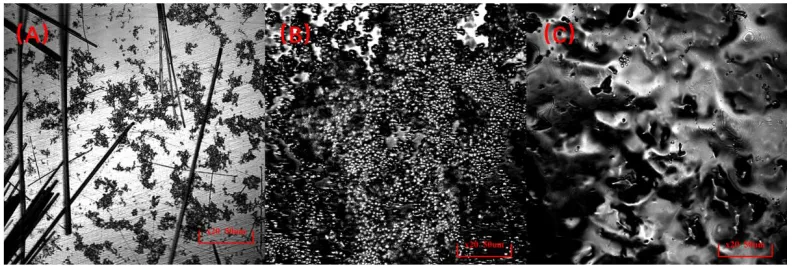
Figure 2. HLSM images of MB-GCE (A), PI-GCE (B), and MB/PI-GCE (C).
To further understand the surface information, we checked the surface roughness using HLSM. The image of MB-GCE in Fig. 2A also shows a cuboid structure similar to that in Fig. 1A. From the image in Fig. 2B, PI-GCE shows a compact ball-shaped structure. After hybridization of MB and PI, an uneven membrane structure can be observed (Fig. 2C). The surface roughness values of PI-GCE, MB-GCE and MB/PI-MB-GCE are 0.490, 0.168, and 0.691 m, respectively. The increasing roughness of the MB/PI-GCE is attributed to the hybridization of MB and PI.
Figure 3. AFM images of MB-GCE (A), PI-GCE (B), and MB/PI-GCE (C).
Fig. 3 shows the AFM images of three modified electrodes. As shown in Fig. 3A and 3B, the cuboid and spherical structures of MB and PI, respectively, were consistent with the HLSM images. The heights of MB-GCE, PI-GCE and MB/PI-GCE are 194.5, 192.5 and 186.0 nm, respectively. The adhesiveness of PI not only facilitates the combination with MB but also enhances the stability on the glassy carbon electrode [36]. Furthermore, the tight contact of MB/PI on the GCE surface would facilitate the electron transfer between MB/PI and the GCE.
3.2 Electrocatalytic behavior of the MB/PI-GCE sensor
[image:5.596.104.495.380.506.2][image:6.596.194.403.116.284.2]
experiments. The combination of MB and PI not only enhances the electrochemical activity of PI but also prevents the leakage of MB.
Figure 4. CVs of PI-GCE (red line) and MB/PI-GCE (blue line) for the determination of 1.0 mM AA in 0.1 M PBS (pH 7.0) at 50 mV/s vs. Ag/AgCl.
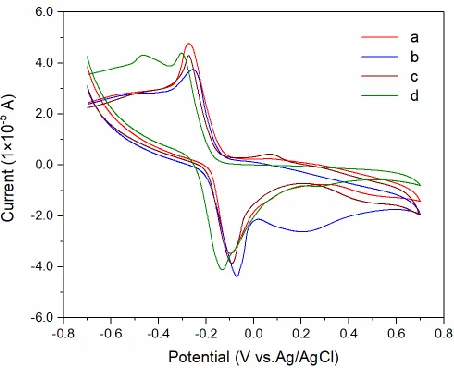
Figure 5. CVs of no substrate (a), 10 mM AA (b), 10 mM DA (c) and 10 mM UA (d) in 0.1 mM PBS (pH 7.0) on MB/PI-GCE at 50 mV/s vs. Ag/AgCl.
[image:6.596.186.413.354.538.2]
Figure 6. (A) CVs of MB/PI-GCE at different scan rates (10, 20, 30, 40, 50, 60, 70, 80, and 90 mV/s). (B) CVs of MB/PI-GCE at different scan rates (100, 200, 300, 400, 500, 600, 700, 800, and 900 mV/s vs. Ag/AgCl) in 5 mM [Fe(CN)6]3-/4- containing PBS (7.0) solution. The insets show I vs.
v1/2 curves.
Fig. 6 shows cyclic voltammograms at scan rates from 10 to 900 mV/s with the corresponding Ia
(anodic peak current) vs. v1/2 (square root of scan rate) curves shown in the insets to evaluate the
electrochemical behavior of the prepared sensor. The equations describing the linear behavior of inset Fig. 6A are Ipa (A) = 3.95×10⁻⁴ + 2.51×10⁻⁶ v1/2 (mv1/2s-1/2) and Ipc (A) = -4.34×10⁻⁴ + 2.10×10⁻⁵ v1/2
(mv1/2s-1/2), with the R2=0.99971 and R2=0.99974, respectively. The equations describing the linear behavior of inset Fig. 6B are Ipa (B) = 3.28×10⁻⁴ + 2.63×10⁻⁵ v1/2 (mv1/2s-1/2) and Ipc (B) = -3.87×10⁻⁴ –
1.50×10⁻⁵ v1/2 (mv1/2s-1/2), with the R2=0.9974 and R2=0.99972, respectively. These results showed a linear relationship between the square root of scan rate and peak current intensity, which indicated a typical diffusion-controlled process [37].
3.3 Optimization of the experimental variables
3.3.1. Effect of volume ratio of MB and PI on the peak current responses
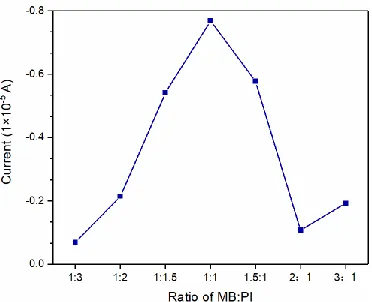
Figure 7. Amperometric i-t currents toward AA in different volume ratios of MB: PI on MB/PI-GCE in PBS (pH 7.0) at an applied potential of 0.1 V vs. Ag/AgCl.
[image:7.596.82.520.68.232.2] [image:7.596.207.393.552.703.2]
To obtain the best performance of the prepared sensor, the volume ratio of MB and PI was checked by an amperometric i-t curve in 0.1 M PBS (pH 7.0) with an applied potential of 0.1 V vs. Ag/AgCl. The oxidation currents of 1.0 mM AA in different volume ratios of MB:PI are presented in Fig. 7. From the curve of different volume ratios for sensing AA, the current increases first and then decreases with increasing volume ratio. When the volume ratio of MB and PI was 1:1, the best current was obtained. Accordingly, a volume ratio of 1:1 was selected for the following experiment.
[image:8.596.201.392.227.383.2]3.3.2. Effect of pH on the peak current responses
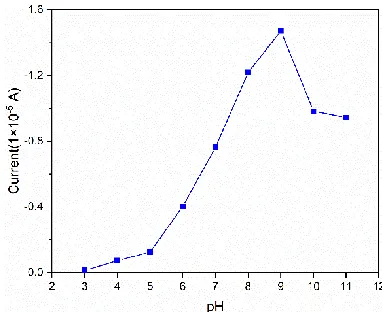
Figure 8. Effect of pH on the oxidation current of AA at an applied potential of 0.2 V vs. Ag/AgCl.
To explore the effect of pH on the peak current response toward AA, the amperometric i-t method was used in the pH range of 3.0 to 11.0. As shown in Fig. 8, the response clearly increased from pH 3.0 to 9.0 and then decreased from pH 9.0 to 11.0. By considering the physiological pH [38] and the response of MB/PI-GCE toward AA, pH 8.0 is selected for the following electrochemical measurement.
3.3.3. Effect of the applied potential on the peak current responses
[image:8.596.200.396.565.724.2]
Under the optimized volume ratio and pH of the electrolyte, the applied potential (0.1 V~0.3 V) was varied to investigate the peak current responses to AA. Fig. 9 shows the applied potential dependence on the oxidation current of AA. The maximum result was obtained when the applied potential was 0.2 V. Therefore, an applied potential of 0.2 V is chosen for the following experiments, which is consistent with the CV results (Fig. 5).
3.4 Analytical characteristic of the MB/PI-GCE sensor
[image:9.596.98.501.210.358.2]Figure 10. (A) Amperometric i-t curve of MB/PI-GCE to different concentrations of AA (3 μM, 10 μM, 30 μM, 0.1 mM, 0.3 mM, 1 mM, 3 mM). (B) Calibration plot of MB/PI-GCE on the oxidation peak currents for AA. The applied potential is 0.2 V vs. Ag/AgCl (pH 8.0).
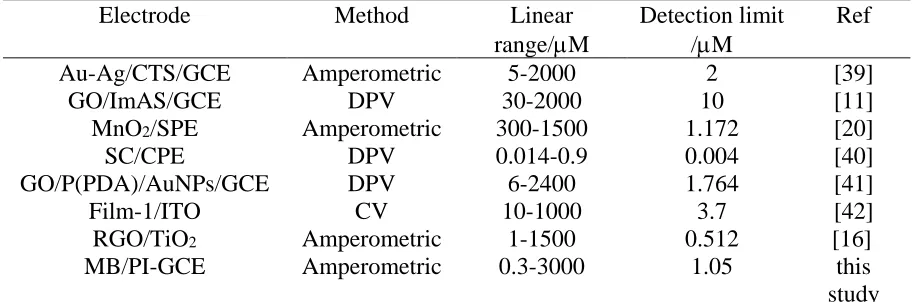
Table 1. Comparison of parameters for the determination of AA with those of reported works
Electrode Method Linear
range/M
Detection limit /M
Ref
Au-Ag/CTS/GCE Amperometric 5-2000 2 [39]
GO/ImAS/GCE DPV 30-2000 10 [11]
MnO2/SPE Amperometric 300-1500 1.172 [20]
SC/CPE DPV 0.014-0.9 0.004 [40]
GO/P(PDA)/AuNPs/GCE DPV 6-2400 1.764 [41]
Film-1/ITO CV 10-1000 3.7 [42]
RGO/TiO2 Amperometric 1-1500 0.512 [16]
MB/PI-GCE Amperometric 0.3-3000 1.05 this
study
Au-Ag, gold-silver nanotubes; CTS, chitosan; GCE, glassy carbon electrode; GO, graphene oxide; RGO, reduced graphene; ImAS, imidazolium alkoxysilane; SPE, screen printed electrode; SC, sepiolite clay; CPE, carbon paste electrode; P(PDA), poly(2,6-pyridinedicarboxylic acid); AuNPs, gold nanoparticles; DPV, differential pulse voltammetry; Film-1, [{Pc(SC2H5)8}Eu{BiPc(SC2H5)12}Eu{Pc(SC2H5)8}], ITO,
indium tin oxides.
Under the optimized conditions, we subsequently evaluated the analytical properties of MB/PI-GCE. Figure 10A shows the amperometric i-t curve for different concentrations of AA. We investigated an AA concentration range from 1.0 μM to 3.0 mM. The response current exhibited stepped increases,
[image:9.596.70.526.469.620.2]
which suggests a wide linear range for AA detection. The MB/PI-GCE sensor shows an extremely wide linear range for AA detection from 3.0 × 10⁻⁶ to 3.0 × 10⁻³ M, and the regression equation I (A)= 1.9219 c (M)+ 0.1453, with a correlation coefficient of 0.9885. The limit of detection (LOD) is as low as 1.05 μM (S/N=3). Compared with the AA sensors listed in Table 1, the MB/PI sensor shows excellent performance for both linear range and detection limit.
3.5 Operational stability, reproducibility, selectivity and stability of MB/PI-GCE
Figure 11. (A) Steady-state current of the MB/PI-GCE upon successive addition of 0.1 mM AA. (B) The reproducibility of five independent MB/PI-GCE sensors toward 0.1 mM AA detection. (The applied potential is 0.2 V, PBS pH 8.0)
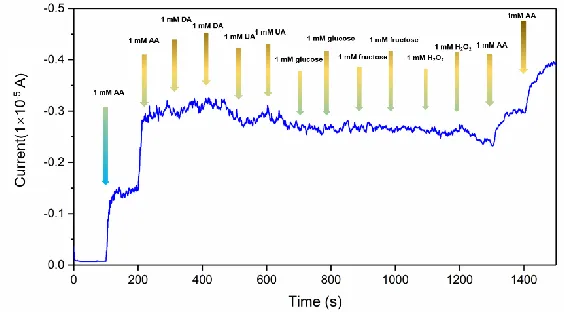
Figure 12. Amperometric responses of the MB/PI-GCE for the successive addition of 1.0 mM AA and same concentration of possible interferents (i.e., glucose, fructose, UA, DA and H2O2). All
measurements were carried out at 0.2 V vs. Ag/AgCl in air-saturated 0.1 M BR buffer (pH 8).
Fig. 11 A shows the oxidation current response on successive additions of AA under the optimized conditions. The response current increased to reach a stable plateau within 8 s after adding
[image:10.596.86.521.212.397.2] [image:10.596.158.440.489.645.2]
AA into the electrolyte, indicating that the permeation and diffusion of AA within the MB/PI film was fast enough. To study the reproducibility of the electrode preparation, 5 electrodes were prepared under the same conditions. As shown in Fig. 11 B, it was found that the relative standard deviation is 2.83% for these electrodes.
Selectivity is a significant factor to evaluate the performance of sensors, and it is necessary to test the potential interferential species [43]. To reveal the selectivity of the present sensor, the effects of various potentially interfering substances, such as DA, UA, glucose, fructose and H2O2, were evaluated.
As shown in Figure 12, the current responses from interferents are negligible.
4. CONCLUSION
In summary, a highly sensitive and stable sensor based on a MB/PI film was fabricated through an inexpensive and easy route, and the sensor successfully displays high electrocatalytic activities toward the oxidation of AA. Both the surface morphology and the electrocatalytic behavior were evaluated. In addition, the volume ratio of MB and PI, buffer solution pH and applied potential were optimized to obtain the best performance. The modified electrode exhibited good analytical performance (sensitivity, 27.190 A-1·M-1·cm-2; LOD, 1.05 μM; linear range, 3~3000 M; response time is 8 s). The novel
MB/PI-GCE film indicates the wide applicability of polyimides for various electronic devices.
ACKNOWLEDGMENTS
The authors gratefully thankful to the financial support from the Natural Science Foundation of Liaoning Province (No. 20170540464), the Department of Education of Liaoning (No. 2017LNQN05) and the Foundation of University of Science and Technology, Liaoning (No. 2016RC12).
References
1. J. Scheffler, K. Bork, V. Bezold, P. Rosenstock, V.S. Gnanapragassam and R. Horstkorte, Exp. Gerontol, 117 (2019) 25.
2. Y. Wang, T. Yang, Y. Hasebe, Z. Zhang and D. Tao, Materials, 11 (2018) 1961.
3. O. Arrigoni and M.C. De Tullio, Biochimica et Biophysica Acta - General Subjects, 1569 (2002) 1. 4. D.M. Sun, Q. Zhao, F. Tan, X.C. Wang and J. S. Gao, Anal. Methods, 4 (2012) 3283.
5. X.J. Zhao, W. Zhang, H.G. Chen, Y.J. Chen and G.Y. Huang, Food Analytical Methods, 7 (2014) 1557.
6. N. Tukimin, J. Abdullah and Y. Sulaiman, J. Electroanal. Chem., 820 (2018) 74.
7. D. Ji, Z. Liu, L. Liu, S.S. Low, Y. Lu, X. Yu, L. Zhu, C. Li and Q. Liu, Biosens. Bioelectron., 119 (2018) 55.
8. C. Wang, R. Yuan, Y. Chai, S. Chen, F. Hu and M. Zhang, Anal. Chim. Acta, 741 (2012) 15. 9. N.F. Atta, A. Galal and S.M. Azab, J. Electrochem. Soc., 159 (2012) 765.
10.Z. Wang, Q. Xu, J.H. Wang, Q. Yang, J.H. Yu and Y.D. Zhao, Microchimi. Acta, 165 (2009) 387. 11.E.T.A. Marques and J.L. Lima Filho, Applied Biochem. Biotechnol., 32 (1992) 73.
(2011) 7788.
13.X. Liu, S. Wei, S. Chen, D. Yuan and W. Zhang, Appl. Biochem. Biotechnol.,173 (2014)1717. 14.F. Wu, T. Huang, Y. Hu, X. Yang, Y. Ouyang and Q. Xie, Microchimi. Acta, 183 (2016) 2539. 15.H. Huang, Y. Yue, Z. Chen, Y. Chen, S. Wu, J. Liao, S. Liu and H.R. Wen, Microchim.
Acta,186(2019)189.
16.L. Fu, Y.H. Zheng and Z.X. Fu, Chemical Papers,69(2015)655.
17.P.S. Sharma, A. Pietrzyk-Le, F. D'Souza, W. Kutner, Anal. Bioanal. Chem., 402 (2012) 3177. 18.R. Zhao, Y. Wang, Z. Zhang, Y. Hasebe and D. Tao, Anal. Sci.,(2019) DOI:10.2116/analsci.19P012. 19.S. Gao, H. Li, M. Li, C. Li, L. Qian, B. Yang, J. Solid State Electrochem., 22 (2018) 3245.
20.E. Turkusic, V. Milicevic, H. Tahmiscija, M. Vehabovic, S. Basic, V. Amidzic and J.Fresenius Anal. Chem., 368 (2000) 466.
21.M. Wang, J. Xu, X. Zhang, Z. Fan and Z. Tong, Applied Biochem. Biotech., 185 (2018) 834.. 22.M. Ganiga and J. Cyriac, Anal. Bioanal. Chem., 408 (2016) 3699.
23.S.K. Lee, A. Mills and N. Wells, Catalysis Today, 313 (2018) 211. 24.J. Wang, F. Wang and S. Dong, J. Electroanal. Chem., 626 (2009) 1.
25.X.B. Zhang, L.Q. Shen, M.Y. Wang, G.W. Siqin, Z.W. Tong, R B. Xu, D.G. Zhang, J.J. Ma and L. Liu, Materials Letters, 135 (2014) 39.
26.Y. Wang and Y. Hasebe, J. Electrochem. Soc.,159 (2012) F110.
27.D.D. Zhang, L. Fu, L. Liao, B. Dai, R. Zou, C.X. Zhang, Electrochimica Acta, 75 (2012) 71. 28.E. Barou, M. Bouvet, O. Heintz and R. Meunier-Prest, Electrochimica Acta, 75 (2012) 387.
29.H.Y. Lei, J.M. Lu, G.Q. Dong, G.F. Tian, S.L. Qi and D.Z. Wu, Dyes And Pigments,161 (2019) 79. 30.C.P. Ribeiro, B.D. Freeman, D.S. Kalika and S. Kalakkunnath, J. Membrane Sci., 390 (2012) 182. 31.Q. Liu, D.R. Paul and B.D. Freeman, Polymer, 82 (2016) 378.
32.A. Georgiev, D. Dimov, E. Spassova, J. Assa, G. Danev, J. Molecular Struc.,1074 (2014) 100. 33.L.P. Jia, Y.X. Zhou, Y.M. Jiang, A.H. Zhang, X. Li and C.M. Wang, J. Alloys Compounds, 685
(2016) 167.
34.D. Li, A. H. McDaniel, R. Bastasz and J.W. Medlin, Sens. Actuat. B: Chemical, 115 (2006) 86. 35.Y. Wang, L. Chen, Y. Zhang, Q.N. Wang, R.D. Ma, Y. Hasebe, Z.Q. Zhang and Z.Z. Hu, Sensors
andMaterials,31(2019)1191.
36.W. Jang, J. Seo, C. Lee, S.H. Paek and H. Han, J. Applied Polymer Sci.,113 (2009) 976. 37.F.D. Morawski, M. Deon, S. Nicolodi, E.W. de Menezes, T.M.H. Costa, S.L.P. Dias, E.V.
Benvenutti and L.T. Arenas, Electrochimica Acta, 264 (2018) 319. 38.Y. Marunaka, World J Diabetes, 6 (2015) 125.
39.P. Yang, X. Gao, L. Wang, Q. Wu, Z. Chen and X. Lin, Microchim. Acta,181 (2013) 231. 40.M. Pekin, D.E. Bayraktepe and Z. Yazan, Ionics, 23 (2017) 3487.
41.G. Aydoğdu Tığ, G. Günendi and Ş. Pekyardımcı, J.Applied Electrochem.,47 (2017) 607. 42.X. Cai, C. Wei, J. Dong, Q. Liu, Y. Wu, G. Lu, Y. Chen and J. Jiang, J. Materials Science:
Materials in Electronics,30(2018)1976.
43.D. Zhao, G. Yu, K. Tian and C. Xu, Biosens. Bioelectron.,82 (2016) 119.