Madhlopa, A. and Ngwalo, G. (2007) Solar dryer with thermal storage and biomass backup heater.
Solar Energy, 81 (4). pp. 449-462. ISSN 0038-092X
http://
strathprints
.strath.ac.uk/
16428
/
This is an author produced version of a paper published in Solar Energy, 81 (4). pp. 449-462.
ISSN 0038-092X. This version has been peer-reviewed but does not
include the final publisher proof corrections, published layout or pagination.
Strathprints is designed to allow users to access the research output of the University
of Strathclyde. Copyright © and Moral Rights for the papers on this site are retained
by the individual authors and/or other copyright owners. You may not engage in
further distribution of the material for any profitmaking activities or any commercial
gain. You may freely distribute both the url (
http://
strathprints
.strath.ac.uk
) and the
content of this paper for research or study, educational, or not-for-profit purposes
without prior permission or charge. You may freely distribute the url
(
http://
strathprints
.strath.ac.uk
) of the Strathprints website.
Solar dryer with thermal storage and biomass backup heater
A. Madhlopa
a,∗G. Ngwalo
ba
Department of Physics and Biochemical Sciences,
b
Department of Mechanical Engineering, Malawi Polytechnic, P/Bag 303, Blantyre 3, Malawi.
Abstract
An indirect type natural convection solar dryer with integrated collector-storage solar and biomass backup heaters has been designed, constructed and evaluated. The major components of the dryer are biomass burner (with a rectangular duct and flue gas chimney), collector-storage thermal mass and drying chamber (with a conventional solar chimney). The thermal mass was placed in the top part of the biomass burner enclosure. The dryer was fabricated using simple materials, tools and skills, and it was tested in three modes of operation (solar, biomass and solar-biomass) by drying twelve batches of fresh pineapple (Ananas comosus),with each batch weighing about 20 kg. Meteorological conditions were monitored during the dehydration process. Moisture and vitamin C contents were determined in both fresh and dried samples. Results show that the thermal mass was capable of storing part of the absorbed solar energy and heat from the burner. It was possible to dry a batch of pineapples using solar energy only on clear days. Drying proceeded successfully even under unfavorable weather conditions in the solar-biomass mode of operation. In this operational mode, the dryer reduced the moisture content of pineapple slices from about 669 to 11% (db) and yielded a nutritious dried product. The average values of the final-day moisture-pickup efficiency were 15, 11 and 13 % in the solar, biomass and solar-biomass modes of operation respectively. It appears that the solar dryer is suitable for preservation of pineapples and other fresh foods. Further improvements to the solar chimney design are suggested to avert reverse thermosiphoning at night or during periods of low insolation.
Key words: Natural convection, thermal storage, efficiency.
1. Introduction
Dehydration is a common technique for preservation of agricultural and other products, including fruits and vegetables. In developing countries, the traditional method of dehydration is by open air, which often results in food contamination and nutritional deterioration (Ratti and Mujumdar, 1997). Some of the problems associated with open-air drying can be solved through the use of solar dryers which are generally classified, depending on the mode of heating or operation, into: a) direct, b) indirect and, c) mixed mode systems with natural or forced circulation of the drying air. In the direct
dryer, solar radiation passes through a transparent cover fitted on the top part of the dryer and is directly absorbed by the crop placed on the drying bed under the transparent cover. In an indirect dryer, air is heated in a separate solar collector and circulated through the drying bed where it picks moisture from the crop. The mixed mode possesses both features of the direct and indirect categories of solar dryers. In particular, dryers of the natural-convection variety are popular because they are cheap and simple to operate and maintain (Soponronnarit, 1995). They exhibit enormous potential for exploitation in remote areas of developing countries, where most of the rural communities have no access to electricity. Nevertheless, one disadvantage of solar drying is that the dehydration process is interrupted at night or under low insolation, resulting in a poor quality of the dried product.
Several attempts have been made to overcome the problem of intermittent drying in natural convection solar drying. One approach has been the use of thermal storage. Khanna (1967) studied design data for solar heating of air using a heat exchanger (heat transfer by both natural and forced modes). It was found that the data would assist in obtaining the final design of a shell-and-tube heat exchanger for use in drying a specific material. Ayensu and Asiedu-Bondzie (1986) constructed a dryer with thermal storage, from locally available materials. The system was capable of transferring 118 W m-2 to the drying air. Ayensu (1997) designed and constructed a solar dryer with a rock storage system. It was found that the rock pile stored enough energy to enhance nocturnal drying. The duration of crop drying in the solar dryer was shorter than that in the open air. Aboul-Enein et al. (2000) developed a solar air heater and tested it with and without thermal storage for drying agricultural products. They found that the drying process would continue at night when a thermal mass was used. El-Sebaii et al. (2002) developed a solar dryer with a thermal storage system. The dryer was tested with and without thermal storage. They found that the storage material reduced the drying period. Enibe (2002) used a phase change material to store thermal energy in a solar air heating system. It was found that the system could be operated for crop drying and poultry egg incubation. In all these studies, solar energy was used exclusively. However, the intensity of solar radiation is sometimes so low that the temperature of the thermal mass may rise by an insignificant margin above the ambient level, and thereby limiting the continuity of dehydration. There is, therefore, still need to backup the drying process in solar dryers with thermal mass.
backup heater. The thermal performance of their system was satisfactory. Prasad and Vijay (2005) also developed a direct solar-biomass dryer. The biomass burner has a rock slab on the top part which helps in moderating the
temperature of the drying air. These dryer designs have a backup heater without thermal storage of captured solar energy. Consequently, the air temperature in the drying chamber drops down to ambient level immediately after sunset, requiring backup heating even when the preceding day is sunny. This leads to wastage of both solar and fuel resources.
Biomass (especially fuelwood) is a dominant source of energy, and commonly burned using inefficient technologies in most developing countries (Kristoferson and Bokalders, 1991; Bena and Fuller, 2002; Kaygusuz and Türker, 2002). So long this resource is harvested sustainably, it can provide the required backup thermal energy for solar drying in developing countries. However, information is scarce on solar drying with integrated collector-storage solar and biomass-backup heaters.
In this study, an indirect type natural convection solar dryer with integrated collector-storage solar and biomass backup heaters was developed. The absorber of the solar air heater was a horizontal concrete structure integrated to a rock bed. The backup heater was integrated to the solar collector and operated on wood shavings. The dryer was tested in three operational modes (solar, biomass and solar-biomass) by drying fresh pineapples (Ananas comosus) outdoors under different weather conditions. Results show that the dryer is capable of reducing the moisture content of pineapple slices to acceptable levels, and retaining part of the vitamin C in the slices. The drying process is fastest in the solar-biomass mode of operation while the efficiency of the dryer is most satisfactory in the solar mode. Other results are presented and discussed.
2. Design and construction
2.1 Solar collector, drying chamber and chimney
An indirect solar dryer was designed and constructed with a biomass backup burner (Figs. 1-3). The dryer has a solar collector, drying cabinet and backup heater. The size of the collector was based on meteorological and crop parameters. To dehydrate a fresh food with an initial mass (m1), the required mass of dry air (ma) to vaporize water (mw) from the
fresh food can be calculated by (Ayensu, 1997):
mw = m1(M1-M2)/(100-M2) (1)
q = Fa(hp – hi) (3)
It can be shown, using Eq.(3), that the collector aperture area (A) required to capture the total amount of thermal energy in time τ is:
A =
m
a(
h
p−
h
i)
/(
η
tH
d)
(4a)Hd =
∫
2
1
τ
τ
τ
Id
(4b)The solar system under discussion was designed to dehydrate 20.0 kg of pineapples in 259200 s, under the prevailing meteorological and food conditions shown in Table 1, with an assumed thermal efficiency ηt = 0.24. From Eq. (2), the
mass of water evaporated in 259200 s is about 16.7 kg. Using pyschrometric principles, ambient air is heated from point A (temperature Ta = 303 K,relative humidity φ = 80 %, specific volume vs = 0.89 m3 kg-1) to point B (Tp= 313 K,
φ = 47 %) at constant humidity ratio (W) as shown in Fig. 4. The heated air (in plenum) passes through the drying bed and picks up moisture from the fresh food at constant enthalpy, increasing W from 0.0216 to 0.0272 kg/kg of dry air at point C where it is assumed saturated at φ = 90% and T = 305 K above the drying bed. Under these meteorological conditions (Table 1), A = 2.2 m2,and the mass flow rate of dry air is 0.0115 kg s-1. The collector of the dryer has a horizontal concrete absorber that is painted matt black on its top part and integrated to the rock pile (Fig. 3). It is enclosed in a wooden frame (constructed from block board, 0.02 m thick) mounted on the top part of the brick wall that houses the burner using metal straps mortared into the top part of the brick wall. The exterior part of the vertical faces of the collector was covered with a painted galvanized iron sheet (6 x 10⁻⁴ m thick) to protect the wood from
weathering.
thickness (0.10 m) of the horizontal rock-and-concrete bed was used. A single glass cover was fitted on the top part of the collector and inclined at 16o to the horizontal with the system facing north to optimize solar collection at the Malawi Polytechnic (15o 48′ S, 35o 02′ E).
The drying chamber was also constructed from block board (0.02 m thick) and covered with a painted galvanized iron sheet (6 x 10⁻⁴ m thick). It accommodates three trays, each with a plastic mesh base, which slide horizontally along wooden rails fixed to the vertical sides of the cabinet. These trays have an effective area of 4.1 m2, accommodate about 20 kg of fresh pineapple and can be removed for cleaning. The top surface of the cabinet is opaque, and inclined at 16o to the horizontal to facilitate drainage of rain water and flow of air from the plenum through the drying bed into the venting systems. Two wooden doors (1.20 m x 1.51 m), with an air vent (rectangle of 0.51 m by 0.10 m with semicircles on both short vertical sides) on the top part of each door, were fitted at the back of the chamber for
accessing the trays. A wire mesh was fitted on the vents to keep away insects and rodents. In addition, an overhang was fitted over the outlet-air vents to prevent raindrops from entering the drying chamber through the vents, and a solar chimney was fitted on top of this chamber to increase natural convection of the drying air. The chimney was also made from a galvanized iron sheet (6 x 10⁻⁴ m thick) and painted matt black. The chamber was integrated to the collector. Some steps were constructed on the southern side of the system for ease of product loading and off-loading.
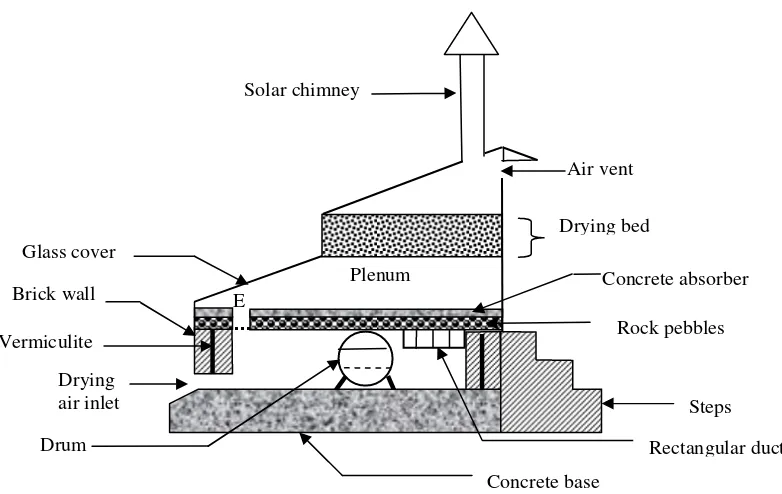
Drying air enters the system through a rectangular inlet (1.00 m x 0.09 m) with a wire mesh, at the bottom part of the brick wall and gets into contact with the bare exterior part of the drum, without mixing with the flue gas. The heated air rises, by natural convection, into the drying chamber through another rectangular hole (1.00 m x 0.09 m) on the concrete absorber (location E in Fig.3). It passes through the drying bed (of effective thickness Hdd≈ 0.3 m) and exits
through a solar chimney or air outlet vents on the top part of the doors to the drying chamber.
Air flow is induced by the difference between temperatures of air in the system components and ambient air (Fig.5). The thermal buoyancy (∆P) in the system components is given by (Bala and Woods, 1994):
∆P = gβρa(∆TH) (5)
Tch = Ta + (Tco – Ta)(1- exp(-R))/R (6)
R = πDscULZ/(FaCa) (7)
The total thermal buoyancy of the drying air (∆Pta) was found by summing up the contribution from the major
∆Pta = ∆Pbu+∆Pco +∆Pdd +∆Psc (8)
There is resistive pressure (∆Pra) within the air passage components:
∆Pra = 0.5ρa (Kbu+Kco+Ksc)U2+KddU (9)
The coefficients Kbu, Kco and Ksc were computed according to ASHRAE (2001), assuming the a) burner enclosure is
rectangular, b) collector is an asymmetric diffuser (because the glass cover is inclined to absorber), c) chimney is cylindrical, and d) flow of air is viscous and fully-developed.
As the drying air leaves the burner enclosure, it passes through a narrow horizontal rectangular slot, resulting in contraction and pressure loss. In the collector, the drying air flows from a narrower cross-sectional area to a wider section at the exit from the collector resulting in air expansion and pressure loss. These losses are included in the computation of pressure loss coefficients.
Kbu = fbuHbu/Dbu+ Kc (10)
Where Kc accounts for pressure loss during contraction and is computed according to Miller (1979).
Kco = fcoLco/Dco + Ke (11)
Ke was computed according to (ASHRAE, 2001) for air flowing from a narrow section into a room, while Ksc was
calculated by (Bala and Woods, 1994; ASHRAE, 2001):
Ksc = fscHsc/Dsc (12)
For laminar flow, the friction factor f can be calculated from (Bala and Woods, 1994; ASHRAE, 2001):
f = 64/Re (13a)
Re = urD/ν (13b)
where ur is a reference velocity in a given system component.
In this study, ur was calculated from the mass flow rate obtained by psychrometric analysis:
ur = vsFa/Ac (14)
where Ac is the area of the reference cross-section in a component.
Kdd was calculated from the correlation reported by Ayensu (1997). System drying air velocity (U) was found by
equating the total thermal buoyancy to resistive pressure (Bala and Woods ,1994; 1995):
For Dsc = 0.18 m, the solar chimney height Hsc was theoretically varied from 1.0 to 2.0 m. It was found that U varied
from 0.0333 to 0.0410 m s-1, with corresponding volume flow rates of 0.0455 to 0.0560 m3 s-1 through the drying bed. This range of air flow rate would be adequate for drying under the design weather conditions.
2.2 Biomass back up heater
In case of low solar irradiation during the day, the drying process can be backed up by a biomass heater. In this study, the backup heater was made of a drum, rectangular duct and flue gas chimney. The drum has a horizontal baffle and mild steel grill. The baffle is 0.06 m above the grill while the grill is fitted 0.20 m above the bottom part of the drum. A truncated circular removable lid was tightly-fitted on the open end of the drum through which biomass was loaded into and ash removed from the drum, with a rectangular steel door (with a cavity, 0.025 m thick and filled with vermiculite) fitted on the outer side of the lid. The door was perforated (total area of perforation = 3.55 x 10⁻³ m2) in the bottom part for inlet of air into the combustion chamber (drum). The size of the perforated area was based on the estimated volume flow rate of air required for combustion. The drum was integrated to a rectangular duct (0.98 m x 0.48 m x 0.16 m) with 3 vertical baffles spaced at equal intervals to increase the path length of the flue gas and the amount of heat transferred to the drying chamber. Round steel bars (0.016 m diameter) were placed across the drum and duct at 0.3 m apart, and an expanded metal placed on top of the bars.
To design the flue gas chimney, it was assumed that 8 kg of biomass would be required to back up the drying process for about 43200 s from sunset to sunrise the next day. The required mass of air for complete combustion of the fuel (20 % excess air) and the mass of flue gas produced were calculated according to ASHRAE (2001). The flue gas flows through the drum, rectangular duct and exits through the flue gas chimney. The thermal power lost (qgf ) to ambience
through the flue gas is given by (ASHRAE, 2001):
qfg = Ffg Cfg (Tfe – Ta) (16)
Eq. (16) shows that decreasing the flue gas exit temperature (Tfe) reduces qfg. One way of achieving this is by
increasing the resistive pressure (∆Prf) to flue gas flow induced by thermal buoyancy in different components of the
flue gas circuit. In the present work, the major contributor of thermal buoyancy (∆Ptf) is the flue gas chimney because
the drum and the rectangular duct are horizontal. ∆Ptf was calculated as for ∆Pta, with Tco substituted by Tfe.
∆Prf = 0.5(Kdr + Kdu +Kfc) ρaV 2
where Kdr is the sum of the pressure loss coefficients of friction experienced by the flue gas as it leaves the drum
(wide) and enters the rectangular duct (narrow), Kdu is the sum of the pressure loss coefficients of friction and bends
(assumed right-angled for laminar flow) within the duct, and Kfc is the pressure loss coefficient of friction in the
chimney. These coefficients were computed as for the solar mode of operation, with a reference velocity (vr) of the flue
gas in a component calculated from Ffg. The velocity of the flue gas was calculated from:
∆Ptf = 0.5(Kdr + Kdu +Kfc) ρaV2 (18)
The height of the flue gas chimney was theoretically varied from 2 to 3 m for Dfc = 0.12 m and Tfe = 353 K. It was
observed that V increased from 0.2350 to 0.2824 m s-1, with corresponding volume flow rates through the drum increasing from 0.0621 to 0.0726 m3 s-1, which was adequate for the required volume flow rate of air for fuel
combustion in the drum. It was also necessary for the flue gas chimney to be discharging the flue gas above the drying chamber to prevent filtration of smoke into the drying chamber. Consequently, the height of the flue gas chimney was set at 2.12 m. The chimney (constructed from a galvanized iron sheet, 6 x 10⁻⁴ m thick) was fitted to the duct, and a hole was drilled at the bottom of the knee bend into the chimney to drain out flue-gas condensate from the system (ASHRAE, 2001). The biomass burner was enclosed in a brick wall (2.52 m x 1.55 m) with a cavity (0.05 m thick) which was filled with vermiculite to reduce heat loss through the wall.
3. Experimentation
3.1 Sample fruit and preparation
Pineapples are an important crop in tropical countries. They are eaten fresh or mostly canned into juice and other products (Tanaka et al., 1999). However, technologies for canning or storing fresh fruits are very limited in developing countries. In addition, farmers face problems of shipping fresh fruits from rural areas to potential markets in urban areas of these countries, resulting in spoilage of the fresh produce and economic loss. Solar drying can be employed in remote areas to preserve harvested pineapples for local consumption or safe distribution.
3.2 Operational modes
The dryer was tested outdoors in three different operational modes: solar, biomass and a combination of the two energy sources. For the solar mode of operation, a batch of fresh pineapple slices was weighed, loaded into the dryer in the morning and re-weighed after 86400 s and on the final day of drying. For the biomass mode of operation, drying of a batch started in the evening. The aperture of the dryer was covered with a ceiling board (a black polythene paper was pasted on the top part of the board) which was parallel to and extended by 0.6 m beyond the perimeter on all sides of the glass cover, with an air gap of 0.6 m between the board and the transparent cover (ASHRAE, 1988 ). To block radiation when the altitude of the sun was low, a vertical removable ceiling board (wrapped in a black polythene paper) was fitted on the eastern side in the morning and western side of the collector in the afternoon. The location of this shield was changed around solar noon and immediately after sunset. The burner was charged with 8 kg of wood shavings and ignited around sunset. Again, the batch was re-weighed after 86400 s of drying. Due to lack of automated instrumentation for recording temperatures at night, the burner was charged with biomass fuel at sunrise, with the solar aperture covered, to establish the maximum levels of plenum temperatures. The door to the biomass burner was opened or closed to control the rate of combustion. For the solar-biomass mode, the burner was again charged once with the biomass fuel around sunset, and the samples were re-weighed after 86400 s and on the final day of drying.
3.3 Measurement of meteorological variables
3.4 Physico-chemical analysis
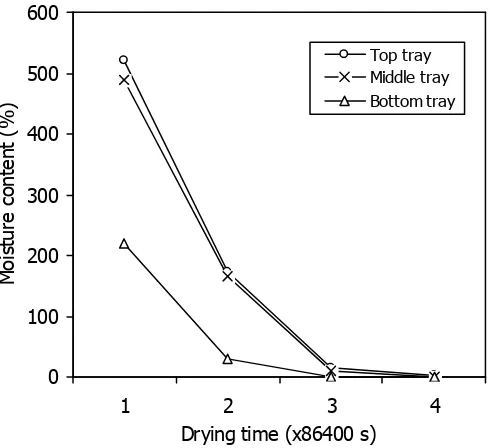
The moisture content of fresh and dried samples was determined by drying an accurately-weighed (5 g) sample in an electric oven (Griffin, serial number 0518171070) at 343 K for 21600 s (AOAC, 1990). The loss in moisture was calculated as a percentage of the mass of the dry sample. The uniformity of drying at different levels of the trays was determined by weighing all the pineapple slices from each tray. In addition, five samples were taken from different positions of each tray to establish the uniformity of drying across the tray (Fig.7).
Early studies indicate that vitamin C is particularly vulnerable to destruction under different conditions (air, light and heat) and during processing (Drew and Ree, 1980; Fellows and Hampton, 1992). So, the retention of vitamin C is used as a good indicator of the preservation of all other nutrients (Maeda and Salunkhe, 1981). Consequently, the retention of vitamin C was used as an indicator of nutritional quality in this study. The concentration of vitamin C in fresh and dried pineapple samples was determined according to AOAC (1990), and expressed on dry basis. The percentage retention (Rv) of vitamin C was computed by:
Rv = 100 Vd/Vw (19)
where Vd is the concentration of vitamin C in dried samples on dry basis (kg/kg of sample), and Vw is the concentration
of vitamin C in fresh samples on dry basis (kg/kg sample).
3.5 Data processing
During solar collection, the top part of the thermal mass absorber heats up faster than the bottom part. The thermal energy is conducted through the rock pile until an equilibrium state is established. During heat charging using the biomass heater, the bottom part of the thermal mass heats up faster than the top part until equilibrium temperatures are again established. However, due to lack of suitable instruments for measuring temperature in the bottom part of the storage unit, only temperatures on the top part were monitored. In view of this, the temperatures on the bottom part of the thermal mass were found by calculation.
Heat (qat-as) is conducted from the top surface of the concrete absorber plate (T = Tat) to the interface (T = Tas) between
the absorber plate and the rock matrix, and heat (qas-st) is conducted from the interface to the bottom of the rock pile (T
= Tst). In a steady state, the rate of heat transfer from the interface to the bottom of the rock pile is equal to the rate of
qat-as = qas-st (20)
qas-st = qc,st-a + qr,st-bo + qr,st-wa (21)
qr,st-bo = qbo-gr (22)
qr,st-wa = qwa-a (23)
qat-as = kabAab(Tat – Tas)/xab (24)
qas-st = ksAs(Tas – Tst)/xs (25)
qc,st-a = Asthc,st-a (Tst – Ta) (26)
qr,st-bo = hr,st-bo (Tst – Tbo) (27)
qr,st-wa = hr,st-a (Tst – Twa) (28)
qwa-a = [2xwa/(Awakwa) + xve/(Awakve )] -1
(Twa – Ta) (29)
qbo-gr = kboAbo(Tbo – Ta)/xbo (30)
All the coefficients of heat transfer were computed according to (Incropera and DeWitt, 2002), assuming the a) rock bed is a horizontal plate cooled from the bottom, b) rock bed and the concrete base are parallel plates, and c) rock bed is perpendicular to the wall enclosing the burner (for calculation of view factors). Properties of air were calculated at 0.5(Tst+Ta). Eqs.(19-28) were solved simultaneously using the Gauss-Seidel iterative method to find Tas and Tst, with
ground temperature assumed at ambient level (Duffie and Beckman, 1991). The total heat stored (qsr) by the absorber
concrete plate and rock bed was calculated as follows:
qsr = mabCab(Tma –Ta) + msCs(Tms –Ta) (31a)
Tma = 0.5(Tat + Tas) (31b)
Tms = 0.5(Tas + Tst) (31c)
During biomass burning, the bottom part of the rock bed receives a relatively high quantity of heat through convection and radiation from the hot drum. So, the bottom part of the storage structure would be hotter than the top part of the absorber plate. In view of this, a similar computational procedure (to that for the solar mode of operation) was used with Tst > Tat and the following additional heat balance equations:
Aabkab(Tas – Tat)/xab = (Aghc,ab-g + hr,ab-g)(Tat- Tg) + (Aabhc,ab-da)(Tat- Tp) (32)
(Aghc,ab-g + hr,ab-g)(Tat- Tg) = (Aghc,g-a + hr,g-a)(Tg- Ta) (33)
Moisture-pickup efficiency (ηW) varies with the nature and moisture content of the fresh product. Unfortunately, there
Leon et al. (2002) recommend the use of the first- and final-day efficiencies for evaluation of drying efficiency. In this study, ηW was computed by using the procedure reported by Bena and Fuller (2002) and Leon et al. (2002):
ηW = mWhwg/(AcoHd + Cvmb) (34)
The calorific value of the biomass (Cv) was determined using a Gallenkamp automatic adiabatic bomb calorimeter (cat.
no. 15 CB 110) and corrected for moisture content. The latent heat of vaporization (hwg) was calculated using a
temperature dependent function reported by Jannot and Coulibaly (1998), and increased by 15 % to include the extra energy required for evaporating moisture from biological materials (Hall, 1957):
hwg = 2.5018 – 0.002378 (Twp -273.15) (35)
The wet bulb temperature (Twp) of the drying air in the plenum was computed using the procedure recommended by
ASHRAE (1994).
4. Results and discussion
4.1 Weather conditions
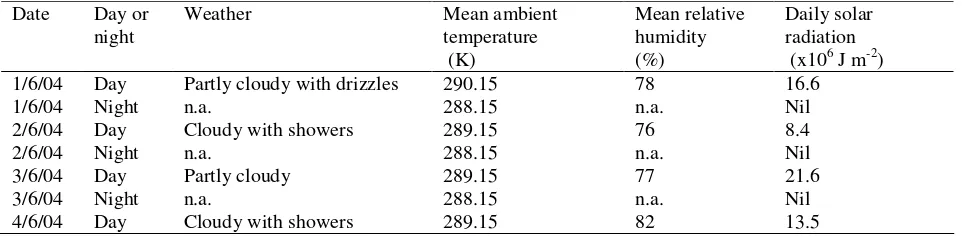
Table 2 shows the variability of average weather conditions during the dehydration of a typical batch of fresh pineapple slices. The weather was favorable on some of the days. The levels of relative humidity ranged from 76 % to 82 %, with mean ambient air temperatures varying between 288 and 290 K. It is seen that the daily global solar radiation on an inclined plane (16 o to the horizontal) was variable, ranging from 8.4x 10⁶ to 2.16 x10⁷J m-2. These weather conditions indicate that drying would not proceed quickly on some days if a biomass backup heater was not used. However, the daily intensity of solar radiation was quite high on some days (typically 3.07 x10⁷ J m-2 on 22nd November 2004), which shows the potential for using the dryer without backup heating under sunny weather conditions.
4.2 Air and flue gas temperature
The plenum air passes through the drying bed where it picks up moisture from the drying food by natural convection. Figs. 8 (a-d) show the variation of mean plenum and ambient air temperatures on typical days of drying. For the solar mode of operation, it is seen that the plenum and ambient temperatures are almost equal in the morning but different during the day. In particular, the plenum temperature is higher than the ambient temperature during most of the day. The plenum-ambient temperature difference (excess temperature) was 17 K at 13:00 h, about 3600 s behind the time when the maximum solar irradiation was observed. The excess temperature was 12 K at 17:00 h and it dropped down to 0 K by the next morning. This indicates that the dryer stored part of the captured solar energy (stored energy qsr ≈
that a temperature difference (between ambient and drying air) of at least 10 K is required for drying to continue. This shows that drying continued even after sunset.
For the biomass mode of operation, the plenum temperature was initially monitored without any fire in the burner. It was found that there was insignificant difference between the plenum and ambient temperatures during the day, which indicated that the insulation cover over the solar collector was effective in blocking off irradiation during the day. When the burner was charged in the morning, it was observed that the combustion process proceeded for about 36000 and 21600 s with the burner door closed and open respectively, which indicates that closing the burner door reduced the rate of combustion (The combustion process yielded grey ash, which is satisfactory). It is observed that the plenum temperature is higher than ambient temperature immediately after 06:00 to 17:00 h, with maximum values of 314 and 329 K on typical days shown in Figs. 8 (b-c)). There is an excess temperature of at least 10 K within the plenum for over 604800 s during the day. In particular, it should be noted that the excess plenum temperatures were 10 and 27 K with the burner door closed and open at 17:00 h respectively. This is attributed to the stored thermal energy (qsr≈ 9.0
x106 and 1.86 x10⁷ J with the burner door closed and open respectively) which was released slowly into the plenum even after the completion of combustion. It is observed that leaving the burner door open leads to higher plenum temperatures. The flue gas temperature (Tg) was variable, with observed maxima of 326 and 383 K on typical days
with closed and open burner door, respectively. A similar trend (higher values of Tg with open burner door) was
observed on other test days, which is attributed to increased supply of excess air for combustion.
For the solar-biomass mode of operation, it is observed that the plenum temperature was higher than ambient temperature from 06:00 h to 17:00 h (stored biomass energy = 1.02x10⁷J), with excess temperature increasing to a maximum value of 18 K around 09:00 h and 10:00 h, then dropping down to 7 K at 17:00 h. Moreover, the burner was re-charged with wood shavings at sunset. So, food dehydration proceeded satisfactorily during both day and night in this mode of operation.
4.3 Drying time and uniformity
fruit. It should also be mentioned that the drying product was not removed daily from the dryer after sunset because the stored thermal energy enabled drying to proceed at night. So, the dryer can be exclusively powered by solar energy to dehydrate a fresh food to the required level of moisture under favorable weather conditions, thereby saving biomass fuel.
For the biomass mode of operation (with a non-irradiated collector), it was observed that the dryer reduced the moisture content of a batch from 614±14 % (db) to 13±0 % (db) in 259200 s. Again, there was significant variation in the moisture content of fresh samples. Prolonging the dehydration process to 302400 s resulted in an over-dried product. The rate of drying in this mode of dryer operation was higher than that of the solar mode, which is attributed to the higher amount of energy supplied by the wood shavings (measured Cv = 1.76x10⁷ J kg-1) than that from the sun.
The solar-biomass mode of operation was used to study the time and uniformity of drying. Fig.9 shows the variation of the mass and moisture content of a typical batch of pineapples. It is observed that the rate of drying was highest during the first 86400 s, with the mass of the batch dropping from 20.01 kg to 12.28 kg. The mass of the sample was 2.90 kg after 259200 s, with negligible drying thereafter. It is seen that the moisture content dropped from of 669±24 % to 11±0 % (db) in 259200 s, with the intensity of the daily global solar radiation varying from 1.52 to 2.15x10⁷ J m-2. It is again seen that there was significant variation in the moisture content of fresh samples. Lower final levels of moisture content can be achieved in shorter drying periods with higher intensities of global radiation. Leon et al. (2002) recommend a final moisture content of 10 % (wet basis, wb), which is equivalent to 11 % (db), for evaluation of solar dryers. It should also be mentioned that long drying periods contribute to loss of vitamin C (Negi and Roy, 2000). So, the final moisture level obtained after drying a batch of pineapple slices for 259200 s was within acceptable limits when the solar dryer was backed up by a biomass burner.
The uniformity of drying across the bottom tray is shown in Fig.11. It is seen that samples from positions A and B (in front of the tray) dried fastest with those at positions C and D (back of tray) exhibiting the least drying rate. The middle sample (position O) exhibited an intermediate rate of drying. A similar pattern of drying uniformity was observed across the middle and top trays, with the drying rate being most non-uniform across the top tray. These observations are again attributed to the moisture content of the heated air as it passes through the drying bed. A similar drying pattern is expected for the solar and biomass operational modes.
4.4 Vitamin C
The concentration of vitamin C in fresh pineapples varied from 2.2 to 3.4x10⁻⁴ kg/kg (wb) of sample, with a mean value of 2.6±0.4 x10⁻⁴ kg/kg (wb). These results are in close conformity with findings (2.0-4.0 x10⁻⁴ kg/kg, wb) of Moser (1991). The retention of vitamin C in dried pineapple samples varied from 26 to 44 %. Maeda and Salunkhe (1981) report vitamin C retention values of 0.4-24.4 % in four different vegetables dried using solar dryers with and without shade over the drying product. They observed that there was higher retention of vitamin C in a solar dryer with shade (indirect solar drying). Wang et al. (1992) found a vitamin C loss of 82 % in the course of drum-drying potatoes. The relatively high losses in vitamin C are ascribed to the high sensitivity of this type of vitamin to different processes (blanching, drying, sample preparation) and conditions (Drew and Ree, 1980; Fellows and Hampton, 1992).
Consequently, the levels of vitamin C retention found in the present study are satisfactory.
4.5 Drying air flow
For diurnal operation with the loaded dryer, the estimated air flow rate measured from position E (Fig. 3) varied from 0.017 to 0.036 m3 s-1 (mean value of 0.024 ± 0.002 m3 s-1) when the dryer was operated with the solar chimney and wind speed < 2.0 m s-1. Enibe (2002) found a maximum flow rate of 0.058 kg s-1 for a natural convection solar air heating system.
4.6 Dryer efficiency
Table 3 shows the first-day (η1) and final-day (η2) moisture-pickup efficiencies of the dryer (reported errors are
standard). For the first-day efficiency, it is seen that the solar mode of operation exhibits the highest mean value, with the biomass mode showing the lowest value. This is probably due to the high heat losses through the flue gas, which results in a lower efficiency than that for the solar mode of operation. For the final-day efficiency, it is again observed that the system efficiency is highest (15 %), lowest (11 %) and intermediate (13 %) in the solar, biomass and solar-biomass modes of operation respectively. Brenndorfer et al. (1985) reports that typical efficiency values for a natural convection solar dryer are 10-15 %. Bena and Fuller (2002) report efficiency values of 22, 6 and 8.6 % for a direct type free-convection solar dryer operated in the solar, biomass and solar-biomass modes of operation respectively. Consequently, the performance of the present solar dryer is satisfactory.
5. Conclusion
Nomenclature
A area (m2)
C specific heat capacity of air at constant pressure (J kg-1 K-1) Cv calorific value of biomass (Jkg
-1
) D diameter or hydraulic diameter (m) f friction factor in burner enclosure F fluid flow rate (kg s-1)
h specific enthalpy (J kg-1)
hc convective heat transfer (W m-2 K-1)
hr radiative heat transfer (W m -2
K-1)
hwg latent heat of vaporization of water (J kg-1)
H vertical height (m) K coefficient of pressure loss
k coefficient of heat conductivity (W m-2 K-1) I instantaneous solar irradiation (W m-2) L length (m)
m mass (kg)
M moisture content (%) Nu Nusselt number q thermal power (W)
∆P pressure drop (Pa) Q total thermal energy (MJ) Re Reynolds number Rv retention of vitamin C
T temperature (K)
∆T difference between ambient and component air temperature (K) ur reference air velocity (m s
-1
) U velocity of drying air (m s-1)
UL overall heat transfer coefficient from chimney (W m -2
vr reference velocity of flue gas (m s-1)
vs specific volume of air (m3 kg-1)
Vd concentration (db) of vitamin C in solar-dried sample (kg/kg of pineapple)
Vw concentration (db) of vitamin C in fresh sample (kg /kg of pineapple)
W humidity ratio (kg/kg of dry air) x thickness (m)
Z height above drying bed as shown in Fig. 5, (m)
Greek letters
β coefficient of thermal expansion
ν kinematic viscosity (m2 s-1)
φ relative humidity (%)
η efficiency of dryer
ρ air density (kg m-3)
Subscripts
1 initial 2 final a air/ambient ab absorber at absorber top part b biomass
da drying air
bo bottom concrete base bu burner
co collector dd drying bed db dry basis dr drum du duct
fc flue gas chimney
i inlet
ip initial pineapple p plenum
pm mean plenum r radiative
ra resistance to drying air flow rf resistance to fflue gas flow s storage bed
sc solar chimney sr stored
st rock storage bottom t thermal
ta thermal buoyancy of drying air tf thermal buoyancy of flue gas tm thermal mass
ve vermiculite w moisture/water wa wall
wb wet basis
wp wet bulb in plenum
Acknowledgements
The authors are very grateful to the National Research Council of Malawi for the financial support. The Malawi polytechnic is also acknowledged for the logistical and technical support.
References
Aboul-Enein, S., El-Sebaii, Ramadan, M.R.I., El-Gohary, H.G., 2000. Parametric study of a solar air heater with and without thermal storage for solar drying. Renewable Energy 21, 505-522.
AOAC, 1990. Official methods of analysis of the Association of Official Analytical Chemists,vol.2. AOAC, Inc., Virginia.
ASHRAE, 1988. Methods of testing to determine the thermal performance of solar domestic water heating systems, standard 95-1987. American Society of Heating, Refrigerating and Air-conditioning Engineers, Atlanta. ASHRAE, 1994. Standard method for measurement of moist air properties, standard 41.6-94. American Society of
Heating, Refrigerating and Air-conditioning Engineers Atlanta.
ASHRAE, 2001. Fundamentals Handbook. American Society of Heating, Refrigerating and Air-conditioning Engineers, Atlanta.
Ayensu, A., 1997. Dehydration of food crops using a solar dryer with convective heat flow. Solar Energy 59,121-126. Ayensu, A., Asiedu-Bondzie, V., 1986. Solar drying with convective self-flow and energy storage. Solar & Wind
Technology 3, 273-279.
Bala, B.K. and Woods, J.L., 1994. Simulation of the indirect natural convection solar drying of rice. Solar Energy 53, 259-266.
Bala, B.K. and Woods, J.L., 1995. Optimization of natural convection, solar drying systems. Energy 20, 285-294. Bassey, M.W., Whitfield, M.J., Korama, E.Y., 1987 Problems and solutions for natural convection solar crop drying.
In solar crop drying in Africa – Proceedings of food drying workshop, Dakar, Bassey M.W. and Schmidt O.G. (eds), IDRC, Ottawa, Canada.
Bena, B., Fuller, R.J., 2002. Natural convection solar dryer with biomass backup heater. Solar Energy 72, 75-83. Brenndorfer, B., Kennedy, L., Bateman, C.O., Trim, D.S., Mrema, G.C., Wereko-Brobby, C., 1985. Solar dryers –
Their role in post harvest processing. Commonwealth Science Council, London.
Drew, F., Ree, K.I.S., 1980. Energy use, cost and product quality in preserving vegetables at home by canning, freezing and dehydration. Food Science 45, 1561-1565.
Duffie, J.A. and Beckman, W.A., 1991. Solar engineering of thermal processes. John Wiley & Sons, Inc., New York, pp.393-399, 660-661.
Enibe, O.S., 2002. Performance of a natural circulation solar air heating system with phase change material energy storage. Renewable Energy 27, 69-86.
El-Sebaii, A.A., Aboul-Enein, S., Ramadan, M.R.I., El-Gohary, H.G., 2002. Experimental investigation of an indirect type natural convection solar dryer. Energy Conversion and Management 43, 2251-2266.
Hall, W.C., 1957. Drying farm crops. Agricultural Consulting Associates, OH.
Incropera, FP., DeWitt, D.P., 2002. Fundamentals of heat and mass transfer, 5th ed. John Wiley & Sons, New York. Jannot, Y. and Coulibaly, Y., 1998. The “evaporative capacity as a performance” index for solar-drier air heater.
Solar Energy 63, 387-391.
Kaygusuz, K., Türker, M.F., 2002. Biomass energy potential in Turkey. Renewable Energy 26, 661-678.
Khanna, M.L., 1967. Design data for solar heating of air using a heat exchange and storage system. Solar Energy 11, 142-144
Kristoferson, L.K., Bokalders, V., 1991. Renewable energy technologies: Their applications in developing countries. Intermediate Technology Publications, Southmpton, pp. 3-19.
Leon, M.A., Kumar, S., Bhattacharya, S.C., 2002. A comprehensive procedure for performance evaluation of solar food dryers. Renewable and Sustainable Energy Reviews6, 367-393.
Maeda, E.E., Salunkhe, D.K., 1981. Retention of ascorbic acid and total carotene in solar dried vegetables.Food Science 46, 1288-1290.
Miller, D.S., 1978. Internal flow systems. British Hydromechanics Research Association Fluid Engineering, pp.260-278
Moser, U., 1991. Vitamin C. In: Machlin, L.J. (ed.), Handbook of vitamins, 2nd ed. Marcel Dekker Inc., New York, pp.195-232.
Negi, P.S., Roy, S.K., 2000. Effects of blanching and drying methods on β-carotene, ascorbic acid and chlorophyll retention of leafy vegetables. Lebensm.-Wiss. u.-Tchnol. 33, 295-298.
Prasad, J., Vijay, V.K., 2005. Experimental studies on drying of Zingiber officinale, Curcuma l. and Tinosopora cordifolia in solar-biomass hybrid drier. Renewable Energy 30, 2097-2109.
Ratti, C., Mujumdar, A.S., 1997. Solar dryer of foods: Modelling and Numerical simulation. Solar Energy 60, 151-157. Sodha, M.S., Bansal, N.K., Kumar, A., Bansal, P.K., Malik, A.E., 1987. In solar crop drying, vol II, CRC Press,
Florida.
Soponronnarit, S., 1995. Solar drying in Thailand. Energy for Sustainable Development 2, 19-25.
Tanaka, K., Hilary, Z.D. and Ishzaki, A., 1999. Investigation of the utility of pineapple juice and pineapple waste material as low-cost substrate for ethanol fermentation by Zymomonas mobilis. Bioscience and
Bioengineering 87, 642-646.
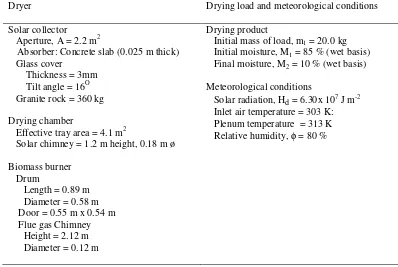
Table 1: Design parameters for a solar dryer with biomass back-up heater.
Dryer Drying load and meteorological conditions Solar collector
Aperture, A = 2.2 m2
Absorber: Concrete slab (0.025 m thick) Glass cover
Thickness = 3mm Tilt angle = 16O Granite rock = 360 kg Drying chamber
Effective tray area = 4.1 m2
Solar chimney = 1.2 m height, 0.18 m ø Biomass burner
Drum
Length = 0.89 m Diameter = 0.58 m Door = 0.55 m x 0.54 m Flue gas Chimney Height = 2.12 m Diameter = 0.12 m
Drying product
Initial mass of load, m1 = 20.0 kg
Initial moisture, M1 = 85 % (wet basis)
Final moisture, M2 = 10 % (wet basis)
Meteorological conditions
Solar radiation, Hd = 6.30x 10⁷ J m-2
Table 2: Weather conditions during one of the tests of the loaded solar dryer. Date Day or
night
Weather Mean ambient
temperature (K)
Mean relative humidity (%)
Daily solar radiation (x106 J m-2) 1/6/04 Day Partly cloudy with drizzles 290.15 78 16.6
1/6/04 Night n.a. 288.15 n.a. Nil
2/6/04 Day Cloudy with showers 289.15 76 8.4
2/6/04 Night n.a. 288.15 n.a. Nil
3/6/04 Day Partly cloudy 289.15 77 21.6
3/6/04 Night n.a. 288.15 n.a. Nil
Table 3: Variation of the first (ηw1)- and final (ηw2 )-day moisture-pickup efficiencies.
Efficiency Operational
mode ηw1
(%)
ηw2
Fig.: 1: Perspective view of the solar dryer.
(a)
(b)
Fig.2: (a) Perspective view of biomass burner, showing drum, rectangular duct and flue gas chimney, b) longitudinal sectional view of the drum, showing flow pattern of flue gas.
Flue gas chimney
Drum
Rectangular duct
To rectangular duct
Combustion air inlet
Biomass
Grill Baffle Truncated lid
Fig. 3: Description of the components of the solar dryer viewed across the burner, drying chamber and solar chimney.
Vermiculite
E
Drying bed
Drying air inlet
Plenum Solar chimney
Air vent
Rock pebbles Concrete absorber
Drum Glass cover
Rectangular duct Steps Brick wall
Fig.4: Illustration of psychrometric drying: Air is heated at constant humidity ratio in the solar collector from point A to point B, and it passes through the drying bed isenthalpically from point B to point C.
303 305 313 Dry bulb temperature (K)
Humidity ratio (kg/kg dry air) 90 %
Relative humidity
0.0272
0.0216 85.2
96.3 Enthalpy
(x103J/kg)
B
A
C 47 %
Fig.5: Cross-sectional view of the solar dryer; showing flow of drying air through the biomass burner housing, drying chamber and solar chimney. Hbu = 0.59 m, Hco = 0.58 m, Hdd = 0.3 m, Z = 1.63 m
and Hsc = 1.2 m.
Drying air
Solar chimney
Hsc
Hbu
Hdd
ρ
aGlass cover
Drum Rectangular duct
Hco
Fig.6: Heat transfer from absorber plate and rock pile to the air and other system components. Air inlet
qr,at-g qc,at-da
qc,st-a
qr,st-wa
qr,st-bo
Rock bed Absorber
Ground
Concrete base
qbo-gr
Wall qc,da-g
qwa-a
Tat
Tas
Fig.7: Positions of five pineapple samples used for determination of drying uniformity across the bottom tray.
A
B
D
C
O
EastWest
North
280 285 290 295 300 305 310 315
6 7 8 9 10 11 12 13 14 15 16 17
Local time (h)
T e m p e ra tu re ( K ) 0 200 400 600 800 1000 1200 1400 S o la r ra d ia ti o n ( W m -2 ) Tmp Ta I (a) 295 300 305 310 315 320 325 330
6 7 8 9 10 11 12 13 14 15 16 17
Local time (h)
280 290 300 310 320 330 340 350 360 370 380 390
6 7 8 9 10 11 12 13 14 15 16 17
Local time (h)
T e m p e ra tu re ( K ) Tmp Tg Ta (c) 295 300 305 310 315 320
6 7 8 9 10 11 12 13 14 15 16 17
Local time (h)
T e m p e ra tu re ( K ) Tmp Ta (d)
Fig.8: Variation of mean plenum (Tpm), flue gas (Tg) and ambient air (Ta) temperatures, and instantaneous
solar irradiation (I) with local time on typical days for different modes of dryer operation: a) solar energy on 28th July, 2004, b) biomass with closed burner door on 30th November, 2004 and c) biomass with open burner door on 21st May, 2004, and d) solar-biomass on 25th February, 2004.
0 100 200 300 400 500 600 700 800
0 1 2 3 4
Drying time (x86400 s)
M o is tu re c o n te n t (% d b ) 0 5 10 15 20 25 M a ss ( k g ) Moisture Mass
0 100 200 300 400 500 600
1 2 3 4
Drying time (x86400 s)
M
o
is
tu
re
c
o
n
te
n
t
(%
)
[image:36.612.187.432.260.484.2]Top tray Middle tray Bottom tray
0 50 100 150 200 250 300 350 400
1 2 3 4
Drying time (x86400 s)
M
o
is
tu
re
c
o
n
te
n
t
(%
d
b
)
Position A Position B Position C Position D Position O