Int. J. Electrochem. Sci., 13(2018) 10274 – 10288, doi: 10.20964/2018.11.05
International Journal of
ELECTROCHEMICAL
SCIENCE
www.electrochemsci.org
The Study of Dielectric Properties and Conductivity Relaxation
of Ion Conducting Chitosan:NaTf Based Solid Electrolyte
Shujahadeen B. Aziz1,2,* Soran M. Mamand1
1
Prof. Hameeds Advanced Polymeric Materials Research Lab., Department of Physics, College of Science, University of Sulaimani, Qlyasan Street, Sulaimani, Kurdistan Regional Government-Iraq
2
Komar Research Center (KRC), Komar University of Science and Technology, Sulaimani, 46001, Kurdistan Regional Government, Iraq
*
E-mail: shujaadeen78@yahoo.com, shujahadeenaziz@gmail.com
Received: 6 June 2018/ Accepted: 12 August 2018 / Published:1 October 2018
The development of ion-conducting chitosan based solid polymer electrolyte has been a subject of great concern due to their large-scale applications. This work shows a study of dielectric properties and conductivity relaxations of chitosan (CS) based solid polymer electrolyte sample. A fixed amount of Sodium trifluoromethanesulfonate (NaCF3SO3) was added to a CS solution for the fabrication of
chitosan-NaCF3SO3 (CS:NaTf) electrolyte sample. . On the basis of both complex permittivity and
complex modulus formalism, the dielectric and conductivity relaxations of the sample were analyzed through impedance data measurements. High values of dielectric constant and dielectric loss were recorded at low frequencies. The dielectric constant and dielectric loss increased with increasing temperature, indicating an increase in conductivity. From the study of frequency dependency of loss tangent, broaden peaks were observed, showing that more than one relaxation process is present. From the real part of electric modulus, the material is featured to be highly capacitive. From the asymmetrical peak shape of the imaginary part of electric modulus, the non-Debye type relaxation is predicted. The main observation shows that the dielectric constant and dielectric loss drop above 388 K. Moreover, the study of surface morphology of the sample exhibited that there are remarkable changes before and after the heat treatment. Lastly, the temperature dependence of peak frequency corresponding to tanδmax and conductivity relaxation time (ηζ) is found to obey the Arrhenius
relationship, which suggests the viscoelastic relaxation for ion transport phenomena.
1. INTRODUCTION
Polymers are appealing materials as matrices in the fabrication of solid polymer electrolytes (SPEs) due to their flexibility, high dielectric strength, low cost and easy processing. The SPE materials based on host polymer matrices with ionic dopant salts are recognized to be a promising class of materials with highly desirable properties [1]. There are many properties that make these materials to be attractive, such as, lightweight, low cost, lack of leakage and desired shapes [2]. Furthermore, polymer electrolytes have superior flexibility over inorganic solids [3]. Polymer salt complexes (i.e., SPEs) are attracting technological importance in the fabrication of solid-state electrochemical devices, such as, batteries, fuel cells, supercapacitors [4], and sensors [5]. The main disadvantage of these materials, which limits their electronics applications, is their low value of permittivity. However, a significant increase in permittivity values can be obtained by incorporating them with different types of fillers. Polymer electrolytes usually hold both crystalline and amorphous phases. It has been reported that the ion conduction mainly dominates in amorphous phase [6]. Chitosan is the deacetylated produce of chitin and considered as the second most abundant natural polymer after cellulose [7]. Chitosan is a polycationic polymer due to the existence of functional groups as one amine (NH2) group and two hydroxyl (OH) groups in their monomers [8]. The ability of
CS to dissolve inorganic alkali metal salts is related to the abundant of these functional groups on CS backbone structure, serving as conjunction sites [9]. The capacity of being molded in various forms, such as films, porous scaffolds and hydrogels, is another important feature of CS [10]. As stated above, CS has received a great attention as a novel bio-functional material for its specific benefits, such as antibacterial activities, antioxidant biodegradation[11], non-toxic [12], biocompatibility, hemostatic, anticholesteremic, anticancerogen [13], hydrophilic character, high mechanical strength and good adhesion properties [14]. Such excellent properties have made CS favorable as membrane/polymer electrolyte in a wide variety of applications, such as membrane filter for water treatment, drug carriers, food packaging and chelating agents [15], dialysis, gas separation, polyelectrolyte complex and blend with a different polymer [16]. Various ion-conducting polymer electrolytes based upon CS have been reported in literatures [17-23]. It has been noted that the conduction mechanism of ions in polymer electrolytes is not fully understood. it depends on several factors, such as degree of salt dissociation, dielectric constant and number of ion [24-29]. The study of dielectric relaxation phenomena is emerged as a powerful tool to understand the ionic transport mechanism and useful in providing an insight into the ionic/molecular interaction in SPE [30]. Extensive research has been focused on polymer electrolytes complexed with lithium (Li) salts. But, a few attempts have been made on electrolytes based sodium complexed films. Uses of sodium (Na) in the polyelectrolytes have several advantages over Li counterparts since Na is available in abundance compared to Li at a cheaper cost as well [31].
In this field, there is no published report on dielectric properties and relaxation dynamics of polymer electrolyte based on chitosan-NaTf. The key purpose of the present study is to examine the dielectric and electrical modulus properties of chitosan-NaCF3SO3 solid polymer electrolyte as a
act as a complete compilation of published examples of the design of ion conducting chitosan based solid electrolyte.
2. EXPERIMENTAL DETAILS
2.1 Materials and sample preparation
Cast technique was used in the fabrication of chitosan based polymer electrolytes. NaCF3SO3
and chitosan (from crab shells; ≥75% deacetylated, Sigma) have been used as the preliminary materials in this study. One gram of CS was dissolved in 100 ml of 1 % acetic acid solution. The CS polymer and the solvent were stirred continuously with magnetic stirrer until the CS polymer powder has been completely dissolved at the laboratory condition. To fabricate the CS based electrolyte 10 wt. % of NaCF3SO3 was dissolved in CS solution and the mixtures were stirred continuously. The solution was
then cast into plastic petri dish and left to dry at room temperature in order to allow complete evaporation of solvent. The film was kept in desiccators with silica gel desiccant for further drying process. The SPE film was cut into small discs (2 cm diameter) and sandwiched between two stainless steel electrodes under spring pressure. The impedance of the films was measured using the HIOKI 3531 Z Hi-tester which is interfaced to a computer in the frequency range from 50 Hz to 1000 kHz and at temperatures ranging between 303 K and 413 K. The software controls the measurements and calculates the real and imaginary parts of impedance.
2.2. Electrical impedance spectroscopy (EIS)
The core concept of using complex impedance spectroscopy technique is to provide insights into electrical properties of materials and their interface region at electronically conducting electrodes. In this technique the term impedance is used in the place of resistance in which phase differences has taken into account. In the other word, a.c., the resistance, R, is replaced by the impedance, Z, which is the sum of resistance and reactance [32]. The real (Z') and imaginary (Z") part of complex impedance (Z*) were used to calculate the real and imaginary parts of permittivity (ε*
) and modulus (M*), using the following relations [18, 33],
)
(
Z
2Z
2C
Z
(1)
)
(
Z
2Z
2C
Z
Tan
(3)
M
C
Z
)
(
2 2 (4)
M
C
Z
)
(
2 2 (5)Here Co is the vaccum capacitance and given by εoA/t, where t is the thickness and A is the area
of the film. The angular frequency ω, is equal to ω =2πf, where f is the frequency of applied field.
3. RESULTS AND DISCUSSION
3.1 Frequency dependence of ε′ and ε″ at selected temperatures
The use of dielectric analysis in examining the conductivity behavior of polymer electrolyte has reached a prime of importance [34-36]. It is a convenient technique to study the ion transport mechanism along with polymer segmental relaxation processes in polymer electrolyte. The complex permittivity function, ε*(ω), is a materials property depending on temperature, structural identity of the
polymer electrolytes and frequency of applied field [37, 38].
0.00E+00 5.00E+03 1.00E+04 1.50E+04 2.00E+04 2.50E+04
1.3 2.3 3.3 4.3 5.3 6.3
Log (f)
303 K 313 K 323 K 333 K 343 K 353 K 363 K
ε′
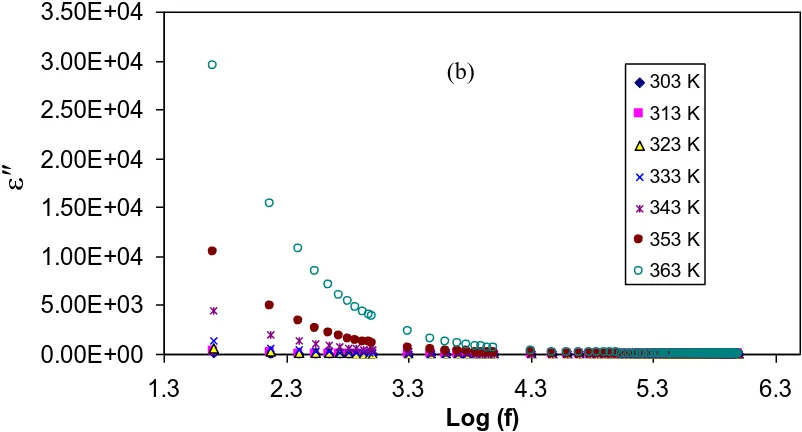
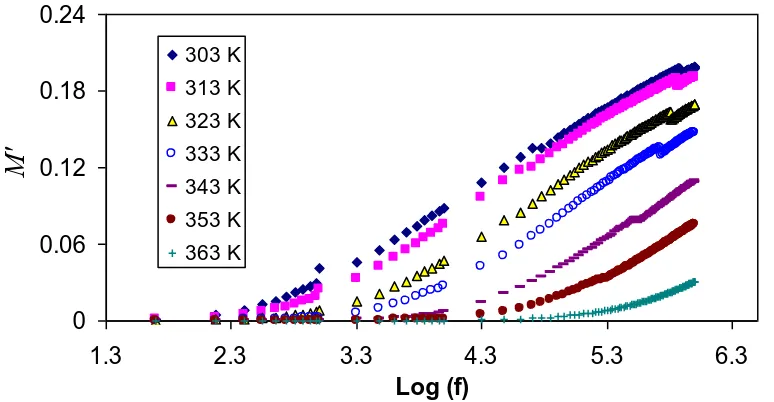
Figure 1.Frequency dependence of, (a) dielectric constant (ε′) and (b) dielectric loss (ε″) for chitosan-NaCF3SO3 (90:10), at selected temperatures. The high value of ε′ and ε″ at low frequencies are
ascribed to electrode polarization phenomena.
Figures 1(a) and (b) show the frequency dependence of dielectric constant and dielectric loss of chitosan-NaCF3SO3 (90:10) at chosen temperatures, respectively. At low frequency region, there is a
long period of time thereby showing electric filed reversal, the mobile ions tend to accumulate at the electrode/electrolyte interface. This provides a higher value of dielectric constant (ε′) and a dielectric loss (ε″). However, at the high frequency region, a fast periodic electric field reversal takes place, with less ionic diffusion in the field direction. Furthermore, due to the charge accumulation, the polarization leads to decrease, and thus a decrease in both the ɛ' and the ɛ'' [39].
It is obvious from Figs. 1(a-b) that the values of both ɛ' and ɛ'' increase at the higher temperatures because of the increase of carrier density. Moreover, the re-dissociation of ion aggregates also occurs at high temperatures and thus an increase in the number of free ions or carrier density [34]. Authors in Ref. [40] have also concluded that the increase in the dielectric constant represented the fractional increase in charge carriers within the polymer electrolyte. The dependency of carrier concentration, n, upon the dissociation energy, U, and dielectric constant, ε, can be illustrated via this relationship, n=no exp(-U/εkBT), where all parameters have usual meaning. The increase of carrier concentration and their motilities with increasing temperature results in an increase in conductivity, which can be more rationalized via the relation, ζ = nqµ, where q is the electronic charge and µ is ionic mobility [41]. An increase in ɛ', therefore, means an increase in carrier concentration and mobility, which in turn caused the conductivity to rise according to the above mentioned equations. Here, from the results, one can conclude that the dielectric analysis is an informative technique to study the conductivity behavior of polymer electrolytes. The observed power law dispersion in ε" spectra [see Fig. 1(b)] and the absence of relaxation peaks indicate the DC contribution [42]. In other words polymer chain motion helps the ion transport behavior.
0.00E+00 5.00E+03 1.00E+04 1.50E+04 2.00E+04 2.50E+04 3.00E+04 3.50E+04
1.3 2.3 3.3 4.3 5.3 6.3
Log (f)
303 K 313 K 323 K 333 K 343 K 353 K 363 K
ε″
3.2 Temperature dependence of ε′ and ε″ at selected frequencies
The variation of ɛ' and ɛ'' parameters versus temperature at selected frequencies are shown in Figs. 2(a-b), respectively. From the result, both dielectric constant and dielectric loss increase with increasing temperature up to 388 K, and then, they decrease with further increasing temperature. Such increase of ε′ and ε″ might be related to the increase of both mobility of polar groups and carrier concentration within the sample, which has been widely observed in polar dielectrics, in which the movement of dipoles is facilitated with temperature ascending [43] and thereby increasing permittivity.
Figure 2.Temperature dependence of, (a) dielectric constant (ε′) and (b) dielectric loss (ε″) for chitosan-NaCF3SO3 (90:10), at selected frequencies. Above 388 K the degradation in ε′ and
ε″can be observed due to water desorption.
0.00E+00 5.00E+03 1.00E+04 1.50E+04 2.00E+04 2.50E+04
295 315 335 355 375 395 415 435
T (K)
0.55 kHz 1 kHz 5 kHz 10 kHz 50 kHz 100 kHz
ε′
(a)
0.00E+00 5.00E+03 1.00E+04 1.50E+04 2.00E+04 2.50E+04 3.00E+04 3.50E+04 4.00E+04
295 315 335 355 375 395 415 435
T (K) 0.55 kHz
1 kHz 5 kHz 10 kHz 50 kHz 100 kHz
ε″
It can be noticed that, the increase of ε″ with increasing temperature is higher compared to ε′. This is due to the contributions of three main factors to the relaxation phenomenon, namely, conduction losses, dipole losses and vibrational losses [44]. At low temperature, dielectric losses are minimal as they depend on both ac resistivity and frequency. It is self-evident that as the temperature increases, the ac conductivity increases and so the conduction losses increase. Similarly, the ɛ' value eventually changes in the same way. The plateau of ɛ' and ɛ'' as a function of temperature can be ascribed to the fast reversal of the electric field at higher frequencies. Above 388 K, both ε′ and ε″ decrease with increasing temperature. It was reported that the remaining water inside polymers have a great effect on polymers physical properties. The most proper binding sites for water molecules in CS are the functional (OH and NH2) groups present in the polymer [45]. Thereby, CS membranes are hydrophilic materials. Authors in Ref. [46] have argued that it is particularly hard to remove the absorbed water in polysaccharides, unless the samples temperature raised to about 361 K. As a consequence, the process of desorption of water at high temperatures led to the diminution of the adhesiveness between the membrane and electrode. On the other hand, at the low temperature, the adhesion could be plausible. However, a further increase in temperature has resulted in damaged of chitosan-based membranes and converting to a hard membrane as a result of water desorption. In this case the interfacial resistance between the membrane and the electrodes increases and thus increases the resistance of the membrane at the elevated temperatures, as a consequence both ε′ and ε″ drop.
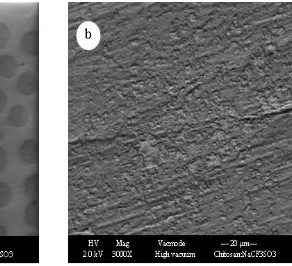
To support the dielectric constant results the SEM was carried out. The surface morphology was obtained using a computer-controlled field emission scanning electron microscope; FESEM, (model: FEI Quanta 200 FESEM). The SEM provides useful insight into the surface structures and morphology. The nature and the morphology of SPE film surface is an important property for polymer electrolyte behavior. Figures 3(a) and (b) show FESEM images of CS:NaTf (90:10) before and after the EIS measurement, respectively. Morphologically, the membrane before EIS treatment has appeared as a uniform surface with several holes on its surface. According to Reddy et al. [47] conclusions, these holes with different sizes can be ascribed to the penetration of Na+ ions into the polymer matrix, which deforms the crystallinity and increases the flexibility. Thus, both dielectric properties and conductivity are caused to increase. In our previous works, we observed the disruption of crystallinity of CS upon addition of low and high NaTf salt concentrations [48, 49].
During heat treatment, the color of the membrane has changed to a dark brownish, resulting in hard and shrunk, owing to the water desorption process and almost brittle compared with the original membrane after EIS treatment. The surface morphology of the film was entirely roughened by heat treatment compared to the original membrane after EIS measurement as shown in Fig. 3(b). Therefore, understanding the thermal degradation of polymeric materials for device application is an imperative point from both fundamental and large-scale point of views.
3.3 Frequency dependence of loss tangent (tanδ)
To gain deep understanding of the relaxation processes, tanδ as a function of frequency at various temperature values was plotted for the CS:NaTf (90:10) membrane as shown in Fig. 4. At low frequencies, the polarization is in-phase with the electric field, therefore, the phase shift (or loss angle) is established to be extremely small. On the other hand, at superior frequencies, the polarization delays behind the electric field. The closeness of the relaxation time of the polarization and the period of the applied field, a resonance condition is obtained at which the loss tangent (tanδ) is maximum [50]. According to Jiang et al. [51], an observed increase in loss tangent with increasing applied field frequency is dominated by resistive losses since the mobile charges contained in the electrolyte film cannot follow higher frequency electric field. It can also be observed from Fig. 4 that tanδ increases with frequency, which passes through a maximum value and thereafter decreases. Shifting of the peak frequencies in the forward direction with temperature implies that as the temperature increases the relaxation time decreases. This manner recommend the fact that the sample can be characterized by a parallel RC element, where R is related to the temperature via this equation, R=Roexp(Ea/KBT), where
Ea is the activation energy. From this relation it is clear that R will decrease with increase in temperature and consequently the (tanδ)max shifts to the higher frequency region [52]. The wideness of
Figure 4.frequency dependence of loss tangent (tanδ) for CS:NaTf (90:10) membrane at selected temperatures. Shifting of peaks to higher frequency indicates the increase of conductivity.
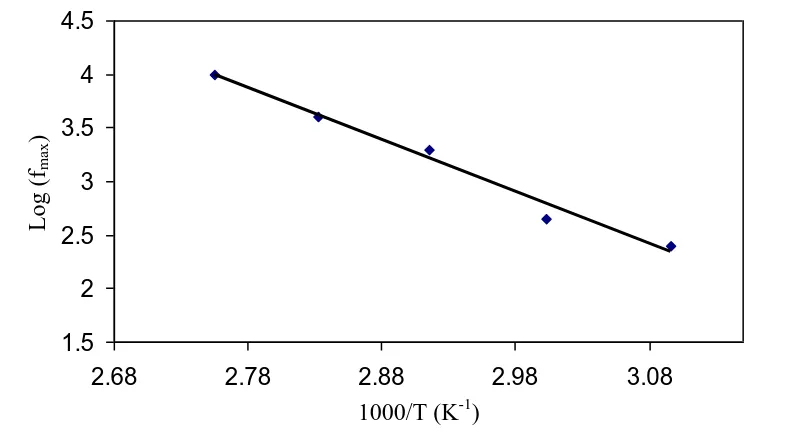
Figure 5. Temperature dependence of relaxation frequency.
The frequency related with each peak is recognized as relaxation frequency and provides the most possible relaxation time for ions from the relation 2πfmax=1/η, were η is the relaxation time and fmax is a frequency corresponding to (tanδ)max . The reciprocal temperature variation of log (fmax) is
shown in the Fig.5. The frequency-temperature relationship satisfies the Arrhenius behavior with the activation energy, Ea= 0.966 eV. The regression value R2 is 0.983 indicating that every point almost lies on a straight line.
0 0.6 1.2 1.8 2.4 3 3.6 4.2 4.8
1.3 2.3 3.3 4.3 5.3 6.3
Log (f)
303 K 313 K 323 K 333 K 343 K 353 k 363 K
Ta
nδ
1.5 2 2.5 3 3.5 4 4.5
2.68 2.78 2.88 2.98 3.08
1000/T (K-1)
Log (f
m
ax
[image:9.596.105.498.330.547.2]3.4 Temperature dependence of tanδ at selected frequencies
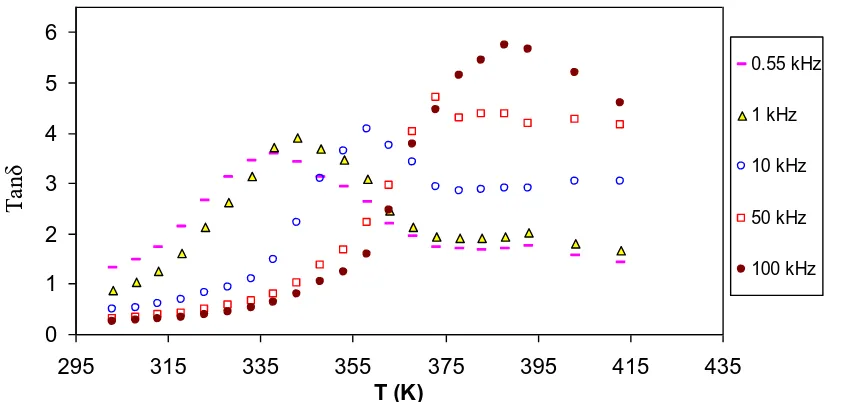
The variation of tanδ value with temperature at selected frequencies is shown in Fig. 6. It is interesting to note that tanδ value raised with increasing temperature and shows a peak. The shifting of peaks towards the high temperature sides is an evidence for the process of dielectric relaxation. The observed relaxation peaks at low values of temperature and frequency in tanδ curves indicate the possibility of dipole polarization [54]. The increase of tanδ of the present polymer electrolyte corresponds to the conduction losses. The tanδ is related to the electrical conductivity via this relation, tanδ= ζ/2πfε′, [55]. These losses are connected to dc conductivity of the sample in which the conductivity gives rise to currents which being in ac field are in phase with the applied voltage and hence cause dielectric losses. At ambient temperature, such conduction losses are fewer correlated to the ion migration losses. Therefore, the conduction losses become increasingly important at elevated temperatures and at low frequencies as manifested in Fig. 6. Thus, the increase of Tanδ loss with temperature can be attributed to increase in conduction and dipole losses, giving a broad peak at low temperatures. However, the high peak appearance around 388 K is almost associated to the water desorption process as mentioned formerly.
Figure 6.temperature dependence of loss tangent (tanδ) for CS:NaTf (90:10) membrane at selected frequencies.
3.5 Electric modulus analysis
A more study of the dielectric performance could be more fruitfully attained using electrical modulus formalism. The convenience of modulus demonstration is to smother the signal intensity linked with electrode polarization or to highlight minute features at high frequency region [56]. Consequently, the electric modulus curves offer an chance to examine the conductivity and its related relaxation in both ionic conductors and polymers [57]. Figure 7 illustrates the frequency dependence of M′ of complex modulus (M*) at different temperature values. Clearly, the M′ value shows moderately a
0 1 2 3 4 5 6
295 315 335 355 375 395 415 435
T (K)
0.55 kHz
1 kHz
10 kHz
50 kHz
100 kHz
[image:10.596.91.513.362.563.2]minute value in the low frequency region, while a large value ends at the high frequency. As the frequency increases, the value of M′ increases and reaches a maximum value of M∞ = 1/ε∞ at the high
frequency region. This can perhaps be interrelated to a lack of restoring force governing the mobility of charge carriers under the action of an induced electric field [58]. Additionally, M′ attains a greatest value as a consequence of the conduction phenomenon due to short-range mobility of ion carriers [59]. It can be seeing that M′ diminish with increase in the temperature; this is reverse to that of permittivity. The fall in the values of M′ (increase in ε′) with temperature increasing in the low frequency region is connected to the increase in the mobility of the polymer segment and charge carriers. The orientation of polymer segments and ionic carriers happen to easier at the high temperature values, as a consequence, an increase of the permittivity resulted and thus a decrease in M' value expected [60].
Figure 7. Frequency dependence of real part (M′) of M* for chitosan-NaCF3SO3 (90:10), at selected
temperatures
The variation of M'' values with frequency at various temperatures for CS:NaTf (90:10) system is shown in Fig. 8. Representation of the experimental data using the M'' formalism allows the observation of conductivity as an obvious peak on frequency axis, which is helpful for analysis purposes. A low value of M'' is show at low frequency region, which might be due to the great value of capacitance formation at the electrode [61]. However, at the high frequency region, the distinct peaks are distinguished. It is obvious in the M″ plot that the peaks are asymmetric on both sides of the maxima and thus it cannot be predicted by ideal Debye manner [62, 63]. The frequency associated with each peak is seen to be shifted towards higher values of frequency as the temperature rises. This implies that the spreading in frequency range enlarged with temperature. The frequency area underneath maximum peak of M''max terminates the range in which ion carriers are transportable over
long distances, that is, diffusion occurs, and thus a high value of electrode polarization, while the carriers are limited to potential wells being mobile over short distance at the frequency values above maximum peak M''max [64].
0 0.06 0.12 0.18 0.24
1.3 2.3 3.3 4.3 5.3 6.3
Log (f) 303 K
313 K
323 K
333 K 343 K
353 K
363 K
[image:11.596.103.490.281.482.2]Figure 8. Frequency dependence imaginary part M'' of M* for chitosan-NaCF3SO3 (90:10), at selected
temperatures
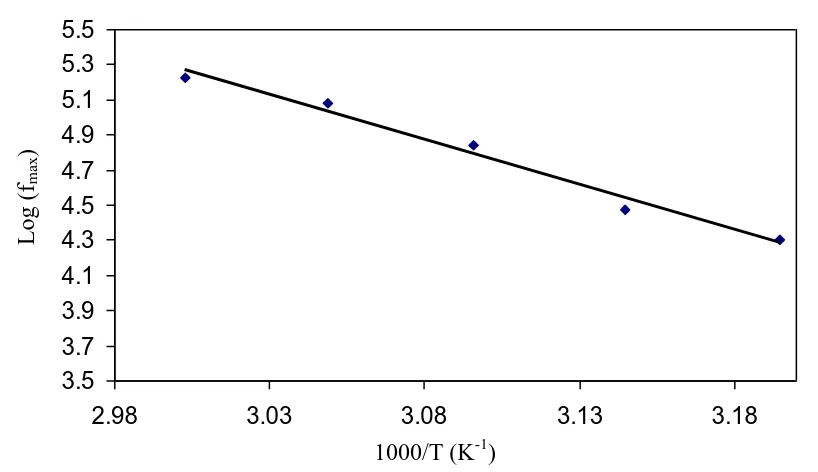
Figure 9. Temperature dependence of relaxation frequency.
The frequency coupled with each peak is identified as relaxation frequency and it gives the mainly possible conductivity relaxation time (ηζ). The conductivity relaxation time ηζ can be viewed as
the time needed for the ions to move from one site to another during the conduction process [65]. Changing of the peak frequencies in the frontward trend with temperature indicates that as the temperature increases the relaxation time decreases. This is due to the increased mobility of ionic charge carriers and segmental motion. Figure 9 shows the temperature dependence of the peak
0 0.006 0.012 0.018 0.024 0.03 0.036 0.042 0.048 0.054
1.3 2.3 3.3 4.3 5.3 6.3
Log (f)
303 K 313 K 323 K 333 K 343 K 353 K 363 K
M″
3.5 3.7 3.9 4.1 4.3 4.5 4.7 4.9 5.1 5.3 5.5
2.98 3.03 3.08 3.13 3.18
Log (f
m
ax
)
[image:12.596.95.504.376.612.2]frequency for CS:NaTf (90:10) systems. It can also be seen that the fmax exhibits an activated behavior
and obeying the Arrhenius relationship (fmax = foexp (-Eζ/KT); where Eζis the activation energy for the conductivity relaxation and is equal to 1.02 eV, which is in harmony with the activation energy calculated from tanδ maximum peak. This implies that the ion transport process assists through the polymer segmental motion. The regression value R2 is 0.989 representing that all points be positioned on approximately perfect straight line.
4. CONCLUSIONS
The dielectric properties and conductivity relaxation of solid polymer electrolyte based on chitosan-NaCF3SO3 was studied to understand the carrier transport properties. The appropriate
technique for the characterization of such kind of polymer is electrochemical impedance spectroscopy (EIS). In this study, the electrode polarization process which was observed at low frequency region results in the high value of both dielectric constant and dielectric loss. The temperature increasing up to 388 K, exhibited an increase in both the dielectric constant and the dielectric loss, owing to a fractional increase in the number of charge carrier density and their decreases above 388 K due to the water desorption process. The morphological study reveals that the sample is damaged and it changed to a hard membrane as a result of water desorption. The capacitive behavior of the synthesized materials can be noticed on the appearance of tails in the real part of electric modulus spectra. The asymmetric peak of the imaginary part of electric modulus M", predicts the non Debye type relaxation. One can see an indication of distribution of relaxation time from the broadness of loss tangent peaks. The calculated activation energy from the peak frequency of tanδmax and M″max point out that ion hopping assists through polymer segmental motion, that is, the mechanism of charge transferring obeys the viscoelastic relaxation process.
ACKNOWLEDGEMENT
The author gratefully acknowledge the financial support for this study from Ministry of Higher Education and Scientific Research-Kurdistan Regional Government, Department of Physics, College of Science, University of Sulaimani, Sulaimani, and Komar Research Center (KRC), Komar University of Science and Technology, Sulaimani, 46001, Kurdistan Regional Government, Iraq. The author appreciatively acknowledge the financial support from the Kurdistan National Research Council (KNRC)- Ministry of Higher Education and Scientific Research-KRG for this research project.
References
1. S. W. de Leeuw, A. Van Zon and G. J. Bel, Electrochim. Acta, 46 (2001) 1419 2. S. B. Aziz, Z. H. Z Abidin and A. K. Arof, Physica B, 405 (2010) 4429 3. S. Zhou and S. Fang, Eur. Polym. J., 43 (2007) 3695
7. W. Pasanphan, P. Rimdusit, S. Choofong, T. Piroonpan and S. Nilsuwankosit, Radiat. Phys. Chem., 79 (2010) 1095
8. S. B. Aziz, O. Gh. Abdullah and M. A. Rasheed, J. Appl. Polym. Sci., 134 (2017) 44847 9. C.K.S. Pillai, Willi Paul and C. P. Sharma, Prog. Polym. Sci.,34 (2009) 641
10.G. Lu, L. Kong, B. Sheng, G. Wang, Y. Gong and X. Zhang, Eur. Polym. J., 43 (2007) 3807 11.Q. Z. Huang, L. H. Zhuo, and Y. C. Guo, Carbohydr. Polym., 72 (2008) 500
12.J. P. Guerrero, I.-C. Huang, H.-B. Jansson, J. Salinas, L. V. Liorca, and N. D. Read, Fungal Genet. Biol., 46 (2009) 585
13.Q. Gan and T. wang, Colloids Surf., B, 59 (2007) 24
14.M. Darder, M. Colilla and E. Ruiz-Hitzky, Appl. Clay Sci., 28 (2005) 199
15.M. Cheng, J. Deng, F. Yang, Y. Gong, N. Zhao and X. Zhang, Biomater., 24 (2003) 2871 16.D. A. Musale, A. Kumar and G. Pleizier, J. Membr. Sci., 154 (1999) 163
17.L. S. Ng, and A. A. Mohamad, J. Power Sources, 163 (2006) 382
18.S. B. Aziz, W. O. Karim, K. W. Qadir and Q. Zafar, Int. J. Electrochem. Sci.,13 (2018) 6112 19.S. B. Aziz, M.F. Z. Kadir and Z. H. Z. Abidin, Int. J. Electrochem. Sci., 11(2016) 9228
20.S. B. Aziz, O. Gh. Abdullah, S. R. Saeed and H. M. Ahmed, Int. J. Electrochem. Sci.,13 (2018) 3812
21.M. F. Z. Kadir, S. R. Majid and A. K. Arof, Electrochem. Acta, 55 (2009) 1475
22.Y. A. K. Salman, O. Gh. Abdullah, R. R. Hanna and S. B. Aziz, Int. J. Electrochem. Sci.,13 (2018) 3185
23.S. B. Aziz, O.G. Abdullah and S. A. Hussein, J. Electron. Mater., 47 (2018) 3800
24.S. B. Aziz, T. J. Woo, M. F. Z. Kadir and H. M. Ahmed, J. Sci.: Adv. Mater. Devices, 3 (2018) 1 25.S. B. Aziz and Z. H. Z. Abidin, J. Appl. Polym. Sci., 132 (2015) 41774
26.S. B. Aziz, Adv. Mater. Sci. Eng., 2016 (2016), Article ID 2527013, 11 pages 27.S. B. Aziz, Iran. Polym. J., 22 (2013) 877
28.S. B. Aziz, Z. H Z. Abidin, Mater. Chem. Phys., 144 (2014) 280
29.S.B. Aziz, R.M. Abdullah, M.A. Rasheed and H.M. Ahmed, Polymers, 9 (2017) 338
30.D. K. Pradhan, R. N. P. Choudhary, and B. K. Samantaray, Int. J. Electrochem. Sci. 3 (2008) 597 31.Ch. V. S. Reddy, A.-P. Jin, Q.-Y. Zhu, L.-Q. Mai and W. Chen, Eur. Phys. J. E, 19 (2006) 471 32.P. P. Suvarna, K. R. Rao and K. Subbarangaiah, Bull. Mater. Sci., 25 (2002) 647
33.K. P Padmasree. and D. K. Kanchan, Mater. Sci. Eng., B 122 (2005) 24 34.M. S. Kumar, and D. K. Bhat, Physica B 404 (2009) 1143
35.S.B. Aziz, O.G. Abdullah and M.A. Rasheed, J. Mater. Sci: Mater. Electron., 28 (2017) 12873 36.S. B. Aziz, J. Inorg. Organomet. Polym., 28 (2018)1942
37.M. Okutan and E. Şentürk, J. Non-Cryst. Solids, 357 (2008) 1526
38.Kh. M. Batoo, Sh. Kumar, Ch. G. Lee, and Alimuddin, Curr. Appl Phys., (2009), 1397 39.Ch. V. S. Reddy, X. Han, Q. Zhu, L. Mai and W. Chen, Microelectron. Eng., 83 (2005) 281 40.C. S. Ramya, S. Selvasekarapandian, G. Hirankumar, T. Savitha, and P. C. Angelo, J. Non-Cryst.
Solids 354 (2008) 1494
41.N. K. Idris, N. A. N. Aziz, M. S. M. Zambri, N. A. Zakaria and M. I. N. Isa, Ionics 15 (2009) 643 42.[42. D. k. Pradhan, R. N. P. Choudhary, and B. K. Samantaray, eXPRESS Polym. Lett., 2 (2008)
630
43.E. Sheha, Solid State Ionics 180 (2009) 1575
44.J. Borah, S. S. Mahapatra, D. Saikia and N. Karak, Polym. Degrad. Stab., 91 (2006) 2911 45.C. G. T. Neto, J. A. Giacometti, A. E. Job, F. C. Ferreira, J. L. C. Fonseca, and M. R. Pereira,
Carbohydr. Polym., 62 (2005) 97
46.L. S. Ng, and A. A. Mohamad, J. Membr. Sci., 325 (2008) 653
47.Ch. V. S. Reddy, X. Han, Q.-Y. Zhu, L.-Q. Mai and W. Chen, Eur. Polym. J., 42 (2006) 3114 48.S. B. Aziz, Z. H Z. Abidin, J. Soft Matt., 2013 (2013), Article ID 323868, 8 pages
50.Xi. Yu, B. Yi, F. Liu and X. wang, React. Funct. Polym., 68 (2008) 1557
51.H. Jiang, L. Hong, N. Vaenkatasubramanian, J. T. Grant, K. Eyink, K. Wiacek, S. Fries-Carr, J. Enlow and T. J. Bunning, Thin Solid Films 515 (2007) 3513
52.R. Baskaran, S. Selvasekarapandian, G. Hirankumar and M. S. Bhuvaneswari, Ionics 10 (2004) 129
53.N. H. Idris, H. B. and Senin, and A. K. Arof, Ionics, 13 (2007) 213
54.K. Prabakar, Sa.K. Narayandass and D. Mangaralaj, Mater. Sci. Eng., B 98 (2003) 225 55.M. M. Elkholy, and L. M. Sharaf El-Deen, Mater. Chem. Phys., 65 (2000) 192
56.S. B. Aziz, Appl. Phys. A, 122 (2016) 706
57.S.B. Aziz, Z.H.Z. Abidin, A.K. Arof, Express Polym. Lett., 4 (2010) 300 58.S. B. Aziz, Bull. Mater. Sci., 38 (2015) 1597
59.M. Ram, and S. Chakrabarti, J. Alloys Compd., 462 (2008) 214
60.M. Arous, I. B. Amor, A. Kallel, Z. Fakhfakh, and G. Perrier, J. Phys. Chem. Solids, 68 (2007) 1405
61.S. B. Aziz, M. A. Rasheed, and Z. H. Z. Abidin, J. Electron. Mater., 46 (2017) 6119 62.S. B. Aziz, O.Gh. Abdullah, S A. Hussein andHameed M. Ahmed, Polymers 9 (2017) 622;
doi:10.3390/polym9110622
63.S. B. Aziz and R. M. Abdullah, Electrochim. Acta, 285 (2018) 30 64.A. Dutta, Ch. Bhari, and T. P. Shinha, Mater. Res. Bull., 43 (2008) 1246