Lifetime Spectroscopy for Defect
Characterization in Silicon
Bijay a Babu Paudyal
Centre for Sustainable Energy Systems
College of Engineering and Computer Science
Australian National University
Canberra, Australia
THE AUSTRALIAN NATIONAL UNIVERSITY
A thesis submitted for the degree of Doctor of Philosophy
of The Australian National University
I certify that this thesis does not contain any material previously written or published by any other person except where due reference is made. The work in this thesis is my own, except for the contribution made by others as described in Acknowledgements. Part of this work has been already published in four journal articles and three conference proceedings as listed below.
Bijaya Paudyal
1. The implementation o f temperature control to an inductive-coil photoconductance instrument fo r the range o f 0-230°C, B. B. Paudyal, K. R. McIntosh, D. H. Macdonald, B. S. Richards, and R. A. Sinton, Progress in PV: Res. and Application. 16, 609-613 (2008)
2. Electron capture cross section o f iron-boron pairs in crystalline silicon over the temperature range 0 - 100 °C, B. B. Paudyal, K. R. McIntosh, and D. H. Macdonald, in 23rd EU PVSEC, Valencia, Spain, p. 1481, September 2008 3. Generalized procedure to determine the dependence o f steady-state
photoconductance lifetime on the occupation o f multiple defects, K. R. McIntosh, B. B. Paudyal, and D. H. Macdonald, Journal of Applied Physics 104, 084503 (2008)
4. Erratum: Generalized procedure to determine the dependence o f steady-state photoconductance lifetime on the occupation o f multiple defects [J. Appl. Phys. 104, 084503 (2008)], K. R. McIntosh, B. B. Paudyal, and D. H. Macdonald, Journal of Applied Physics 106, 029901 (2009)
5. Temperature dependent carrier lifetime studies on Ti-doped multicrystalline silicon, B. B. Paudyal, K. R. McIntosh, and D. H. Macdonald, Journal of Applied Physics, 105, 124510 (2009)
6. Temperature Dependent Electron and Hole Capture Cross Sections o f Iron- contaminated Boron-doped Silicon, B. B. Paudyal, K. R. McIntosh and D. H. Macdonald, 34th IEEE PV specialist conference, Philadelphia, USA, p. 001588, June 2009
7. Temperature dependent electron and hole capture cross sections o f the molybdenum defect in Silicon, B. B. Paudyal, K. R. McIntosh, D. H. Macdonald and G. Coletti, Proc. 24th EU PVSEC, Hamburg, Germany, p. 981, September 2009
This thesis presents a new procedure for the simplification of a carrier lifetime equation to determine the electrical properties of the defects and their temperature dependencies in silicon. The development process of a temperature controlled lifetime measuring instrument and determination of electrical properties of some of the most common metal impurities in silicon are also presented.
Lifetime spectroscopy (LS) is a measurement and analysis technique for defect characterization in semiconductors. LS applies different approaches and conditions to extract some of the defect specific parameters by making one or more other parameters negligible, irrelevant or constant. A new approach in lifetime spectroscopy is proposed for the explicit determination of electrons and holes capture time constants (r„o and ^,0) at different temperatures, which are used to determine electron and hole capture cross sections an and ap). These temperature dependent values of crn and op allow the assessment of the effective carrier capture mechanism of the defect and its energy level
( E t) .
An inductive coil photoconductance (PC) based carrier lifetime measurement system is found suitable for this work because of its contactless nature and simple operational procedure. Implementation of a temperature control system in a commercially available inductive coil PC based lifetime measurement instrument (WCT-100 from Sinton consulting Inc.) is performed. Calibration and traceability measurements of the developed instrument ensured its operation for the temperature range -150 to 320 °C with ± 6.5% maximum error in measured lifetime.
I would like to thank my supervisor, Dr. Keith McIntosh for his guidance, encouragement, transferring enthusiasm for research, availability for discussion all the time and correcting my writings to give them a better scientific shape. I am equally grateful to my cosupervisor Dr. Daniel Macdonald for his valuable suggestions and guidance during this work. I am thankful to Dr. Bryce Richards, my cosupervisor for his design work in implementing a temperature controlled system in an inductive coil photoconductance measurement system. I am also grateful to Dr. Klaus Weber for being a part of my supervisory panel.
I would like to thank Dr. Ron Sinton, from Sinton Instrument Inc., and Dr. Henry Zou, from Instec Inc., for their valuable suggestions during the development and commissioning phase of the instrument used throughout this work. I am also thankful to the laboratory staff of CSES, Mr. Bruce Condon for his assistance in fixing the electronics problems of the instrument, Mr. James Cotsell for setting up the instrument and making it operable and Mr. Neil Kaines for his guidance in the laboratory and providing tools as required. I am equally grateful to Ms Nina de Caritat for her instruction in operating the dicing saw and cell processing. I am also grateful to Mr. Ben Nash of the mechanical laboratory for his help in finding a thermally stable material suitable for coil housing.
I am thankful to Dr. Bart Greeligs and Dr. Gianluca Coletti from Energy research Centre, Netherlands (ECN), for providing me with the samples for study. I am equally thankful to Dr. Jan Schmidt for his help in finding an error in the photoconductance analysis. I am also thankful to Dr. Dan Dickey of Solecon Laboratories Inc. for his help in performing the conductivity measurements of the calibration wafers.
I am grateful to Dr. Anthony Flynn, of the engineering department at ANU, for editing this thesis and helping me to understand the usage of the English language.
I would like to express my thanks to all of the staff of the Centre for Sustainable Energy System (CSES) and College of Engineering for their help in administrative matters. I am also thankful to the Australian Research Council Linkage Grant between the Australian National University, SierraTherm Production Furnaces, and SunPower Corporation for providing me with conference and scholarship funding.
1.1. Background and motivation... 1
1.2. Thesis outline... 5
References... 6
2. C arrier lifetime and lifetime spectroscopy...9
2.1 Carrier recombination and lifetime in semiconductors... 9
2.1.1 Generation and recombination in semiconductors...9
2.1.2 Effective and multiple lifetim es... 11
2.1.3 Radiative recombination...13
2.1.4 Auger recombination... 14
2.1.5 Shockley-Read-Hall recombination...15
2.2. Derivation of the SRH equation and its assumptions...16
2.2.1 The SRH equation...16
2.2.2 Assumptions for the SRH equation... 19
2.3 Parameters of the SRH equation... 21
2.3.1 Capture time constant for electrons and holes (r„o and Tpo)... 22
a. Carrier capture cross sections (<r„ and ap)...22
b. Thermal velocity of electrons and holes (v^w and v thp)...26
c. Defect concentration (N ,)...27
2.3.2 Equilibrium carrier concentration (no andpo) ... 28
a. Intrinsic carrier concentration («,)... 29
b. Effective density of states (Nc and Ny)...30
2.3.3 SRH carrier concentrations {n\ andp \ )...33
2.3.4 Other parameters of the SRH equation...34
2.4 Lifetime Spectroscopy...35
2.4.2 Evolution of Lifetime Spectroscopy... 36
2.4.3 Preliminary simplification of SRH equation...37
2.4.4 Injection dependent lifetime spectroscopy...38
2.4.5 Temperature dependent lifetime spectroscopy... 43
2.4.6 Temperature and injection dependent lifetime spectroscopy...47
2.5.2 E, in lower band gap half... 50
2.5.3 E, in upper band gap h a lf ... 53
2.6 Chapter sum m ary... 56
References... 57
3. Lifetime measurement and instrument development... 61
3.1 Measurement techniques... 61
3.1.1 General principle... 62
3.1.2 Micro-wave photoconductance... 64
3.1.3 Inductive-coil photoconductance... 66
3.1.4 Photoluminescence...68
3.1.5 Suitable measurement techniques... 70
3.2 Instrument development...70
3.2.1 Description of existing systems... 71
a. PC measurement instrument (WCT-100)... 71
b. Heating and cooling stage (HCS-302)...72
3.2.2 Modifications to existing systems and their effects... 74
3.2.3 The complete system and its operating regime...75
3.2.4 Temperature deviation and thermal calibration...77
3.3 Calibration and measurement... 80
3.3.1 Lifetime measurement of an inductive-coil PC system... 81
3.3.2 Temperature and carrier-density-dependent m obilities... 85
3.3.3 Calibration of the inductive-coil PC measurement instrument... 89
3.4 Uncertainties on measurement... 96
3.5 Chapter summary... 98
References...99
4. Molybdenum in silicon... 101
4.1 Mo defects in silicon... 102
4.2 Sample details and methodology... 103
4.3 Capture cross sections of Mo in silicon... 107
4.4 Assessing E, of Mo in silicon... 110
4.6 Chapter summary... I l l
References... 111
5. Iron and iron-boron pairs in silicon...113
5.1 Iron and its defects in silicon... 113
5.2 Sample details and methodology... 115
5.3 Capture cross sections of Fej... 121
5.4 Capture cross sections of FeB... 123
5.5 Chapter summary... 125
References... 126
6. Titanium in silicon... 129
6.1 Titanium and its defects in silicon... 130
6.2 Sample details and methodology... 131
6.3 Active Ti-defect level and its concentration... 134
6.4 an(T) of Tij++ defect in silicon... 137
6.5 Segregation coefficient of Ti in silicon...140
6.6 Chapter summary... 141
References...142
7. C onclusions...145
Appendix A. Parameters of solar cells for PC ID simulation... 149
B. Simplification of the SRH equation for «-type silicon...151
C. Simplification of the SRH equation for «-type silicon for the new TIDLS procedure... 154
1.1 Solar cell efficiency versus impurity concentration for 4 Q cm boron- 1 doped silicon solar cells
1.2 Solar cell efficiency versus impurity concentration for 1.5 £2 cm 2 phosphorous-doped silicon solar cells
1.3 Silicon solar cell efficiency versus minority carrier lifetime 3 2.1 Pictorial representation of (a) band to band or intrinsic generation and 10
recombination in silicon, (b) defect assisted generation and recombination in silicon
2.2 Effective lifetime composed of SRH, radiative and Auger terms. 12 Lifetimes are calculated for a typical solar cell at 300 K, doping density,
1 x 1015 cm'3 (boron) and impurity density, 5 x 1011 cm'3 (titanium)
2.3 (a) State before carrier transaction (b) state after carrier transaction 15 2.4 Temperature dependencies of different capture mechanisms 22 2.5 Temperature dependence of thermal velocity of electrons vth„(T) and 26
holes vthp{T)
2.6 Temperature dependence of the majority carrier concentration po(T) of p- 29 type silicon for different doping densities NA
2.7 Temperature dependence of intrinsic carrier concentration «,(7) 30 2.8 Temperature dependence of state densities Nc(T) and Ny{T) 31 2.9 Temperature dependence of the effective mass of electrons m*„(T) and 32
holes m*p(T) in silicon
2.10 Temperature dependence of the energy band gap Eg(T) in silicon 33 2.11 Temperature dependence of SRH carrier densities, n\{T) and p\{T) for an 34
interstitial iron (Fej) defect in silicon
2.12 Carrier concentrations (po, P i, «0, and «,•) for different E, and 35 temperatures in 1.0H cm, p-type silicon
2.13 IDLS analysis of 1 O cm boron-doped silicon 39
2.14 The effect of MCT trapping in the lifetime at LLI 40
2.16 Arrhenius plots for TIDLS analysis depicting onset temperature (Tomet) 46 2.17 Measured lifetime data and temperature dependence of crp x N, of the 47
deep-level centre in Al-doped CZ-Si as determined from TIDLS analysis 2.18 Temperature dependence of capture cross section ratios for most 49
common types of impurities in silicon
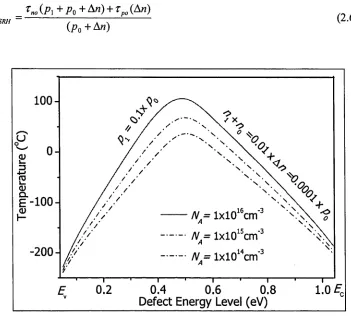
2.19 Temperature below which n\ + «o = 0.01 x A« = 0.0001 x po, and 51 pi = 0.01 x po as a function of E, for p-type silicon of three doping
densities (NA)
2.20 TIDLS analysis on a 1 Q cm p-type wafer with Et - E y = 0.28 eV. (a) 52 Depicts lifetime times doping density at different temperatures (b) depicts plot for selective injection range suitable for the determination of
Tno(T) and r^(T)
2.21 Temperatures below which pi +po = 0.01 * An = 0.0001 x «0> and 53
«1 = 0.01 x n0 as a function of Et for p-type silicon of three doping
densities (NA)
2.22 Temperatures below which p\ + An = 0.01 x p 0 and «o +A« = 0.01 x p 0 54 as a function of E, for p-type silicon of three doping densities (NA)
2.23 Temperatures below which pi +po = 0.01 x An = 0.0001 * n0 as a 55 function of E, for «-type silicon of three doping densities (ND)
3.1 Apparatus for a microwave lifetime measurement system 64 3.2 Optical method for a microwave lifetime measurement system 65
3.3 Inductive-coil photoconductance measurement system 66
3.4 T-controlled photoluminescence measurement system 69
3.5 Schematic view of WCT-100, depicting external interfaces balancing 72 resistor and capacitor, test wafers and data acquisition to the oscilloscope
3.6 Pictorial view of HCS-302 73
3.7 Schematic view of the HCS-302 with raised coil of the WCT-100 74 3.8 T-controlled inductive coil PC based lifetime measurement system 76 3.9 Positioning of test wafer with thermocouple sensors in HCS-302 77
3.10 Correlation between wafer and stage temperatures 78
3.11 Temperature deviation within the wafer for -120, 30 and 200 °C stage 79 temperatures (7s)
3.13 Signal flow diagram in inductive-coil PC measurement instrument with 83 calibration bypass
3.14 Electron mobility for 1 Q cm boron-doped silicon 87
3.15 Hole mobility for 1 Q cm boron-doped silicon 87
3.16 Correlation between A« and Acrfor different temperatures. A a is 89 calculated by using Equations (3.14) and (3.15)
3.17 Correlation of crwith NA forp-type wafers at 300, 400, 500 and 600 K 90 3.18 Correlation of <7with ND for «-type wafers at 300, 400, 500 and 600 K 91 3.19 Conductivity of p-type silicon due to the majority carriers and both 91
carriers for different temperatures, depicting how the minority carriers dominate overall conductivity at higher temperatures (> Tmax)
3.20 Conductivity of «-type silicon due to the majority carrier and both 92 carriers for different temperatures, depicting how the minority carrier dominates overall conductivity at higher temperatures (> Tmax)
3.21 Correlation of wafer sheet conductivity (asq) to Vow for (a) 30 °C, (b) at 95 different temperatures
3.22 Slope of the plot V o w^s<Jsq for different temperatures 96
4.1 A band diagram of silicon depicting the defect energy level of Mo 102 4.2 Carrier densities (n\,p\, «o andpo) for E, = Ey + 0.28 eV for Mo defect 104 4.3 (a) Injection-dependent lifetime of Mo-contaminated and control wafers 105
at room temperature, (b) Injectiondependent lifetime for temperatures -110 to 150 °C in intervals of 20 °C
4.4 Lifetime plot and linear fit of Mo-doped (1.8 Ohm cm) wafer for the 106 selected injection range (1 * 1014 - 2. x 1014 cm'3)
4.5 Measured re^ a t A« = 1 x 10'14cm'3, slope of the plot (r^ V s An over the 107 range 1 - 2.5 x lO 14 cm'3), calculated zpo and op as a function of temperature (T)
4.6 Electron capture cross section for Mo in silicon fitted with excitonic 109 Auger capture mechanism and other previously published values at RT
4.7 Capture cross section ratio of Mo defects in silicon at different 111 temperatures
5.1 Energy level ranges of Fe-related defects in silicon depicting Et( F e f /0), 114
5.2 Arrhenius plot of 1.0 Q cm depicting the complete thermal dissociation 117 temperature ( Tqtd) for FeB pairs at 235 °C and the effect of Fe; and FeB
in silicon
5.3 Effective lifetime measured for a 1.0 Q cm sample at 50 °C, depicting the 118 differences in recombination lifetime of an Fe-contaminated wafer with control wafer and cross-over point
5.4 Linear plot of Ancop versus po depicting slope and intercepts as a 119 function of crn(FeB) and <7p(FeB)
5.5 Effective lifetime measured after light soaking for 2 minutes on 0.6 and 120 1.0 FI cm, B-doped, Fe-contaminated wafers with different light intensities
5.6 Measured slope of the plot Teff vs An (a), calculated tpq(T) (b) and 121 calculated crp(T) with previously reported model (c) of Fej defects in silicon for the temperature range 240 to 310 °C
5.7 Measured intercepts of the plot %• vs An (a), calculated t„o(T) (b) and 122 calculated <r„(7) with previously reported models (c) of Fej defects in silicon for the temperature range 240 to 310 °C
5.8 (a) Measured intercepts (b) calculated <JP(T) of FeB pairs for 0 - 9 0 °C 124 with multi-phonon emission capture model fit
5.9 Electron capture cross-section of FeB pairs for 0 - 90 °C, measured data 125 and excitonic Auger capture model fit
6.1 Energy level ranges of Ti-related defects in silicon depicting Et(Ti[), 130 £,(77,+) and E m ” )
6.2 Injection-dependent lifetime of a Ti-contaminated wafer and a control 133 wafer
6.3 Lifetime of Ti-defect wafer versus («, + A n )/(p 0 + A«)for the donor 134 level defect at 200 °C
6.4 Measured lifetime data (Ti wafer at 180 °C) depicting linearity with the 135 fitted model for LLI [An « /?o(T)]
6.5 Measured carrier lifetime data showing consistency of Ti wafer with 136 fitted model for different temperatures
ra n g e 145 to 2 7 0 °C
6.7 M e a s u re d in te rc e p ts (a) a n d c a lc u la te d (Jn{ T ) fo r 77+ ‘ d e fe c t in s ilic o n fitte d w ith m u lti-p h o n o n e m is s io n c a p tu re (M P E ) (b )
138
6.8 T e m p e ra tu re d e p e n d e n c e o f c a rrie r c a p tu re c ro s s s e c tio n ra tio fo r a
d o u b le d o n o r le v e l o f T i in s ilic o n
139
6.9 T i c o n c e n tra tio n fo r d iffe re n t p o s itio n s w ith in th e in g o t p lo tte d w ith
S c h e il e q u a tio n w ith d iffe re n t k ef f
141
B .l M in im u m te m p e ra tu re re q u ire d fo r p \ { T ) o r n \ ( T ) » 0 .0 0 0 1 x p o ( T ) o r
n o ( T ) fo r d iffe re n t d o p in g d e n s itie s a n d d e f e c t e n e rg y le v e ls
2.1 Components of the SRH parameters and their dependencies 21
2.2 Evolution of lifetime spectroscopy 37
3.1 Capabilities and restrictions of contactless lifetime measurement 70 techniques
3.2 Specifications of most commonly used carrier mobility models 86
3.3 Parameters of Reggiani’s mobility model 89
3.4 Maximum temperature (Tmax) for different conductivity of wafers (at 93 300 K) below which the minority carrier has a negligible contribution to overall conductivity of the wafer
3.5 Calibration wafer details and their corresponding Voutfor selected 94 temperatures
3.6 Effect of typical errors in different parameters on overall lifetime 97 measurements
4.1 Reported results of the electronic properties of Mo related defects in 103 silicon
4.2 Temperature for which the assumptions (n\ + no) <0.01 x An and 104 p\ <0.0lx po is valid for analysis
5.1 Reported results of the electronic properties of Fe related defects in 116 silicon
6.1 Reported results of the electronic properties of Ti, in silicon 131 A . l Parameters of solar cells taken for PC ID simulation 149 B. l Minimum temperature (°C) for whichp\(T), n\(T) > 0.01 x An, where 153
An < 0.01 x p 0{T) or no(T) < p\, n\) for different Et
C . l Minimum temperatures (°C) for which n\(T) + no{T) < 0.01 x An and 156 p\(T) <0.01 x po(T) where An < 0.01 x po{T) for different Na and E, C.2 Minimum temperatures (°C) for whichp\(T) + p\{T) < 0.01 x An and 159
Introduction
1.1
Background and motivation
Solar photovoltaic (PV) technology is a renewable means for harnessing the abundant energy from the sun. The popularity of solar PV technology is high not only because it is environmentally friendly, but also because of its lower maintenance requirements. A solar cell is the core element of a PV system which converts incident solar radiation energy into electrical energy. Several types of solar cells are available in the current market, however more than 90% of solar cells fabricated worldwide are made of crystalline silicon. The advantages of crystalline silicon over other types of cells are found in its well suited band gap for PV conversion and its non-toxic nature. Furthermore, crystalline solar cell technology has benefited from well established processing techniques and wide knowledge of silicon as it has been used in semiconductor devices over several decades.
p - type silicon
Metal Impurity Concentration (atoms/cm5) MeUI Impurity Concentration Ippmal
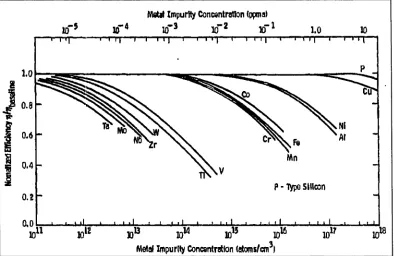
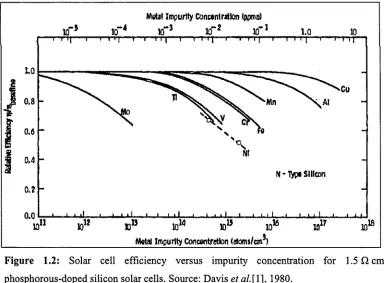
[image:15.531.84.478.435.691.2]On the other hand solar PV technology is still less commercially competitive in comparison to other established conventional energy sources like thermal or nuclear electricity, because of its high processing or manufacturing cost and low energy conversion efficiency. The most recent and highest conversion efficiency for crystalline silicon solar cell is 25.0% [2], with efficiency of silicon solar cells strongly related to material quality. Contamination by metal impurities during the growth of ingots and the processing of silicon solar cells and their electrical activation during cell operation lowers their efficiency. The improvement of cell efficiency requires the elimination of such electrically active defects, which in turn requires their identification and quantification in order to optimize the processing steps during cell fabrication. Hence the analysis of electrically active defects which is also known as characterization is of special importance as it helps to improve the cell quality and its efficiency. Figures 1.1 and 2.2 depict the effects of various metal impurities on the efficiency of solar cells (screen printed) in boron and phosphorus doped Czochralski-grown single-crystal silicon measured and reported by Davis et al.[ 1].
Meta! Impurity Concent ration (pproa)
N - Type Silicon
Metal Impurity Concentration (atomsfar. )
Figure 1.2: Solar cell efficiency versus impurity concentration for 1.5 Dem phosphorous-doped silicon solar cells. Source: Davis et al.[ 1], 1980.
[image:16.531.63.447.387.670.2]known as lifetime spectroscopy (LS), and can reveal fundamental properties of the dominant recombination centres. There are several other characterization techniques which are in use for the detection of impurities or which analyse their behaviour in silicon. Deep-Level Transient Spectroscopy (DLTS) [3] is another characterization technique which is accepted as the most sensitive technique for the detection of small concentrations of impurities and analysis of their electrical behaviours. However, experiments have shown that even concentrations of impurities below the detection level of DLTS have a significant effect on the carrier lifetime and hence the efficiency of the solar cells [4, 5]. In this regard lifetime spectroscopy is a highly sensitive and prominent characterization technique for the study of defect parameters.
The importance of minority carrier lifetime is illustrated in Figure 1.3, which depicts the efficiency as a function of minority carrier lifetime for different types of commercially available silicon solar cells at room temperature (300 K). The efficiencies of the solar cells are calculated by using a computer simulation (PCID) and the respected input parameters of for the simulation is presented in Appendix-A. The parameters used for simulation are just representational, and may vary in real solar cells. Figure 1.3 shows that the efficiency of solar cells increases monotonically with the minority carrier lifetime.
o 1 0
-- -- PERL (UNSW)
— High efficiency rear contact (SunPower) - - Screen prnted (Next Generation)
- Screen prnted (Industrial)
[image:17.531.114.446.458.706.2]Minority carrier lifetim e (S)
Lifetime spectroscopies are based upon the well known Shockley-Read-Hall theory[6,7] in general and have different approaches in analysis. As different defects have different responses to the carrier injection level or temperature, characterization of single or multiple defects in cells can be performed using lifetime spectroscopy by changing either one or both of the injection level and temperature. Depending upon the nature of analysis, lifetime spectroscopy can be identified with different names. Analysis in which injection density varies is known as injection dependent lifetime spectroscopy (IDLS). Similarly, analysis in which lifetime measurement and analysis is performed at different temperatures is known as temperature dependent lifetime spectroscopy (TDLS) and where both temperature and injection vary is known as temperature and injection dependent lifetime spectroscopy (TIDLS). As TIDLS is a synthesis of TDLS and IDLS, this analysis has the advantages of both techniques, making it a sensitive and versatile technique for defect characterization.
The first TIDLS instrument was developed and tested on aluminium-doped silicon by Schmidt et al. [8]. He measured and analysed lifetime data to determine the defect energy level (E,) and temperature dependence of the capture cross-section (cr„ and <7P).
The measurement device consisted of an inductive-coil PC instrument (WCT-100) from Sinton Consulting lnc[9], with a brass ring capable of heating the sample from 30 °C to 150 °C. A similar setup was used by Diez et al.[ 10, 11] and Brikholz et al.[ 12] for the measurement of E,, <7j<Jp and the defect concentration (N,) of tungsten and cobalt-
contaminated silicon, and the measurement of Eh <Jn and crp, of iron-contaminated boron-doped silicon. TIDLS analysis has been performed over a wider temperature range by Roth et al.[ 13] using a photoluminescence (PL) detector to measure E, of titanium-contaminated boron-doped silicon, and by Rein et al. [14] using a microwave (MW) PC detector to determine Et and on!ap of molybdenum-contaminated silicon. Rein et al. [15] combined the temperature-controlled MW detector and inductive-coil PC instruments to characterize recombination in iron-contaminated boron-doped silicon.
simplification of analysis, in spite of most of the carrier capture mechanisms and their ratios in silicon being temperature dependent [16-20]. A variation of TIDLS that accounts for and determines the temperature dependence of on and <JP or o J o p will give a better understanding of carrier recombination and hence defect characterization. Second, TIDLS measurement instruments so far have either narrow operating temperature ranges (30 to 150°C) [8] or need to use two or more instruments with different measurement techniques[15]. A single instrument with a wide operating range for injection density (An) (1 x 10¹¹ to 1 x 1017 cm'3) and temperature (-150 to 300 °C) is desirable for TIDLS measurement.
In this context, this work is dedicated to filling the above mentioned two gaps seen in TIDLS characterization by proposing a new analysis technique which explicitly determines <T„ and <JP at different temperatures and the development of an instrument suitable for measurements over a wide range of temperatures and injection levels. Moreover, this work also presents the application of the new analysis and the refined instrument to characterize three common impurities in silicon: molybdenum, iron and titanium
1.2 Thesis outline
Chapter 2 discusses the fundamentals of carrier lifetimes, lifetime spectroscopy and their importance in defect characterization in silicon. The first section of this chapter presents the fundamentals behind the different types of carrier recombinations in silicon. The second section presents the derivation of the Shockley-Read-Hall (SRH) lifetime equation, which is followed by a discussion of SRH equation parameters and their dependencies on temperature in section three. Section four discusses the advantages and disadvantages of traditional lifetime spectroscopy and a new analysis technique for the determination of electrical properties of defects in silicon is presented in section five.
in Section three. Finally it presents the effect of input parameters and discusses the uncertainty of results.
Chapter 4 presents a temperature dependent carrier lifetime study of Molybdenum (Mo) defects in silicon, based upon the new TIDLS procedure presented in Chapter 2 and using the instrument developed in Chapter 3. The first section discusses the importance of Mo-defects in silicon and previous work in their characterization. This is followed by a discussion of methodology and sample details and then results and analysis of temperature dependent carrier capture cross sections of Mo-defects in silicon in Section 3. This section also presents the effective capture mechanism of carriers of Mo-defects and assesses its defect energy level.
Chapter 5 presents the characterization of iron-related defects in boron-doped silicon using the above mentioned new characterization procedure. The first section discusses the importance of iron-related defects in silicon and previous characterization work. This is followed by a discussion of characterization methodology and presents sample details for this experiment, followed by the results and discussion of temperature dependent carrier capture cross sections of interstitial iron and iron boron pair defects in silicon, and their effective capture mechanism.
Chapter 6 presents the procedure for and results of characterization of titanium-related defects in multi-crystalline silicon. The first section discusses the importance of Titanium-related defects in silicon and previous characterization work. Section 6.2 discusses methodology and presents sample details for the experiments. Section 6.3 presents the procedure for determining the active defect energy level, which is followed by results and discussion of electron capture cross section and effective capture mechanism in Section 6.4. Section 6.5 presents the lower values of the segregation coefficient of Ti in multicrystalline silicon.
This thesis closes with a conclusion in Chapter 7.
References
[2] M. A. Green, K. Emery, Y. Hishikawa, and W. Warta, "Solar Cell Efficiency Tables (Version 34)" Prog. Photovolt: Res. Appl, vol. 17, pp. 320-326, 2009
[3] D. V. Lang, "Deep-level transient spectroscopy: A new method to characterize traps in semiconductors," Journal of Applied Physics, vol. 45, pp. 3023-3032, 1974.
[4] S. A. McHugo, H. Hieslmair, and E. R. Weber, "Gettering of metallic impurities in photovoltaic silicon," Applied Physics A: Materials Science & Processing, vol. 64, p.
127, 1997-02-15 1997.
[5] S. W. Glunz, S. Rein, J. Y. Lee, and W. Warta, "Minority carrier lifetime degradation in boron-doped Czochralski silicon," Journal of Applied Physics, vol. 90, pp. 2397-2404, 2001
[6] W. Shockley and W. T. Read, "Statistics of the Recombinations of Holes and
Electrons," Physical Review, vol. 87, p. 835, 1952
[7] R. N. Hall, "Electron-Hole Recombination in Germanium," Physical Review, vol. 87, p. 387, 1952.
[8] J. Schmidt, "Temperature- and injection-dependent lifetime spectroscopy for the
characterization of defect centers in semiconductors," Applied Physics Letters, vol. 82, pp. 2178-2180, 2003
[9] www.sintonconsulting.com, December, 2009.
[10] S. Diez, S. Rein, and S. W. Glunz, "Analyzing defects in silicon by temperature and injection dependent lifetime spectroscopy," in 20th EU PVSEC, Barcelona, Spain, 2005, p. 1216.
[11] S. Diez, S. Rein, T. Roth, and S. W. Glunz, "Cobalt related defect levels in silicon analyzed by temperature- and injection-dependent lifetime spectroscopy," Journal of Applied Physics, vol. 101, p. 033710, 2007.
[12] E. B. Jens, B. Karsten, M. Daniel, and S. Jan, "Electronic properties of iron-boron pairs in crystalline silicon by temperature- and injection-level-dependent lifetime measurements," Journal of Applied Physics, vol. 97, p. 103708, 2005.
[13] T. Roth, M. Rudiger, S. Diez, T. Trupke, R. A. Bardos, and S. W. Glunz, "Analysing defects by temperature and injection dependent lifetime measurements," in 21st European PVSEC, Dresden, Germany, 2006.
[14] S. Rein and S. W. Glunz, "Temperature and Injection Dependent Lifetime Spectroscopy (TIDLS): Advanced analysis," in 19th EU PVSEC, Paris, France, 2004, p. 479.
[15] S. Rein and S. W. Glunz, "Electronic properties of interstitial iron and iron-boron pairs determined by means of advanced lifetime spectroscopy," Journal of Applied Physics,
vol. 98, p. 113711,2005.
[16] C. H. Henry and D. V. Lang, "Nonradiative capture and recombination by multiphonon emission in GaAs and GaP," Physical Review B, vol. 15, p. 989, 1977.
[17] M. Lax, "Cascade Capture of Electrons in Solids," Physical Review, vol. 119, p. 1502, 1960.
[18] J. C. Bourgoin and M. Zazoui, "Carrier capture on defects in multiband
semiconductors," Physical Review B, vol. 45, p. 11324, 1992.
[19] R. M. Gibb, G. J. Rees, B. W. Thomas, B. L. H. Wilson, B. Hamilton, D. R. Wight, and N. F. Mott, "A two stage model for deep level capture " Philosophical Magazine, vol. 36, pp. 1021 - 1034, 1977.
[20] A. Hangleiter, "Nonradiative recombination via deep impurity levels in silicon:
Carrier lifetimes and lifetime spectroscopy
Lifetime spectroscopy is the measurement and analysis of the recombination lifetime of a semiconductor wafer. It is applied as a defect characterization technique in the semiconductor industry and in this thesis. This chapter describes the fundamental principles of the recombination lifetimes and their parameters, and the various existing lifetime spectroscopy techniques and their limitations. Furthermore, this chapter presents a new approach to temperature and injection dependent lifetime spectroscopy (TIDLS).
Section 2.1 introduces three types of recombination mechanisms in semiconductors. Section 2.2 presents the derivation and assumptions of the Shockley-Read-Hall (SRH) recombination equation. Section 2.3 discusses the effect of temperature on the SRH parameters. Section 2.4 presents existing lifetime spectroscopy technique, and finally, Section 2.5 proposes a new analysis approach for the determination of electrical properties of metal impurities in silicon. This new technique will be used for defect characterization in Chapters 4, 5 and 6.
2.1
Carrier generation, recombination and lifetime in semiconductor
2.1.1 Generation and recombination in semiconductors
Ä Conduction Band Conduction Band
-o
E r•
Generation
Energy absorbed
Recombination
Energy dissipated
o
t .1
o
o
C P e p
Valance Band
(a)
Valance Band
(b)
o
Figure 2.1: Pictorial representation of (a) band to band or intrinsic generation and recombination in silicon, (b) defect assisted generation and recombination in silicon.
Generation and recombination are spontaneous phenomena in silicon. In thermal equilibrium the generation rate (Go) is equal to the recombination rate (Rq). The product of the electrons (no) and holes (po) concentrations remains constant at thermal equilibrium and the square root of that product is known as the intrinsic carrier concentration («,■). When the silicon is subject to optical excitation, generation (G > Go)
and recombination (R > R0) both increase and counterbalance each other. Accordingly, the concentrations of electrons (n) and holes (p) also increase above their thermal equilibrium values (no and p 0). When optical excitation is ceased, the excess carrier concentrations (n - n0 and p - p o ) decrease at a certain rate (U), which is the difference between the total recombination rate (R) and the equilibrium recombination rate (Ro). For silicon without any trapping defects the excess number of electrons (An - n - no) is always equal to the excess numbers of holes (Ap = p - po). Hence during the spontaneous recombination process and in the absence of generation, An can be expressed as a function of time An(t). The recombination rate U is a function of the carrier concentrations, and can be written as U(An(t\ no, po). Then the time decay of An(t) can be expressed as
(2-1)
at
T(An,n0, p0) A n(t) dAn(t)
dt
An{t)
U{An(t),n0, p 0) (2.2)
This is the general expression of carrier lifetime in a semiconductor and the solution for An(t) can be expressed as
An(t) = Att(O) exp| - —
? j
(2.3)
where r is a time constant of the exponential function of An(t) and known as the lifetime.
The recombination mechanisms in silicon are classified as “intrinsic” and “defect- assisted” on the basis of their character. Intrinsic recombination is also known as band to band recombination and is unavoidable. This is further classified as radiative and Auger recombination [1] on the basis of the nature of the release of the excess energy by the decay of electron-hole pairs. In the defect-assisted recombination process, the number of electron-hole pairs decays by the transition of electrons from the CB to VB through a defect energy level, which lies between the CB and VB. This recombination mechanism is known as Shockley-Read-Hall (SRH) recombination [2, 3]. This recombination mechanism can be avoided theoretically by producing a perfect crystal structure. However in practice SRH recombination is the most dominant recombination process because many defects are introduced either by impurities or lattice defects in the bulk of silicon and by dangling bonds at the surfaces, and by virtue of the fact that radiative recombination is suppressed in crystalline silicon due to its indirect band-gap. This section describes the three processes and presents their expressions and their parameters for all recombination mechanisms mentioned above.
2.1.2 Effective and multiple recombination lifetimes
The three recombination mechanisms occur simultaneously. Each recombination mechanism has its own lifetime and the overall recombination rate is the sum of the individual rates. For a sample which has active radiative (URa(j), Auger (UAug) and SRH ( Usrh) recombination mechanisms, the total recombination rate (UTotal) is the sum of
recombinations are given as TRad, TAugand TSRHrespectively, then the effective lifetime Treat can be expressed as
1
TTotal
1 1 1
---1---1
---^ Rad ^ A u g ^ SRI I
(2.4)
^ Aug
Region for lifetime analysis,
[image:25.531.68.428.132.447.2]Excess carrier density An (cm")
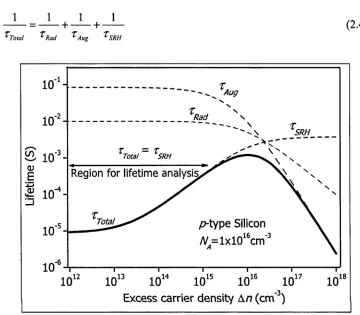
Figure 2.2: Effective lifetime composed of SRH, radiative and Auger terms. Lifetimes are calculated for a typical solar cell at 300 K, doping density,
1 x 1015 cm'3 (boron) and impurity density, 5 x 1011 cm'3 (titanium).
Figure 2.2 depicts the three lifetimes as a function of An and their resultant lifetime ( Ttoioi)' This figure plots the lifetimes for a p-type silicon with doping density 1 x 1015 cm'3 with defect energy level 0.28 eV above the valance band and shows the relative importance of SRH lifetime for a typical silicon solar cell. Coefficients for Auger recombination and radiative recombinations are taken as B = 1 x 10'14cm V ' [4] and Cn = 2.8 x 10’31 cm V 1 and Cp = 9.9 x 10'32 cm V 1 [5] respectively. Capture cross section
for SRH recombinations are taken as <J„ = 1.92 x 10'14 cm2 and crp = 5.3 x 10’17 cm2 [6]. TRad
(> lx 1016 cm'3) ZSrh is often much higher than TRad and TAug, and so no longer dominates the effective lifetime. Hence for the purpose of defect characterization, analysis of TTo,a\ when equal to TSRH at lower values of An is preferred.
2.1.3 Radiative recombination
Radiative recombination is a process in which an electron in the CB recombines with a hole in the VB by emitting a photon with an energy equal to the band gap. The radiative recombination rate L W is a function of the concentration of electrons and holes in the CB and the VB respectively and can be expressed as
^ = - 5 ( « x p - « , 2) (2.5)
where B is a constant. B accounts for the probability of recombination and depends upon the band structure of the semiconductor [4]. Conservation of momentum of carriers must prevail during the recombination process, hence the probability of radiative recombination in a direct-band semiconductor (GaAs) is higher than for the indirect-band semiconductor (Si). The value of B for silicon is 1 x 10'u c m V ‘ and 3 x lO'10 cm3s'1 for GaAs [4] at 300 K.
Equation (2.5) is valid for both equilibrium and non-equilibrium conditions, so by replacing n = «o+ An and p = po + Ap (and assuming An = Ap) the recombination rate can be expressed as
U Rad =B{n0 + p 0)An + BAn2 (2.6)
from which the recombination lifetime can be determined using Equations (2.2)
An _ 1
Rad B(n0 + p 0 )A n + BAn2 B(n0 + p 0 +An) (2.7)
TRacj switches from inversely-proportional to NA to inversely-proportional to An for An > Na.
This radiative recombination mechanism is dominant in direct-band semiconductors (for example GaAs). However, it has negligible effect in comparison to SRH or Auger recombination mechanisms in an indirect-band semiconductor, i.e in silicon, as seen in Figure 2.2. This thesis is confined to the defect characterization of silicon, so this recombination mechanism has little importance for this work.
2.1.4 Auger recombination
Auger band-to-band recombination is another form of an intrinsic recombination mechanism. In this recombination the excess energy released by annihilation of an electron with a hole is transferred to a third free carrier instead of emitting a photon as in the case of radiative recombination. The Auger recombination rate UAug is dependent upon the type of third carrier and is also named after it. If the third carrier is an electron in the CB, it is called an electron-electron-hole (eeh) recombination event, and if the third carrier is a hole, then the process is called an electron-hole-hole (ehh) recombination event. The corresponding recombination rates are expressed as Ueeh = Cn(n2p - n02po) and Uehh = Cp(np2 - nopo2)- Where Cn and Cp are the Auger coefficients of the eeh and ehh process respectively and the most quoted values are C„ = 2.8 x 10'31 c m V and Cp = 9.9 x 10"32 c m V [5]. The net recombination rate can be expressed as
e Aug„= C „(n2p -n "0p 0)+ C p{np2- n 0p l ) (2.8)
For /7-type silicon, no « po and An, so n = no + An can be replaced by An and any product of no can be neglected. Similarly, for «-type silicon, p 0 « no and An, so p =po + Ap can be replaced by An (Ap = An) and any product of po can be neglected. Hence the Auger recombination lifetime can be expressed as
:— ---fo r /7 -ty p e
1 8 7
For samples with NA or No less than 5><10 cm' , the Auger lifetime is calculated by using the values of C„ and Cp stated above and are found to be larger than the measured values [1]. Hangleiter [7] and Hacker [8] put forward a “coulomb-enhanced Auger recombination” theory to explain this problem. This theory describes the coulombic interactions between electron-electron, electron-hole and hole-hole as the reason for a smaller value of actual Auger lifetime for a lower doping level.
The Auger recombination mechanism is natural and unavoidable in a silicon solar cell and has a significant effect for higher levels of An as depicted in Figure 2.2. To avoid the effect of xAug in Te//, this work concentrates on lifetime analysis in medium and low injection levels (An <1 x 1015 cm'3) for defect characterization.
2.1.5 Shockley-Read-Hall recombination
Conduction Band Conduction Band
1t
1 '
Cn 2
r
en
E,
2 3
e p
Occupied state Empty state
Valance Band
(a)
o
Valance Band(b)
o
E,
Ey
Figure 2.3: (a) State before carrier transaction (b) state after carrier transaction.
electron from the CB (1) or emit a hole into the VB (4) while a filled defect can emit an electron into the CB (2) or absorb a hole from the VB (3). These four fundamental interactions of the defect energy level are depicted in Figure 2.3. Figure 2.3(a) shows the state before the carrier transaction and Figure 2.3(b) represents after the carrier transaction.
Depending upon the combination of these four fundamental carrier transitions, each defect can behave as a recombination, a generation or a trap centre. The combination of transitions (1) and (3), in which an electron from the CB is captured by an empty defect level, then sees the defect level absorb a hole from the VB which is annihilated by the previously absorbed electron is known as recombination. Conversely, a defect level can emit an electron to the CB (2) and a hole to the VB (4). This process is called generation, where the defect level behaves as a generation centre. The electron and hole captured by the empty defect level may be bounced back to its original level, which is the combination of transition (1) and (2) or (4) and (3). This process is called trapping and the defect level is then known as a trap centre.
2.2 Derivation of the SRH equation and its assumptions
The SRH equation is an essential element of any type of lifetime spectroscopy. The proposed TIDLS for this work is also based upon the SRH equation. This Section presents the derivation of the comprehensive form of the SRH equation and discusses the assumptions necessary to simplify it.
2.2.1 The SRH equation
a. Rate o f change o f carrier concentrations: The rate of change to electron density in the CB and hole density in the VB can be determined by using their capture and emission rates. The capture rate of electrons (Cn) and holes (Cp) for a defect centre in the lattice of a semiconductor can be expressed as [10]
Cn - &nv lhn = cnn for electrons and C = <JpVthp = c pp for holes (2.10)
of as its movement in relation to carriers which are regarded as immobile. The defect centre sweeps out the volume an x vXh on the CB and op x vtyl on the VB in each second , and captures electrons or holes. If (f,) is the probability of emission of the electrons by a defect centre in the CB, i.e. the occupation by the electrons, then (1-/) is the probability of capture of the electrons. For N, number of defects with the same defect energy level, then the total number of electron emissions is proportional to N, x f and capture is proportional to Nt x (1-/). Conversely, the total number of hole emissions is proportional to N, x (1 -f) and capture to Nt x f . Hence the rate of change of the electrons and holes can be expressed as
du x
— = electron emission - electron capture = en N t f t - cnnNt (l - ft ) (2.11)
dp
dt hole emission - hole capture = epN t (l - f t ) — c p N tf t (2.12)
where en and ep are the emission rate of electrons and holes respectively and can be determined in an expression formed by subjecting Equations (2.11) and (2.12) to an equilibrium condition dn/dt = 0 and dp/dt = 0. The expression for en and ep are expressed as
en / = cnn
V
1
- / ,
/,
A )
and ep (2.13)
where n and p are the number of electrons and holes respectively.
b. The occupation probability (ft) is determined using Fermi-Dirac integral approaches with Boltzmann’s statistics for thermal equilibrium with carrier concentrations of no and po [11] in the CB and VB. The expressions for no and po for a Fermi energy level Ef in a
non degenerated semiconductor are
« 0 N c exp
Ec ~ E f ' k ß T j
and p 0 N v exp E f - E y ' k B T ,
(2.14)
energy level, kg is Boltzamnn’s constant and T is temperature, in Kelvin. Nc and Ny are dependent upon the effective masses of the electrons and holes [11]. Hence, the emission rates for equilibrium with a defect energy level E, can be expressed as
e„=c„Nc ex P
v
Ec-E,"
k J J
and = c pexpE , - E f '
k BT j (2.15)
When the Fermi level coincides with the defect energy level (E,) the emission rate is equal to the product of capture rates (c„ and cp) with corresponding equilibrium carrier concentrations no and po. However for other conditions the electron and hole concentrations are termed as SRH carrier densities and denoted as n\ and pi, which are expressed as
/?, = N c exp f
V
Ec - E , ' and
P\ N v exp E , - E r '
k B T >
(2.16)
Equation (2.15) can be simplified to Equation (2.17) by using Equations (2.10) and (2.16)
= cnn{ and = c pp ] (2.17)
Hence the occupation probability of an electron f is expressed by equating Equations (2.10) and (2.11) with Equation (2.16) as dn!dt = dpldt, which gives
/,
Cnn + CpP\c„(" + ”\) + cp( p + P\) (2.18)
c. Expression fo r Usrh and tsrh• Subjecting the value of f to either Equations (2.10) or (2.11) and applying n\p\ = nf (Intrinsic carrier concentration), the recombination rate can be expressed as
USRH np - n. np - nj
” + I P + P\ r p0(n + n,) + Tn0(p + p ,) cpN t cnN t
where r„o and zpo are known as fundamental capture time constants and depend upon the capture cross section (o), thermal velocity (v^) and defect concentrations (N,) and are expressed as
^nO and
Tp° N a yp th
(2.20)
The non equilibrium carrier densities n and p can be replaced by the sum of the carrier densities at thermal equilibrium {no + po) with the excess carrier densities {An and Ap). For negligible trapping effect o f the defect level An = Ap, hence the SRH lifetime can be expressed as
An 7p0 ("i + n0 + An) + r„0 (p„ + />, + An)
---= — ---7---— --- (2.21)
Usm + A) + An
2.2.2 Assumptions for SRH lifetime expressions
There are four assumptions made in obtaining the simplified expression for the SRH lifetime expressed in Equation 2.20. In general these assumptions are valid, however they need to be taken into account while using this expression for the ensuing analysis. It is worthwhile to discuss these assumptions as they need to be fulfilled in the lifetime spectroscopy technique used throughout this thesis.
1. Defect levels involved in recombination have the same energy level E, and are stable.
2. Non-degenerate semiconductor.
This assumption is part of a condition of the Fermi-dirac distribution which is used during the derivation of SRH lifetime to obtain the thermal equilibrium number of electrons (no) and holes (po). This assumption is valid in the bulk region of a silicon wafer, however this may not be valid in heavily diffused regions. All analysis in this thesis is performed for defects in the bulk of the silicon, hence this condition is satisfied throughout this work.
3 The defect concentration (N,) is ‘small’
This condition is necessary to ensure that the SRH lifetime reflects the recombination lifetime of the carriers in cases when not all the defects act only as recombination centres. When the defects also act as trapping centres the excess carrier concentrations can become unequal (An £ Ap).
Macdonald et. al. [12] presented an analytical expression for the upper limit of N, above which the standard SRH theory becomes inaccurate to support assumption 3. On the basis of their work, which compared the simplified SRH model with a more general model that accounts for the trapping effect, Macdonald et. al. suggest a critical defect density (Ncrit) which must not be exceeded by the recombination centre density, and which is a function of N Dop,defect energy level E, and the capture cross sections (cr„ and
ttp). The expression for N critfor a /?-type silicon at low level injection is
i r l L I _ [ / ' o + A ] X [ « l + ( ^ o / r p o ) ( P o + / ’ l ) ]
^ cat i ~ \ \ Z . I A )
Po- (t„o/tpo)P>
This condition is fulfilled in the experiments and analyses performed in this work. 4. The relaxation time of the charge carrier captured is negligibly small in comparison with the average time between two emission processes.
between actual lifetime and trapping-free SRH lifetime. Relaxation time of the captured charge carrier depends upon temperature [13, 14]. This assumption can be verified by analysing the measured injection dependent carrier lifetime data over a wider range of temperatures.
2.3 Parameters of the SRH equation
Table 2.1: Components of the SRH parameters and their dependencies.
Components of the
SRH parameter Relationship to SRH parameter
Defect Dependent
Temp Dependent
C a r r ie r c a p tu r e c r o s s s e c ti o n s
(<r„ a n d
op
)C a p tu r e tim e c o n s ta n t s (rp0 a n d t„0)
op
= (rpo x v lhp x A ,) '1 f o r p - t y p e a n d On= (r„o x v thp x A ,) '1 f o r « - ty p eV V
T h e r m a l v e l o c it ie s o f
c a r r ie r s
( v thp a n d v thn)
C a p tu r e tim e c o n s ta n t s (rp0 a n d t„0)
v,hp = Opo x
op
x A ,) '1 f o r p - t y p e a n dVthn= h „ 0 x
on
x A ,) '‘f o r « - t y p eX V
I m p u r i ty d o p in g
c o n c e n t r a tio n
( Ndo p)
E q u ili b r iu m c a r r ie r c o n c e n t r a tio n s
Adop ~ Po f o r p - t y p e a n d
N Dop ~ «o f o r « - ty p e
X V
I n tr i n s ic c a r r ie r c o n c e n t r a tio n
(«/)
E q u ili b r iu m c a r r ie r c o n c e n t r a tio n s
ni2 ~ « 0x Ndop f o r p - ty p e a n d
n f ~ p o x N DOp f o r « - ty p e
X V
D e f e c t c o n c e n t r a tio n
W )
C a p tu r e tim e c o n s ta n t s (Tp0 a n d r„0)
A , = (ipo X
op
X v,hp)A f o r p - t y p e a n d A , = (r„0 x (7„ x v , ^ ) '1 f o r « - ty p eX X
D e f e c t e n e r g y le v e l
(AE d
S R H c a r r ie r d e n s itie s (p i a n d « 0
AE , = -k Bx T x l n ( p \ / N y) f o r p - t y p e AE , = - k B ' X T x l n ( n \ / N c ) f o r « - ty p e
V X
S ta te d e n s itie s o f c a r r ie r in b a n d s
( N y a n d A c )
S R H c a r r ie r d e n s itie s (p\ a n d « 0
N v = p \ / e x p (-z l£ '/ / k BT) f o r p - t y p e a n d A c = « 1 / ex p (-z J£ , / k BT) f o r « - ty p e
X V
The SRH equation is a combination of four defect specific parameters (t„o, Zpo, «i and
[image:34.531.74.486.231.580.2]2.3.1 Capture time constant for electrons and holes
(t„0 and
Tp0)Electron and hole capture time constants (r„o and Tpo) are dependent upon the respective capture cross sections (o), thermal velocity (v,/,) and defect concentrations (Nt). The expression for rno and tpo is presented in Equation (2.20). The parameters of rn0 and zp0 and their constituent parameters are described below.
Excitonic Auger Capture
Two Stage Model of Cascade Capture Cascade Capture * < • • •
Multiphonon Emission Capture
200
250
300
350
400
450
500
550
600
T em peraure (K)
Figure 2.4: Temperature dependencies of different capture mechanisms.
a. Carrier capture cross sections (<7n and <jp)
In the SRH recombination process the carrier capture cross sections (<7„ and op) are
[image:35.531.83.428.212.460.2]capture mechanisms by which they capture the carriers. Three different capture mechanisms have been proposed in which they are categorized on the basis of the energy released during the capture process. The temperature dependency of Gnand Gpis
decided by the effective capture mechanism they follow. Three capture mechanisms and their thermal models are discussed here.
i. Radiative Capture
In the radiative capture process, excess energy is dissipated in the form of photon emission. This type of capture process is relevant to direct band semiconductors such as GaAs. However in the case of indirect band-gap semiconductors (Si, Ge etc), the radiative capture process is irrelevant [15] for room temperature and above. Furthermore, in the radiative capture process, the energy is dissipated in the form of photons and gives rise to a characteristic line in the emission spectrum corresponding to the depth of the defect in the silicon band gap. In this regard Hangleiter et. al. [16] mentioned that most impurities in silicon do not show such deep luminescence in the spectrum and, if shown, they are too weak and not sufficient to explain recombination [17]. The capture cross section size of this mechanism is 10'24 to 10‘22 cm2 and independent of temperature, i.e. o{T)~ constant [18].
ii. Phonon-assisted capture
The capture process in which the energy is dissipated in the form of a phonon is known as phonon-assisted capture. This capture process is modelled as multiphonon emission capture (MPE) [19], cascade capture [20, 21] and a two-stage model of cascade capture [22] depending upon their nature as defect centres.
temperature dependence of this capture mechanism is best described with a power law [20] and can be expressed as
a (T) = cJ0x T - a (2.23)
where oo is known as the T-dependent pre-factor of the capture cross section and its value lies between 10'12 to 10'15 cm2 and the value of temperature exponent a lies between 1 and 4. This capture mechanism is explained for the shallow impurity level which has coulomb attraction, however it does not explain recombination through a deep level defect centre with coulombic attraction [18].
In the MPE capture process the defect energy level crosses the CB by virtue of lattice vibration and captures a free electron. The equilibrium state of the occupied defect level jumps to a new equilibrium state after the capture process. These transitions of occupied defect levels result in the release of energy in a form of localized lattice phonons. A large amount of excess energy is released during the MPE capture process. This capture mechanism is relevant to the defect levels which are near the centre of the band gap, which are also known as deep levels. Furthermore, as MPE capture is the result of lattice vibration, the capture probability increases with temperature and can be expressed as
(j(T) = ( 7„ xc xp( -Ea / k BT) (2.24)
where a«, is known as T-dependent pre-factor of the capture cross section and its value lie between 10'14 and 10'15 cm2 [19]. Ea is known as the activation energy that has to be overcome by the defect level to capture an electron in the CB or a hole in the VB and may lie anywhere between 0 and 0.56 eV (half of band gap).
cr(T) = cr0 XT 2 xexp E, - E (2.25)
where E\ is the energy level of the first excited state and E« is the thermal barrier. The capture cross section decreases with increasing temperature for this type of carrier recombination.
iii. Auger capture
The capture process in which excess energy is transmitted to the other free carriers is known as the Auger capture process and it is further divided into two categories, classical and excitonic Auger capture. In the classic Auger capture process two independent free carriers meet at the impurity site and one of the carriers jumps into the defect level while the other receives the excess energy and becomes excited in its respective band. This capture process is less likely to be T-dependent and linearly dependent upon the carrier concentration [23].
Excitonic Auger capture is another type of Auger capture mechanism which considers a free exciton (a bound state of an electron-hole pair) containing a carrier to be captured and another to take over the excess energy when Auger capture occurs. As excitons are the main contributor of this type of recombination and their presence is strongly T- dependent, the capture process is also temperature dependent. For temperatures below 60 K, all carriers are bound as free excitons, hence the capture cross section is not dependent upon temperature. However for temperatures above 60 K, the capture cross section decreases with the increase in temperature, as more excitons become thermally ionized. The T-dependent expression for the excitonic Auger capture can be expressed as [24]
<J(T) = <J0x T ~ a f or E > 6 0 E (2.26)
where <70 is known as the T-dependent pre-factor of the capture cross section and its value lies between 10'12 and 10'15 and the value of the temperature exponent a can be any positive value (a > 0).