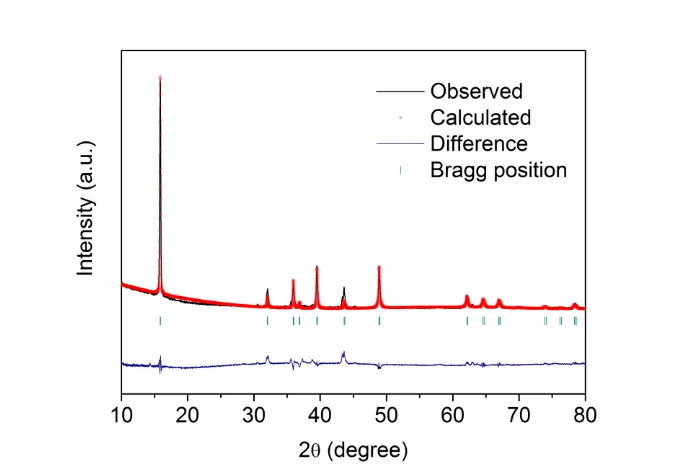
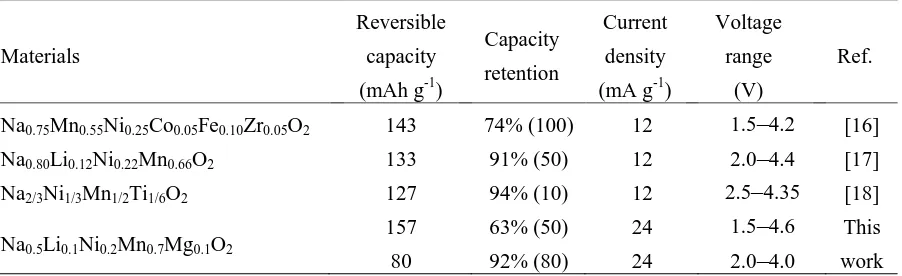
Synthesis and Electrochemical Performance of Na0.5Li0.1Ni0.2Mn0.7Mg0.1O2 as a Cathode for Sodium-Ion Batteries
Full text
Figure


Related documents
Measurable plasma concentrations of calcitonin were observed in 11 of 33 hypercalcemic cats, and the highest plasma calcitonin concentrations (median, 4.7 [2.1, 28.4] pg/mL;
An important question in managing patients with prior anti- NMDAR encephalitis concerns the duration of long-term monitoring after the initial episode to facilitate early
Heim N, Griesbeck O (2004 ) Genetically encoded indicators of cellular calcium dynamics based on troponin C and green fluorescent protein. Heim R, Tsien RY (1996 ) Engineering
The objective is to investigate whether enriched enteral nutrition given shortly before, during and early after colo- rectal surgery, reduces POI and AL via stimulation of the
Primary: To test the effect of a face-to-face structured patient-specific smoking cessation program delivered by trained ambulatory pharmacists on smoking cessation rates in
This study investigates the influence of the skip fire cycle method for applied CDA to small displacement engine on specific fuel consumption and exhaust emissions
It was decided that with the presence of such significant red flag signs that she should undergo advanced imaging, in this case an MRI, that revealed an underlying malignancy, which
Figure 4 Latent and lytic EBV genes are co-expressed in gastric cancer. A portion of the heat map from Figure 1 is displayed in high contrast to decipher relative expression levels
