Int. J. Electrochem. Sci., 12 (2017) 1846 – 1862, doi: 10.20964/2017.03.29
International Journal of
ELECTROCHEMICAL
SCIENCE
www.electrochemsci.orgA Novel Kind of Activated Carbon Foam Electrode for Electric
Double Layer Capacitors
Peng Chang1, Zhihong Qin2,*
1
School of Chemical Engineering and Technology, China University of Mining & Technology, Xuzhou 221116, China
2
Key Laboratory of Coal Processing and Efficient Utilization (Ministry of Education), Xuzhou 221116, China
*
E-mail: [email protected]
Received: 7 December 2016 / Accepted: 12 January 2017 / Published: 12 February 2017
In this paper, a novel kind of activated carbon foam (ACF) electrode for electric double layer capacitors (EDLCs) was prepared by a KOH activation procedure on primary carbon foams synthesized via foaming of loose medium component (LMC) which was separated from raw coal by extraction and back-extraction processes and then studied electrochemically using cyclic voltammetry. With the aim of exploring the optimum experimental conditions, the influences of process variables, such as foaming temperature, activation temperature, activation time and KOH/carbon mass ratio on specific capacitance of ACFs were investigated. The morphology, structure and textural properties of the optimum ACF were characterized with N2 adsorption technique, Raman spectrometer, scanning
electron microscopy, transmission electron microscopy and X-ray photoelectron spectrometer. The electrochemical behaviors were analyzed by cyclic voltammetry, galvanostatic charge-discharge cycling and electrochemical impedance spectroscopy. The obtained results show that under the optimum experimental conditions, the sample possesses the specific surface area of 3526.31m2 g-1, total pore volume of 1.972cm3 g-1 and exhibits the highest initial specific capacitance of 204.17F g-1 at current density of 1A g-1 in 6M KOH solution. It shows excellent cycling stability with a capacitance retention of 97.9% after 3000 charge/discharge cycles at current density of 1A g-1, promising its practical application in EDLCs. Thus, the favorable capacitive performances make the ACFs act as a new kind of carbonaceous electrode material for high-power supercapacitors.
Keywords: activated carbon foam; loose medium component; electric double layer capacitors; optimum experimental conditions
1. INTRODUCTION
back-up systems [1-3]. Due to some attractive characteristics, such as high power density, long cycle life, superior rate capability and wide range of operating temperature [4-6]. According to the different fundamental charge storage mechanisms, supercapacitors can be divided into two categories: EDLCs and pseudocapacitors. Charge storage of EDLCs arises from the charge separation at the carbon/electrolyte interface [7]. Up to now, various kinds of electrochemical active materials have been used as electrode materials for EDLCs. Among them, due to the high specific surface area (SSA), better conductivity, excellent chemical stability and easy processing, porous carbon material has been widely applied [8-10].
On the other hand, highly reasonable pore size distribution (PSD) also plays a decisive role in improving capacitor’s performance. It is common knowledge that the existence of micropores can significantly improve the SSA and is directly responsible for the charge storage while the mesopores and macropores provide highways and reservoirs for ion transport which could benefit the rapid diffusion kinetics of ions [11-13]. Thus, in order to achieve high capacitance, many efforts should be devoted to the synthesis of porous carbon material with narrow and controlled PSD as well as tailored and developed porous structure.
Carbon foam is a novel kind of lightweight sponge-like porous carbon material with many superior features e.g. corrosion resistance, good thermal conductivity and adjustable electrical conductivity [14-16]. Based on our previous work, we have successfully prepared a novel kind of thin-walled carbon foam with developed foam structure and ultrathin pore walls. Naturally, sufficient porosity makes them very appealing for preparation of porous carbon material. The developed foam structure and ultrathin pore walls of carbon foam provide large contact area, many reaction sites and suitable structural basis for activation work. Generally, ACFs with well-developed porous structure, large SSA and appropriate PSD often lead to high specific capacitance [17, 18]. Thus, exploring the optimum experimental conditions of ACFs has been a long term goal for the development of electrode materials, which may provide new opportunities for electrochemical energy storage.
In this study, ACFs were synthesized from LMC by foaming and chemical activation with KOH. With the aim of determining the optimum experimental conditions, influences of main process parameters (such as foaming temperature, activation temperature, activation time and KOH/carbon mass ratio) on electrochemical properties of ACFs were studied. Furthermore, the porous properties of optimum ACF were analyzed with N2 adsorption technique, scanning electron microscope (SEM) and
transmission electron microscope (TEM) while the electrochemical behaviors were characterized by cyclic voltammetry (CV), galvanostatic charge-discharge (GCD) tests and electrochemical impedance spectroscopy (EIS) in 6M KOH electrolyte.
2. EXPERIMENTAL SECTION
2.1 Preparation of LMC
stirred for 3h. After the extraction process, 20L deionized water used as back-extraction agent was added into extraction kettle and stirred for 40min. Then, the strip-extraction liquor was layered. The lower dark layer was CS2 layer and the upper layer was water and NMP layer. At last, LMC was
obtained by centrifugation of upper layer liquor at a speed of 6000r min-1 for 20min and the yield was about 17% [19]. The proximate and ultimate analyses of raw coal and LMC are listed in Table 1.
Table 1. Proximate and ultimate analyses of raw coal and LMC
Sample Proximate analysis (wt %) Ultimate analysis (wt %)
Mad Ad Vdaf FCdaf Cdaf Hdaf Odaf* Ndaf St,daf
Raw coal 1.27 24.20 24.94 75.06 86.50 5.05 6.32 1.47 0.66
LMC 0.48 2.21 27.53 75.63 84.72 5.20 6.72 2.59 0.77
*
: by difference; Mad: moisture (air dried base); Ad: ash (dry base); Vdaf: volatile matter (dry and
ash-free base); FCdaf: fixed carbon (dry and ash-free base); St,daf: total sulfur(dry and ash-free
base); daf: dry and ash-free base.
2.2 Preparation of ACFs
Figure 1 illustrates the synthetic route of the preparation of ACFs for EDLCs. Typically, 0.5g LMC was pressed into a Φ12.9mm tablet at 5Mpa and then foamed in a tube furnace under a flow of N2 to make primary carbon foams. The foaming temperature was controllably ramped at a heating rate
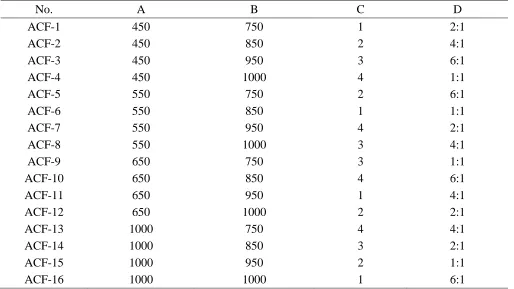
of 5°C min-1 to different final temperatures of 450, 550, 650 and 1000°C, where foaming ensued for 1 hour, and the obtained primary carbon foams were naturally cooled to room temperature. Activation was carried out by impregnating the primary carbon foams with the required amount of KOH (KOH/carbon = 1:1, 2:1, 4:1, 6:1 by mass) before being stirred for 30min and proceeded by heat soaking at 80°C for 4 hours. The mixtures were dried at 105°C for 4 hours before being activated at various temperatures (750, 850, 950 and 1000°C) with a heating rate of 5°C min-1 under nitrogen aeration. Several lengths of activation time were evaluated: 1, 2, 3 and 4 hours. The obtained ACFs were washed until pH=7 with hydrochloric acid and distilled water, then filtered and dried for further study. Based on the L16 (44) orthogonal matrix, effect degrees of foaming temperature, activation
[image:3.596.70.533.662.743.2]temperature, activation time and KOH/carbon mass ratio on electrochemical performances of ACFs were investigated. Orthogonal factor level table and orthogonal experimental design of ACFs are shown in Table 2, Table 3 respectively.
Table 2. Orthogonal factor level table
Level
A B C D
Foaming temperature °C
Activation temperature °C
Activation time h
KOH/carbon mass ratio
1 450 750 1 2:1
2 550 850 2 4:1
3 650 950 3 6:1
4 1000 1000 4 1:1
Table 3. Orthogonal experimental design of ACFs
No. A B C D
ACF-1 450 750 1 2:1
ACF-2 450 850 2 4:1
ACF-3 450 950 3 6:1
ACF-4 450 1000 4 1:1
ACF-5 550 750 2 6:1
ACF-6 550 850 1 1:1
ACF-7 550 950 4 2:1
ACF-8 550 1000 3 4:1
ACF-9 650 750 3 1:1
ACF-10 650 850 4 6:1
ACF-11 650 950 1 4:1
ACF-12 650 1000 2 2:1
ACF-13 1000 750 4 4:1
ACF-14 1000 850 3 2:1
ACF-15 1000 950 2 1:1
ACF-16 1000 1000 1 6:1
2.3 Material characterizations
The element contents of raw coal and LMC were determined using a Vario MICRO cube elemental analyzer (Elementar Corporation, Germany). Surface functional groups of raw coal and LMC were identified with a NICOLET 6700 Fourier transform infrared spectroscopy (FTIR) analyzer (NICOLET Instruments Corporation, USA). Thermogravimetry and differential thermogravimetry (TG-DTG) curves of LMC were collected on a DTA/DSC-TG instrument (NETZSCH Corporation, Germany) with a heating rate of 15°C min-1 for temperature ranging from 25°C to 950°C. The porous properties of optimum ACF were characterized by N2 adsorption/desorption measurement at 77K
respectively. The total pore volume was estimated from the single point adsorption (P/P0 = 0.995). The
micropore volume was reckoned by the calculation from the HK (Horvaih-Kawazoe) model whereas the mesopore volume was obtained through the BJH (Barret-Joyner Halenda) model. Images of SEM were taken by a FEI Quanta TM 250 microscope (FEI Corporation, USA) to observe the surface morphologies of primary carbon foam and optimum ACF. The microstructures of optimum ACF and LMC were analyzed by TEM images with a Tecnai G2 F20 microscope (FEI Corporation, USA). The chemical state of the surface was examined by X-Ray photoelectron spectroscopy (XPS) with an ESCALAB 250Xi X-ray photoelectron spectrometer (Thermo Fisher Scientific, USA) using an Al-Kα X-ray radiation as the excitation source. The carbon structures presented in primary carbon foam and optimum ACF were investigated by a Senterra Raman Spectroscopy (Bruker Corporation, Germany) with an excitation wavelength at 532nm.
2.4 Electrode preparation and electrochemical measurements
The electrochemical performances of ACFs were studied using a two-electrode experimental cell. The working electrode was prepared by pressing a mixture of 85wt % ACFs used as the active material, 10wt % acetylene black used as the conductivity enhancing material and 5wt % poly(tetrafluoroethylene) (PTFE) used as the binder onto a piece of nickel foam at 5Mpa for 5min. Two electrodes with the same mass were selected, polypropylene membrane was placed in the middle of two electrodes and then assembled as EDLC (as shown in Figure 2). The electrolyte was 6M KOH. The CV curves of optimum ACF were recorded from 0 to 1.0V at different scan rates of 10, 20, 60, 100mV s-1 and GCD tests were carried out at various current densities of 0.1, 0.2, 0.5, 1A g-1 between 0 and 1.0V. EIS measurement was conducted at the open circuit potential by applying a 5mV amplitude in frequencies ranging from 100kHz to 10mHz. The electrochemical stability test was performed by repeating the GCD tests at current density of 1A g-1 for 3000 cycles. All electrochemical measurements were operated at room temperature using an Ivium Vertex electrochemical workstation (Ivium Corporation, Holland). The specific capacitance could be calculated as a function of scan rate via eqn (1):
2
1
2 1 ( )
( )
V
V
I V dV C
mv V V
(1)
where C is the specific capacitance in F g-1, I is the instant current in A, m is the mass of active material in g, v is the scan rate in V s-1 and V2, V1 are the potential limits of CV tests.
The specific capacitance can also be calculated from GCD cycling experiments according to the following eqn (2):
2I t
C
m V
(2)
Membrane Electrode
Electrode
Nickel foam Nickel
foam
Wire Wire
Mould Mould
[image:6.596.156.440.75.218.2]Electrolyte
Figure 2. Assembly schematic of EDLC
3. RESULTS AND DISCUSSION
3.1 Physical characterizations of LMC
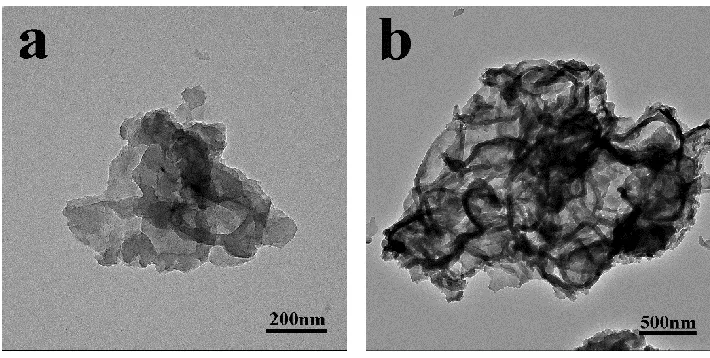
The TEM images of the LMC are displayed in Figure 3a and 3b. It can be seen from Figure 3b that the LMC takes the morphology of agaric-like agglomerate or cluster of nanoscale particulates and the approximate size is about 3µm in length and 2µm in width. While, Figure 3a shows a similar but much smaller crimping structure with a length of around 0.6µm, it is evident that, during the extraction and back-extraction processes, the group compositions of raw coal have been separated and regrouped to different extents.
Figure 3. TEM images of LMC
[image:6.596.120.475.453.632.2]
weight loss rate in the DTG plot centers at around 520°C suggests that LMC is drastically thermal decomposition at this point. When the temperature exceeds 600°C, poly-condensation reactions such as aromatization, cyclization and hydrogenation take place and the continuous high mass loss rate of above 0.6% min-1 in this range is attributed to the releasing of a mass of secondary gas such as H2,
CH4. In addition, an obviously higher retention rate of 62.5% at 950°C than other materials such as
[image:7.596.111.487.212.595.2]coal tar pitches [20], straw [21], banana peel [22], and ginkgo shells [23], also means better yield and greater potential industrial value.
Figure 4. TG/DTG of LMC
4000 3000 2000 1000 0
Wave numbers (cm-1) Raw coal
Loose medium component
Figure 5. FT-IR spectra of raw coal and LMC
[image:7.596.127.478.214.397.2]
vibration of hydroxyl, phenolic groups and the stronger peak intensity indicates that there are more phenols, alcohols and amines compounds in LMC [25-27]. In addition, the reduction of aliphatic compounds in LMC can be proved by the lower peak intensities of characteristic absorption bands at 2858~2951cm-1, 1450cm-1 and 1375cm-1 [28].
[image:8.596.127.469.263.506.2]3.2 Electrochemical properties of ACFs
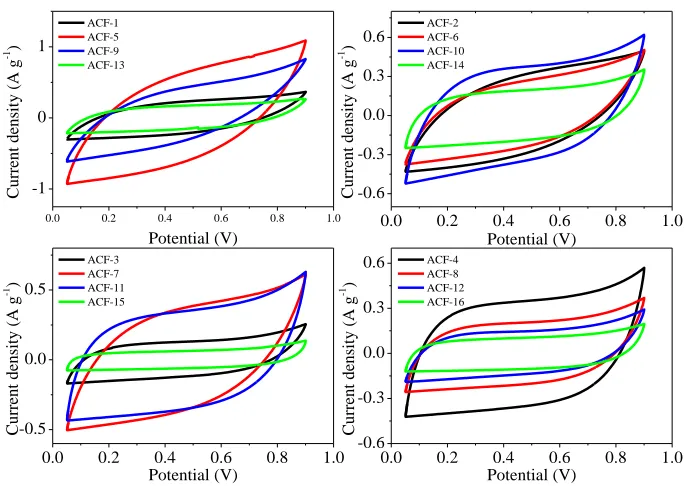
Figure 6 shows the cyclic voltammograms of ACF-1~ACF-16 at a scan rate of 10mV s-1 in the potential range of 0.05 to 0.9V. The specific capacitance values were computed from the CV curves via eqn (1) and summarized in Figure 7.
0.0 0.2 0.4 0.6 0.8 1.0 -1 0 1 ACF-1 ACF-5 ACF-9 ACF-13 Current densit y (A g -1 ) Potential (V)
0.0 0.2 0.4 0.6 0.8 1.0
-0.6 -0.3 0.0 0.3
0.6 ACF-2 ACF-6 ACF-10 ACF-14 Current densit y (A g -1 ) Potential (V)
0.0 0.2 0.4 0.6 0.8 1.0
-0.5 0.0 0.5 ACF-3 ACF-7 ACF-11 ACF-15 Current densit y (A g -1 ) Potential (V)
0.0 0.2 0.4 0.6 0.8 1.0
-0.6 -0.3 0.0 0.3
[image:8.596.175.423.549.732.2]0.6 ACF-4 ACF-8 ACF-12 ACF-16 Current densit y (A g -1 ) Potential (V)
Figure 6. Cyclic voltammograms of ACF-1~ACF-16
AC F-1 AC F-2 AC F-3 AC F-4 AC F-5 AC F-6 AC F-7 AC F-8 AC F-9 AC F-10 AC F-11 AC F-12 AC F-13 AC F-14 AC F-15 AC F-16 0 30 60 90 120 150 180 Sp ecific capacitance ( F g -1 )
3.3 Optimum experimental conditions
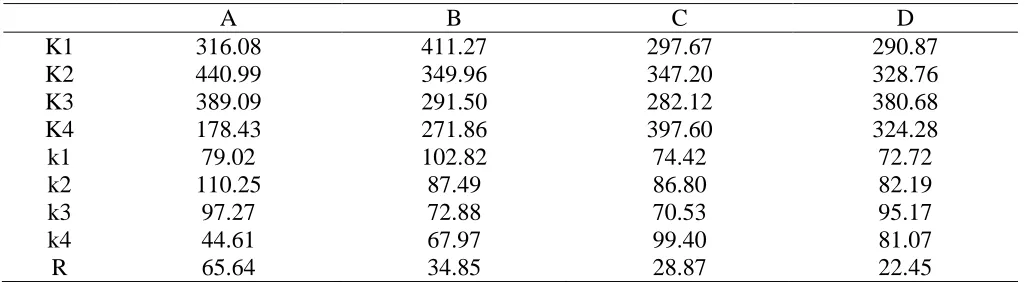
Factors analyses on specific capacitance are summarized in Table 4. The K value for each level of a factor was the sum of four specific capacitance values of ACFs prepared under that factor level in Figure 7 and the k value for each factor level was the average of the corresponding K value. Range (R) was the difference between the maximum and minimum k value of the four levels which also reflected the effect degree of factors on specific capacitance.
Based on the comparative advantage analysis, the major-minor sequence of R is: RA>RB>RC>RD, that is to say, the effects of foaming temperature, activation temperature, activation time and KOH/carbon mass ratio on specific capacitance weaken successively. The results demonstrate that the optimum experimental conditions of preparing high electrochemical performance ACF are foaming temperature 550°C, activation temperature 750°C, activation time 4 hours and KOH/carbon mass ratio 6:1, i.e. A2B1C4D3. Furthermore, the ACF prepared under the above-mentioned optimum
[image:9.596.43.556.356.497.2]experimental conditions was named ACF-0.
Table 4. Factors analyses on specific capacitance
A B C D
K1 316.08 411.27 297.67 290.87
K2 440.99 349.96 347.20 328.76
K3 389.09 291.50 282.12 380.68
K4 178.43 271.86 397.60 324.28
k1 79.02 102.82 74.42 72.72
k2 110.25 87.49 86.80 82.19
k3 97.27 72.88 70.53 95.17
k4 44.61 67.97 99.40 81.07
R 65.64 34.85 28.87 22.45
3.4 Effect of factors level on specific capacitance of ACFs
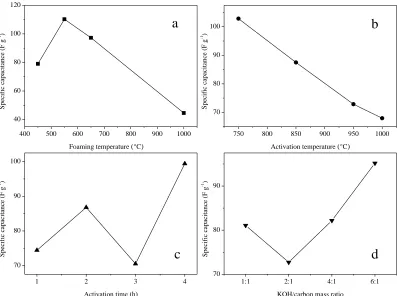
Effect of factors level on specific capacitance of ACFs was analyzed based on the k values in Table 4. As shown in Figure 8a, the capacitance value of ACFs foamed at 550°C is much better than others. By the analyzing of DT/DTG curves in Figure 4, pyrolytic reactions occur severely at 550°C. With the effusion of a mass of pyrolysis gas, the primary carbon foams foamed at 550°C have developed foam structure and provide many active points for activating. In addition, with foaming temperature increasing, the occurrence of poly-condensation reactions and improvement of graphitization degree of primary carbon foams are detrimental to the activation process and finally induce the bad capacitive performance.
decreases sharply with the rise of activation temperature, which agree with the optimal temperature for KOH activation that reported in literatures [29, 30]. In Figure 8c, with the prolonging of activation time, the change trend of specific capacitance is fluctuated, which first increases, then decreases and increases again. It is generally known that macropores act as the ion buffering reservoirs, mesopores serve as the ion transport pathways, while micropores are directly responsible for energy storage. For another, the extension of activation time is conducive to the pores broadening. Thus, the ACFs activated for 4h possess abundant micropores, adequate meso-, and macropores and show the best capacitance behavior. From Figure 8d, we can see that along with the grow of KOH/carbon mass ratio, the specific capacitance decreases at first, increases afterwards and reaches the peak value at the ratio of 6:1. It proves that capacitive behavior is strongly associated with KOH/carbon mass ratio and a relatively high KOH addition could enlarge the openings and further achieve the reasonable PSD.
400 500 600 700 800 900 1000 40 60 80 100 120 S pe cific c apa cit anc e (F g -1)
Foaming temperature (°C)
a
750 800 850 900 950 1000 70 80 90 100
b
S pe cific c apa cit anc e (F g -1)Activation temperature (°C)
1 2 3 4
70 80 90 100 S pe cific c apa cit anc e (F g -1)
Activation time (h)
c
1:1 2:1 4:1 6:1
70 80 90 S pe cific c apa cit anc e (F g -1)
KOH/carbon mass ratio
[image:10.596.99.496.275.571.2]d
Figure 8. Effect of factors level (a) foaming temperature (b) activation temperature (c) activation time (d) KOH/carbon mass ratio on specific capacitance of ACFs
3.5 Physical characterizations of optimum ACF
surface and the presence of abundant pores with the diameter of 1-5nm which also demonstrate the uniform PSD and well-developed microporosity of ACF-0. Apparently, finer porous structure and developed microstructure are favorable to fast charge transfer and large charge storage capacity.
Figure 9. (a) SEM image of primary carbon foam foamed at 550°C; (b) SEM image of ACF-0; (c) TEM image of ACF-0
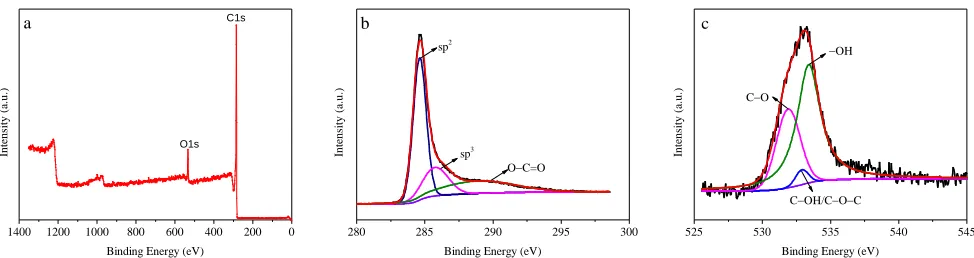
The surface chemical properties of ACF-0 were studied by XPS technique. The XPS wide scan spectrum (Figure 10a) indicates that it mainly composes of C and small amount of O element. The C and O relative contents (atomic) are 92.56% and 7.44%, respectively. As shown in Figure 10b, the C1s spectrum (282-297eV) were readily fitted as three peaks that centered at 284.6, 285.9 and 288.9eV, respectively. In details, the binding energy of 284.6eV originates from sp2 C=C bond of the graphitic carbon [31]. While the peak at 285.9eV represents the sp3 C=C bond that is related to the disordered structure [32], and the peak at 288.9eV ascribes to O–C=O bond [20]. The existence of multiple O forms can also be demonstrated by the deconvolution spectrum of O1s (525-545eV) as shown in Figure 10c. The value of 531.9eV stems from oxygen atoms in the C–O groups in C–OH and/or COOR [33]. The peak at 532.9eV derives from the C–OH and C–O–C bonds [34, 35]. The peak located at 533.4eV is owing to the –OH groups [36]. In conclusion, the XPS characterization reveals the presence of oxygen functional groups on the surface of ACF-0, N and S atoms have not been found in carbon framework.
1400 1200 1000 800 600 400 200 0 280 285 290 295 300 525 530 535 540 545
O1s C1s
Int
ens
it
y
(a
.u.
)
Binding Energy (eV)
a c
OC=O sp3
b
Int
ens
it
y
(a
.u.
)
Binding Energy (eV) sp2
OH
CO
COH/COC
Int
ens
it
y
(a
.u.
)
[image:11.596.88.513.138.276.2]Binding Energy (eV)
[image:11.596.57.544.588.717.2]
To further study the graphitic character, the primary carbon foam foamed at 550°C and ACF-0 were characterized by Raman spectroscopy. As shown in Figure 11, both of the two recorded spectra show three Raman-active bands at around 1330-1340 (D-band), 1585-1595 (G-band) and 2690-2695cm-1 (2D-band). The D-band is associated with a double-resonance effect of disordered carbonaceous structure and the G-band corresponds to the ordered graphite in-plane vibrations with E2g
symmetry [37, 38]. The 2D peak is the second order of the D peak induced by the double resonant Raman scattering with two-phonon emissions which is sensitive to the stacking order of the graphene sheets along the c-axis [39]. As expected, the value of ID/IG improves slightly from 0.83 for primary
carbon foam to 0.90 for ACF-0, suggesting the presence of abundant defects upon KOH activation of primary carbon foam [40], which is also in accordance with the TEM observation. The partially graphitic porous structure with developed hierarchical pores and well connectivity is expected to improve electrochemical behaviors of ACFs [41, 42].
500 1000 1500 2000 2500 3000 3500 4000 2D band
G band
0.83
Int
ensi
ty (
a.u.)
Raman shift (cm-1) ACF-0
Primary carbon foam
[image:12.596.188.407.297.465.2]0.90 D band
Figure 11. Raman spectra of primary carbon foam foamed at 550°C and ACF-0
3.6 Pore structure of optimum ACF
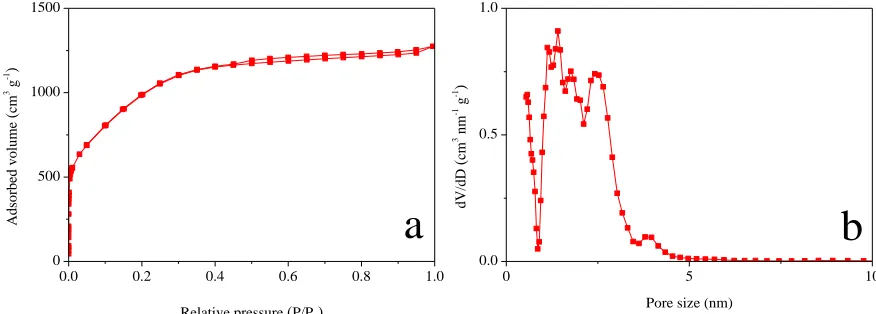
The N2 adsorption/desorption isotherm of ACF-0 is displayed in Figure 12a and reveals a
combined characteristic of type I and type IV with a H4-type hysteresis loop, indicating the coexistence of pores with different sizes. It is worth noting that the nitrogen adsorption increases significantly at a very low relative pressure implying the well-developed microporosity. Besides, it also presents a gradual increase of sorption capacity and a modest hysteresis loop at 0.4<P/P0<0.9
which assign to the capillary condensation in small-sized mesopores (smaller than 5nm). In addition, the absence of abrupt increase in adsorbed volume at P/P0 approaching to 1.0 illustrates that there is
From the multiple-peaked PSD shown in Figure 12b, we can find that, the micropores range from 0.6 to 1.7nm are in the majority. Besides, PSD curve also shows two peaks centered at 2.4 and 4nm indicating the existence of many small mesopores with the diameter of 2.4-4nm. These findings consist with the TEM results. It has already been demonstrated that the narrow PSD favors ion selectivity and effective accommodation of charge carriers [43, 44], while mesopores provide favorable paths for the fast ion transfer [45]. Hence, the ACF-0 with high SSA, narrow PSD and coexistence of micropores and small mesopores could be a promising electrode material for EDLCs.
0.0 0.2 0.4 0.6 0.8 1.0 0
500 1000 1500
Adsor
be
d volume
(
cm
3 g -1)
Relative pressure (P/P0)
a
0 5 10
0.0 0.5 1.0
b
dV/dD
(
cm
3 nm -1 g -1 )
[image:13.596.79.517.213.370.2]Pore size (nm)
Figure 12. (a) N2 adsorption/desorption isotherm and (b) PSD of ACF-0
Table 5. Pore structure parameters of ACF-0
No. SBET (m2 g-1) Vt (cm3 g-1) Vmic (cm3 g-1) Vmes (cm3 g-1) Vmic/Vt (%) Vmes/Vt (%)
ACF-0 3526.31 1.972 1.400 0.304 71 15.4
3.7 Electrochemical characterizations of optimum ACF
0.0 0.2 0.4 0.6 0.8 1.0
-4 -3 -2 -1 0 1 2 3 4
0 1 2 3 4 5 6
0.0 0.5 1.0
Curr
ent density(A
g
-1 )
Potential (V) 10mV s-1
20mV s-1
60mV s-1
100mV s-1
a
P
otential (
V)
Time (ks)
0.1 A g-1
0.2 A g-1
0.5 A g-1
1 A g-1
[image:14.596.88.512.75.215.2]b
Figure 13. (a) CV curves at different scan rates and (b) GCDs at different current densities
The capacitance values at increasing current loads (from 0.1A g-1 to 1A g-1) were calculated from GCD curves via eqn (2) and plotted in Figure 14. As we can see, the ACF-0 electrode shows a high specific capacitance of 311.82F g-1 at current density of 0.1A g-1, which is comparable to the reported results [20, 47]. Moreover, we can discover that the capacitance value decreases with the increase of current density, which is 270.08F g-1 at 0.2A g-1, 234.93F g-1 at 0.5A g-1 and 204.17F g-1 at 1A g-1 respectively. That is because, at a high current density, the diffusion of ions in electrolyte can’t match to the charge transfer which results in a lessened capacitance [37, 40]. Interestingly, ACF-0 presents a much superior capacity retention to that previously reported porous carbon materials [48-51], which retains 204.17F g-1 at a high current density of 1A g-1 in 6M KOH, 65% of that measured at 0.1A g-1. Such excellent rate capability could be ascribed to the hierarchical porous structure, which offers the large surface area and fast charge transfer paths.
0.0 0.5 1.0
0 50 100 150 200 250 300
Specif
ic c
apaci
tanc
e (F g
-1)
Current density (A g-1
)
Figure 14. Variation of specific capacitance at different current density
[image:14.596.212.385.477.602.2]
near to zero. The uncompleted semicircle part in high frequency area reveals the charge transfer resistance results from the charge transport at electrode/electrolyte interface. A 45° diagonal line located at the medium zone is called Warburg impedance, implying the resistance induced by the diffusion of ions into the inside of carbon network. The relatively short Warburg slope and low charge transfer resistance mean that the ions diffuse fast in the electrode. The nearly virtual line signifies typically ideal electric double layer capacitive features. The phase Bode plot (Figure 15b) also shows that the phase angle is 79° for ACF-0 which is close to 90° for ideal capacitors at lower frequency limitation, further evidencing the good capacitive property of ACF-0 electrode.
0 20 40
0 20 40 60 80
-2 0 2 4
-20 0 20 40 60 80
0 2 4 6 8 10 0
2 4 6 8
b
-Z" / ohm
Z' / ohm
a
-P
ha
se
log Freq
-Z"
/
ohm
Z' / ohm
Figure 15. (a) Nyquist plot (the inset shows the magnified view of the high-frequency region) (b) phase Bode plot of ACF-0
The long-term cycling stability is also an important factor for electrode materials in energy storage application. Figure 16 shows the cycling stability of ACF-0 electrode at current density of 1A g-1 over 3000 cycles. As shown in the inset of Figure 16, the charge/discharge curves still remain triangular shape after 3000 cycles. The specific capacitance slightly decreases from 196 to 191.88F g-1 (~97.9% of the initial capacitance) which demonstrates that ACF-0 displays a good cycling and stability behavior as the EDLCs electrode material.
0 500 1000 1500 2000 2500 3000 0
50 100 150 200
0 200 400 600 800 1000 1200 0.0
0.2 0.4 0.6 0.8 1.0
Specif
ic c
apaci
tanc
e F g
-1
Cycle
P
otent
ial (
V)
[image:15.596.114.485.227.365.2]Time (s)
[image:15.596.193.403.557.719.2]
4. CONCLUSION
In this study, the activated carbon foams were prepared by a simple foaming-activation process of LMC which was separated from raw coal and used for electrode material for EDLCs. Synthesis parameters, such as foaming temperature, activation temperature, activation time and KOH/carbon mass ratio were found to significantly affect the electrochemical properties of the ACFs. ACF-0 prepared under the optimum experimental conditions: foaming temperature 550°C, activation temperature 750°C, activation time 4h and KOH/carbon mass ratio 6:1, displayed excellent capacitive performance due to the synergistic effects of high specific surface area (3526m2 g-1), favorable pore size distribution, finer microporosity and well-developed porous structure. The ACF-0 achieved the highest specific capacitance of 311.82 F g-1 at current density of 0.1A g-1 in 6M KOH electrolyte and showed an excellent cycle life (capacitance retention of ~97.9% after 3000 cycles at 1A g-1). With the results presented here, the excellent cyclic stability, great capacitive behavior, inexpensive and readily available precursor as well as unique porous structure make activated carbon foams extremely attractive for EDLCs application.
ACKNOWLEDGEMENT
This work was supported by National Natural Science Foundation of China (No.51274201, 51674260) and the Specialized Research Fund for the Doctoral Program of Higher Education of China (No.20130095110006).
References
1. J. Miller, P. Simon, Science, 321 (2008) 651.
2. Y. Fu, X. Cai, H. Wu, Z. Lv, S. Hou, M. Peng, X. Yu and D. Zou, Adv. Mater., 24 (2012) 5713. 3. Z. Li, Z. Xu, H. Wang, J. Ding, B. Zahiri, C. Holt, X. Tan and D. Mitlin, Enery. Environ. Sci., 7
(2014) 1708.
4. D. Futaba, K. Hata, T. Yamada, T. Hiraoka, Y. Hayamizu, Y. Kakudate, O. Tanaike, H. Hatori, M. Yumura and S. Iijima, Nature Mater., 5 (2006) 987.
5. P. Simon, Y. Gogotsi, Nature Mater., 7 (2008) 845.
6. J. Yan, Z. Fan, W. Sun, G. Ning, T. Wei, Q. Zhang, R. Zhang, L. Zhi and F. Wei, Adv. Funct. Mater., 22 (2012) 2632.
7. L. Zhang, X. Zhao, Chem. Soc. Rev., 38 (2009) 2520.
8. S. Bose, T. Kuila, A. Mishra, R. Rajasekar, N. Kim and J. Lee, J. Mater. Chem., 22 (2012) 767. 9. M. Sevilla, R. Mokaya, Enery. Environ. Sci., 7 (2014) 1250.
10.M. Beidaghi, Y. Gogotsi, Enery. Environ. Sci., 7 (2014) 867.
11.C. Largeot, C. Portet, J. Chmiola, P. Taberna, Y. Gogotsi and P. Simon, J. Amer. Chem. Soc., 130 (2008) 2730.
12.C. Vix-Guterl, E. Frackowiak, K. Jurewicz, M. Friebe, J. Parmentier and F. Béguin, Carbon, 43 (2005) 1293.
13.J. Chmiola, G. Yushin, Y. Gogotsi, C. Portet, P. Simon and P. Taberna, Science, 313 (2006) 1760. 14.F. Moglie, D. Micheli, S. Laurenzi, M. Marchetti and V. Primiani, Carbon, 50 (2012) 1972. 15.C. Chen, E. Kennel, A. Stiller, P. Stansberry and J. Zondlo, Carbon, 44 (2006) 1535. 16.R. Narasimman, K. Prabhakaran, Carbon, 50 (2012) 5583.
18.A. Pandolfo, A. Hollenkamp, J. Power Sources, 157 (2006) 11.
19.Z. Qin, C. Hou, J. Chen, L. Zhang and J. Ma, Int. J. Min. Sci. Tech., 19 (2009) 636. 20.C. Zhong, S. Gong, L. Jin, P. Li and Q. Cao, Mater. Lett., 156 (2015) 1.
21.X. Li, C. Han, X. Chen, C. Shi, Microporous Mesoporous Mater., 131 (2010) 303.
22.Y. Lv, L. Gan, M. Liu, W. Xiong, Z. Xu, D. Zhu and D. Wright, J. Power Sources, 209 (2012) 152. 23.L. Jiang, J. Yan, L. Hao, R. Xue, G. Sun and B. Yi, Carbon, 56 (2013) 146.
24.R. Baccar, J. Bouzid, M. Feki, A. Montiel, J. Hazard. Mater., 162 (2009) 1522. 25.X. He, Y. Geng, J. Qiu, M. Zheng, S. Long and X. Zhang, Carbon, 48 (2010) 1662. 26.M. Elizalde-González, V. Hernández-Montoya, Biochem. Eng. J., 36 (2007) 230. 27.A. Yuan, X. Wang, Y. Wang, J. Hu, Energy Convers. Manage., 51 (2010) 2588.
28.M. Olivares-Marín, C. Fernández-González, A. Macías-García, V. Gómez-Serrano, Appl. Surf. Sci., 252 (2006) 5980.
29.V. Barranco, M. Lillo-Rodenas, A. Linares-Solano, A. Oya, F. Pico, J. Ibañez, F. Agullo-Rueda, J. Amarilla and J. Rojo, J. Phys. Chem. C, 114 (2010) 10302.
30.T. Shang, X. Cai, X. Jin, Rsc Adv., 5 (2015) 16433.
31.G. Chen, W. Zhai, Z. Wang, J. Yu, F. Wang, Y. Zhao and G. Li, Mater. Res. Bull., 72 (2015) 204. 32.B. Chang, Y. Guo, Y. Li, H. Yin, S. Zhang, B. Yang and X. Dong, J. Mater. Chem. A, 3 (2015)
9565.
33.B. Gao, P. Yap, T. Lim, T. Lim, Chem. Eng. J., 171 (2011) 1098.
34.C. Ma, Y. Song, J. Shi, D. Zhang, Q. Guo and L. Liu, J. Colloid. Interf. Sci., 395 (2013) 217. 35.X. Chen, C. Chen, Z. Zhang, D. Xie, J. Mater. Chem. A, 1 (2013) 14919.
36.C. Chen, Q. Zhang, M. Yang, C. Huang, Y. Yang and M. Wang, Carbon, 50 (2012) 3572. 37.D. Wang, F. Li, M. Liu, G. Lu and H. Cheng, Angew. Chem. Int. Ed., 47 (2008) 373. 38.Y. Zhai, Y. Dou, X. Liu, S. Park, C. Ha and D. Zhao, Carbon, 49 (2011) 545.
39.M. Pimenta, G. Dresselhaus, M. Dresselhaus, L. Cancado, A. Jorio and R. Saito, Phys. Chem. Chem. Phys, 9 (2007) 1276.
40.Z. Wang, X. Zhang, X. Liu, M. Lv, K. Yang and J. Meng, Carbon, 49 (2011) 161.
41.H. Wang, Z. Xu, A. Kohandehghan, Z. Li, K. Cui, X. Tan, T. Stephenson, C. King'ondu, C. Holt, B. Olsen, J. Tak, D. Harfield, A. Anyia and D. Mitlin, ACS Nano, 7 (2013) 5131.
42.H. Wang, D. Zhang, T. Yan, X. Wen, J. Zhang, L. Shi and Q. Zhong, J. Mater. Chem. A, 1 (2013) 11778.
43.B. Kim, K. Yang, Electrochim. Acta, 88 (2013) 597.
44.F. Li, N. Laak, S. Ting, K. Chan, Electrochim. Acta, 55 (2010) 2817.
45.Z. Li, Z. Xu, X. Tan, H. Wang, C. Holt, T. Stephenson, B. Olsen and D. Mitlin, Enery. Environ. Sci., 6 (2013) 871.
46.T. Liu, E. Liu, R. Ding, Z. Luo, T. Hu and Z. Li, Electrochim. Acta, 173 (2015) 50. 47.L. Wang, R. Wang, H. Zhao, L. Liu and D. Jia, Mater. Lett., 149 (2015) 85.
48.Z. Zhao, S. Hao, P. Hao, Y. Sang, A. Manivannan, N. Wu and H. Liu, J. Mater. Chem. A, 3 (2015) 15049.
49.Y. Song, S. Hu, X. Dong, Y. Wang, C. Wang and Y. Xia, Electrochim. Acta, 146 (2014) 485. 50.J. Jiang, L. Bao, Y. Qiang, Y. Xiong, J. Chen, S. Gu and J. Chen, Electrochim. Acta, 158 (2015)
236.
51.J. Zhou, Z. Zhang, W. Xing, J. Yu, G. Han, W. Si and S. Zhuo, Electrochim. Acta, 153 (2015) 68. 52.M. Toupin, D. Bélanger, I. Hill, D. Quinn, J. Power Sources, 140 (2005) 203.
53.K. Xie, X. Qin, X. Wang, Y. Wang, H. Tao, Q. Wu, L. Yang and Z. Hu, Adv. Mater., 24 (2012) 347.