Int. J. Electrochem. Sci., 14 (2019) 2757 – 2766, doi: 10.20964/2019.03.74
International Journal of
ELECTROCHEMICAL
SCIENCE
www.electrochemsci.org
Resonant Change in Element Contents and Crystal Structure
Change in Co
–
Ni
–
Fe Thin Films Electrodeposited Using
Rectangular Pulse Current over Megahertz Frequency Range
M. Saitou
University of the Ryukyus, Department of Mechanical Systems Engineering, 1 Senbaru Nishihara-cho Okinawa, 903-0213, Japan.
*E-mail: [email protected]
Received: 9 November 2018 / Accepted: 14 December 2018 / Published: 7 February 2019
Co–Ni–Fe thin films electrodeposited by a rectangular pulse current technique within a frequency range from 0.1 to 1.2 MHz were investigated using energy dispersive X-ray microscopy and X-ray diffraction. The Fe, Ni, and Co contents in the Co–Ni–Fe films rapidly increased at resonant frequencies. The number of resonant frequencies was odd, and was explained by an energy-level transition. With an increase in the Fe content, the crystal structures of the Co–Ni–Fe thin films changed from the hexagonal closed-packed (HCP) crystal structure, to an amorphous structure, and further to the body-centered cubic (BCC) crystal structure.
Keywords: Co–Ni–Fe thin film; Resonant frequency; Energy level transition; HCP; Amorphous structure; BCC
1. INTRODUCTION
Co–Ni–Fe thin films have been extensively studied owing to their high magnetic saturation [1] and low coercivity strength [2]. Electrodeposition has advantages over vacuum processes such as sputtering for the synthesis of Co–Ni–Fe films because of its low cost and the opportunity it provides to choose deposit structures and compositions easily [3–6]. The effects of electrochemical parameters such as pH, deposition temperature, solution compositions, additives, and current density on magnetic properties of Co–Ni–Fe electrodeposits, which were definitely related to their crystalline structures, were investigated.
value approximately equal to the theoretical magnetic saturation. Nanoparticles of Co–Ni–Fe electrodeposits exhibited a lower coercivity strength depending on their particle size.
Crystallographic structures of Co–Ni–Fe thin films also determine magnetic properties. For example, from a magnetic viewpoint, the hexagonal closed-packed (HCP) crystal structure provides an effect equivalent to uniaxial magnetic anisotropy and plays an essential role in the magnetic saturation and coercivity [7]. A relationship between compositions of Co–Ni–Fe thin films and their crystallographic structures was investigated [13–17]. In most cases, the crystallographic structures of Co–Ni–Fe materials were the face-centered cubic (FCC) crystal structure and the body-centered cubic (BCC) crystal structure, which had a smaller magnetic anisotropy. In this study, we report that Co–Ni– Fe thin films had the HCP crystal structure, an amorphous structure, and the BCC crystal structure.
In the synthesis of Co–Ni–Fe thin films, an anomalous co-deposition of Co, Ni, and Fe has been reported [18–19]. It has been said that metal elements should be preferentially electrodeposited in the order of Fe ions, Co ions, and Ni ions because their standard reduction potentials are Fe2+, Co2+, and Ni2+ in ascending order of value. When less noble metals were preferentially electrodeposited, it was called an anomalous co-deposition. However, electrodeposition is a non-equilibrium phenomena different from physics in a thermal equilibrium. We exhibited that in Ni–Co electrodeposition, where the Co content in Ni–Co thin films definitely increased at a resonant frequency [20] in comparison with the Ni content. In this study, we report a change in the order of the elements preferentially electrodeposited at a resonant frequency within the frequency range from 0.1 to 1.2 MHz.
The aims of the present study are to show a rapid increase in the Co, Ni, and Fe content in Co– Ni–Fe thin films at resonant frequencies, as well as a change in their crystallographic structures from the HCP crystal structure, to an amorphous structure. and further to the BCC crystal structure with increasing Fe content.
2. EXPERIMENTAL SETUP
Copper plates of 30 ×10 mm2 and a carbon plate of 50 × 40 mm2 were used for the cathode and the anode. One side of the copper plate was electrically insulated to avoid the formation of Co–Ni–Fe electrodeposits on the both sides. Three aqueous solutions were prepared consisting of the following chemical compounds: solution A, 0.053mol/L FeSO4·7H2O, 0.638mol/LNiSO4·6H2O, 0.236 mol/L
CoSO4·7H2O, and 0.65 mol/L KNaC4H4O6·4H2O; solution B, 0.106 mol/LFeSO4·7H2O, 0.638 mol/L
NiSO4·6H2O, 0.236 mol·L-1 CoSO4·7H2O, and 0.65 mol·L-1 KNaC4H4O6·4H2O; and solution C, 0.212
mol/L FeSO4·7H2O, 0.638 mol/L NiSO4·6H2O, 0.236 mol/L CoSO4·7H2O, and 0.65 mol/L
KNaC4H4O6·4H2O.
The cathode and anode were placed parallel to each other in a cell filled with aqueous solution A, B, or C, which was maintained at a temperature of 303 K during electrodeposition.
[image:3.596.117.459.105.423.2]
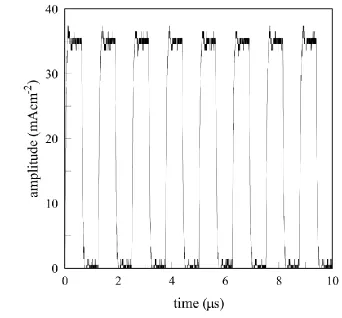
frequency under 80 MHz. Figure 1 shows a typical rectangular pulse current with an amplitude of 35 mA/cm2 and a frequency of 0.8 MHz.
Figure 1. Rectangular pulse current with an amplitude of 35 mA/cm2 and a frequency of 0.8 MHz.
After the electrodeposition, the Co–Ni–Fe thin films electrodeposited on the copper plate were rinsed with distilled water. They were weighted to the precision of 0.1 mg with an electric balance to determine the film thicknesses.
The element contents in the Co–Ni–Fe thin films on the copper plate were investigated using energy dispersive X-ray spectroscopy (EDX: Shimazu EDX-800). The crystallographic structures of the Co–Ni–Fe thin films were determined using X-ray diffraction (XRD: Rigaku Ultima) with CuKα radiation.
3. RESULTS AND DISCUSSION
3.1. Co–Ni–Fe thin films electrodeposited in solution A
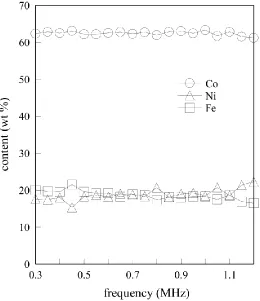
Figure 2. Frequency-dependence of the element contents in Co–Ni–Fe thin films electrodeposited in the solution A.
The Ni content changed within a range from 17 to 22 wt % and had the mean value of 18.8 wt %. Similarly, the Fe content changed within a range from 17 to 22 wt % and had the mean value of 18.6 wt %. The changes in the element contents were small, however, all the element contents changed with the frequency. In a thermal equilibrium, the standard reduction potentials ∆E of Fe2+, Ni2+, and Co2+ are
–0.44, –0.277 and –0.257 V [21], respectively. When the applied potential is zero, according to the free energy ∆𝐺𝑜= −𝑛𝐹∆𝐸 where n is the valence number and F is the Faraday constant, the frequency νo at
which an electron transfers from an electrode to an ion in a solution is expressed as [22]
𝜈𝑜= 𝑘𝐵𝑇
ℎ 𝑒 −Δ𝐺𝑜𝑅𝑇,
(1)
where kB is Boltzmann’s constant, T is the absolute temperature, h is Planck’s constant, and R is
the gas constant. According to Eq. (1), the order of the element preferentially crystallized from an ion to an atom is said to be Co, Ni, and Fe. If the Fe content in a thin film electrodeposited in a solution containing Co2+ and Fe2+ is larger than the Co content, the electrodeposition is said to be anomalous. However, the standard reduction potential does not become a criterion in preferential electrodeposition because ∆G0 > 0 for Fe2+, Ni2+, and Co2+ions.
Within a framework of an energy level transition [20], an electron that exists at the Fermi level in a cathode gains an energy Eg in the electric field when the electron passes through the electric double
layer to which the megahertz frequency electric field is applied. When a difference between the energy Ec of the complex ion in a solution and the Fermi energy EF of the electron is equal to the gained energy
[image:4.596.167.427.76.377.2]
thought to be proportional to the complex content, Cc comprising the element ion and tartaric ion in a
solution. By analogy with Eq. (1), the element content Ce in Co–Ni–Fe thin films is given by
𝐶𝑒 ∝ 𝐶𝑐𝑘𝐵𝑇
ℎ 𝑒
∆𝜇𝑐
𝑘𝐵𝑇, (2)
where the energy difference, ∆𝜇𝑐 = 𝐸𝑐− 𝐸𝐹. Figure 2 shows that according to Eq. (2), an absolute difference between Eg and ∆𝜇𝑐 for Co2+, Fe2+, and Ni2+ is large in ascending order of value.
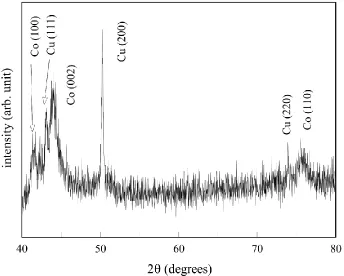
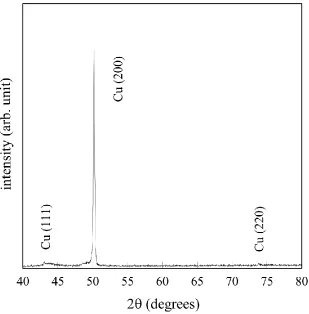
Figure 3 shows an XRD pattern of the Co–Ni–Fe thin film electrodeposited at 0.85 MHz. According to the EDX analysis, the thin film contained 62.9 wt % Co, 19.0 wt % Ni, and 18.1 wt % Fe. Three diffraction peaks were indexed as crystallographic planes of Co polycrystals. This means that Ni and Fe atoms were solid-soluted into the HCP lattice points of Co. Hence, the Co–Ni–Fe thin films will show uniaxial magnetic anisotropy.
Figure 3. XRD charts of the Co–Ni–Fe thin film electrodeposited in solution A at a frequency of 0.85 MHz. The Co, Ni, and Fe contents were 62.9, 19.0, and 18.1 wt %, respectively.
These peaks, which were obtained from a 12.1 μm thick Ni–Co–Fe film, were very weak and broad in width. We estimated the mean grain size, d using the Scherrer equation [23], 𝑑 = 𝐾𝜆/𝛽𝑐𝑜𝑠𝜃𝐵,
where K is the shape factor, λ is the X-ray wavelength, and β is the line broadening at the Bragg diffraction angle θB. We obtained the mean grain size of 9.9 nm from the diffraction peaks (002) of
[image:5.596.126.470.267.543.2]
3.2. Ni–Co–Fe thin films electrodeposited in solution B
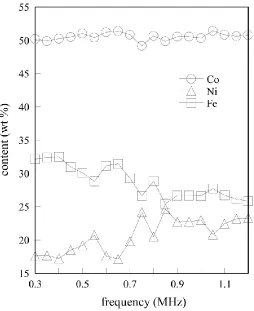
Figure 4 shows the dependence of the element contents in Co–Ni–Fe thin films on the frequency. In comparison with solution A, solution B contained a higher content of Fe ions. As a result, the Fe content in the Co–Ni–Fe thin films increased and decreased the Co content. The Ni content changed within a range from 17 to 25 wt %, which was approximately in the same range as that in solution A. The Co content changed within a range from 49 to 51 wt %, which was a smaller value than that electrodeposited in solution A. The Fe content in the Co–Ni–Fe thin films changed within a range from 25 to 32 wt %. We could not determine the resonant frequencies because the Fe content changed in a narrow range. For example, the Fe content had a local maximum value at 0.8 MHz, but the frequency was not clearly a resonant frequency.
Figure 5 shows an XRD pattern of the Co–Ni–Fe thin film electrodeposited at 0.85 MHz. The Co–Ni–Fe thin film contained 49.8 wt % Co, 24.7 wt % Ni, and 25.5 wt % Fe. There was no diffraction peak except for diffraction peaks from the Cu plate. As is well known, the crystal structures of Co, Ni, and Fe are HCP, FCC, and BCC at room temperature, respectively. The rule of what crystal structure the Co–Ni–Fe thin film seems to be very simple. For example, if the Co content in Co–Ni–Fe thin films is significantly high, the HCP crystal structure is chosen.
[image:6.596.171.425.370.681.2]
Figure 5. XRD charts of the Co–Ni–Fe thin film electrodeposited in solution B at a frequency of 0.85 MHz. The Co, Ni, and Fe contents were 49.9, 24.6, and 25.5 wt %, respectively.
The XRD pattern in Fig. 5 shows that an amorphous structure was stable in the region of the Co, Ni, and Fe content, that is, the free energy of the amorphous structure was lower than that of HCP, BCC, and FCC. The amorphous Co–Ni–Fe thin films may have lower magnetic losses and higher electrical resistivity [24].
3.3. Co–Ni–Fe thin films electrodeposited in solution C
MHz and the Co content had one maximum value at 0.45 MHz. Thus, the number of resonant frequencies was odd irrespective of the elements.
[image:8.596.173.429.124.388.2]Figure 6. Frequency-dependence of the element content in Co–Ni–Fe thin films electrodeposited in the solution C.
[image:8.596.150.450.452.722.2]
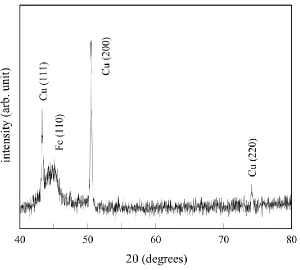
Figure 7 shows an XRD pattern of the Co–Ni–Fe thin film electrodeposited at 0.65 MHz. The Co–Ni–Fe thin film contained 35.8 wt % Co, 10.5 wt % Ni, and 53.7 wt % Fe. One diffraction peak was indexed as a crystallographic plane of the BCC crystal structure of Fe. The peak, which was obtained from a 14.2 μm thick Co–Ni–Fe film, was very weak and broad in width. Estimating the mean grain size d using the Scherrer equation, we obtained the mean grain size of 5.6 nm from the diffraction peaks (110) of Figure 7. The high content of Fe seemed to determine the crystal structure of the Co–Ni–Fe thin film as BCC. All the grains had grown in the direction of <110>.
In summary, the contents in the Co–Ni–Fe thin films changed with the frequency irrespective of the solution used. Of particular note, the contents in the Co–Ni–Fe thin films electrodeposited in solution C appreciably showed electrodeposition resonance. With increasing the Fe content, the Co–Ni–Fe thin films electrodeposited in solution A, B, and C had the HCP crystal structure, the amorphous structure, and the BCC crystal structure, respectively.
4. CONCLUSIONS
The Fe, Ni and Co contents in the Co–Ni–Fe thin films formed by the rectangular pulse current over the megahertz frequency range showed maximum values at resonant frequencies. The number of resonant frequencies was odd irrespective of the elements, and was explained by the energy level transition. With an increase in the Fe content, the crystal structure of the Co–Ni–Fe thin films changed from the HCP crystal structure, to the amorphous structure, and further to the BCC crystal structure.
References
1. T. Osaka, M. Takai, K. Ohashi, M. Saito, and K. Yamada, Nature, 392 (1998) 796.
2. G. V. Kurlyandskaya, J. M. Barandiarán, J. L. Muñoz, J. Gutiérrez, M. Vázquez, D. Garcia, and V. O. Vas’kovskiy, J. Appl. Phys., 87 (2000) 4822.
3. A. Csik, K. Vad, E. Tóth-Kádár, and L. Péter, Electrochem. Commun., 11 (2009) 1289. 4. F. E. Atalay, H. Kaya, and S. Atalay, Physica B, 371 (2006) 327.
5. X. Liu and G. Zangari, J. Appl. Phys., 87 (2000) 5410.
6. M. Bahgat, M-K. Paek, and J-J. Pak, J. Alloys Compd., 466 (2008) 59. 7. F. Noori, A. Ramazani, and M. A. Kashi, J. Alloys Compd., 756 (2018) 193.
8. S. Samanifar, M. A. Kashi, A. Ramazani, and M. Alikhani, J. Magn. Magn. Mater., 378 (2015) 73. 9. S. Samanifara, M. A. Kashi, and A. Ramazania, Physica C, 548 (2018) 72.
10.S. B. Dalavi, J. Theerthagiri, M. M. Raja, and R. N. Panda, J. Magn. Magn. Materi., 344 (2013) 30. 11.X. Geng and E. J. Podlaha, Nano Lett., 16 (2016) 7439.
12.K. Chokprasombat, S. Pinitsoontorn, and S. Maensiri, J. Magn. Magn. Mater., 405 (2016) 174. 13.N. G. Valko and V. G. Hurtavy, Phys. Solid State, 55 (2013) 2196.
14.H. Raanaei, H. Eskandari, and V. M-Hosseini, J. Magn. Magn. Mater., 398(2016)190.
15.T. Pikulaa, L. Kubalovab, D. Oleszakc, J.K. Zurawicza, and E. Jartycha, J. Alloys Compd., 483 (2009) 582.
17.E. Jartych, J. Magn. Magn. Mater., 323 (2011) 209.
18.I. Hanafi, A. R. Daud, and S. Radiman, Por. Electrochim. Acta, 35 (2017) 1. 19.Y. Yang, Int. J. Electrochem. Sci., 10 (2015) 5164.
20.M. Saitou, Int. J. Electrochem. Sci., 13 (2018) 305.
21.D. R. Lide, CRC Handbook of Chemistry and Physics, CRC Press (1998), New York, USA. 22.R. K. Pandey, S. N. Sahu, and S. Chandra, Handbook of Semiconductor Electrodeposition (1996),
Marcel Dekker, New York, USA.
23.J. I. Langford and A. J. C. Wilson, J. Appl. Crys., 11 (1978) 102. 24.L. Karimi and H. Shokrollahi, J. Alloys Compd., 509 (2011) 6571. 25.A. V. Phelps, Rev. Mod. Phys., 40 (1968) 399.