The S-Cycle Performance Matrix: Supporting
Comprehensive Sustainability Performance
Evaluation of Technical Systems
L. Hay,
∗A. H. B. Duffy, and R. I. Whitfield
Department of Design, Manufacture and Engineering Management, University of Strathclyde, James Weir Building, 75 Montrose Street, Glasgow G1 1XJ, UK
Received 7 October 2015; Revised 4 March 2017; Accepted 2 April 2017, after one or more revisions Published online in Wiley Online Library (wileyonlinelibrary.com).
DOI 10.1002/sys.21378
ABSTRACT
In this paper, we present the first generic framework for selecting comprehensive material/energetic sustainability performance indicators (SPIs) for technical systems: the S-Cycle Performance Matrix (S-CPMatrix). This novel matrix is comprised of 6 generic sustainability goals, 11 SPI archetypes, and 23 corresponding metrics identified from our previously developed model of technical system sustainabil-ity (the S-Cycle), and is intended to support decision makers in meeting three identified criteria for comprehensive SPI sets: (C1) inclusion of indicators measuring performance at all relevant scales; (C2) inclusion of efficiency and effectiveness indicators; and (C3) coverage of all system sustainability goals. We evaluated the matrix by interpreting and classifying 324 indicators currently applied to assess technical system sustainability performance in the literature, with 94.1% found to be fully classifiable with respect to the proposed goals and SPI archetypes following several refinements. The matrix is applicable to different systems, and may be considered to facilitate the selection of a holistic set of SPIs from different sources and evaluation approaches. Thus, it addresses a need for consistent yet flexible guidance on how to comprehensively assess technical system sustainability performance, mirroring generic guidelines on organizational SPI selection widely available through several international initiatives. In addition to industrial evaluation of the S-CPMatrix, four avenues for future research are proposed: (i) use of the matrix for systems comparison/benchmarking; (ii) further investigation of unsupported metrics; (iii) the nature and measurement of contaminants; and (iv) assessing the comprehensiveness of current SPI sets for technical systems. C⃝ 2017 The Authors. Systems Engineering Published by Wiley Periodicals, Inc. Syst Eng 00: 1–26, 2017
Key words: enterprise & environment; measurement; sustainability; sustainability assessment; sustain-ability performance indicators
∗Author to whom all correspondence should be addressed (e-mail: [email protected]).
This is an open access article under the terms of the Creative Commons Attribution License, which permits use, distribution and reproduction in any medium, provided the original work is properly cited.
Systems Engineering Vol. 00, No. 0, 2017
C⃝ 2017 The Authors. Systems Engineering Published by Wiley Periodicals, Inc.
1. INTRODUCTION
and energetic inputs originate in natural systems, whilst the waste that is typically produced alongside intended outputs is ultimately mitigated by natural processes [Meadows, 1998; United Nations Environment Programme, 2012]. Acknowl-edging this relationship with the natural world, Hubka and Eder [1988: 32] suggested in the 1980s that the “equilibrium of these ecosystems should be respected and considered” in the design and development of technical systems. Today, there is a general consensus that artificial systems may have a considerable impact on the environment and the resource base throughout their life cycle [Ulgiati, Raugei, and Bargigli, 2006; Stasinopoulos et al., 2009]. Consequently, organiza-tions are under increasing consumer and regulatory pressure to monitor and improve the sustainability performance of their technical systems and products [Park, Lee, and Wimmer, 2005; Chapman, 2011].
Information on the sustainability performance of technical systems may be used to support decision making in a vari-ety of contexts. Technical systems constitute the artifact in engineering design, and it is during the design process that the greatest improvements in technical system sustainability may be achieved [Park et al., 2005; Stasinopoulos et al., 2009; Spangenberg, Fuad-Luke, and Blincoe, 2010]. Here, design-ers may use information on the sustainability performance of their artifacts to identify particular aspects that should be targeted to improve sustainability [Collado-Ruiz and Ostad-Ahmad-Ghorabi, 2010], or to select the most sustainable op-tion from a range of alternatives [Azkarate et al., 2011]. At the organizational level, manufacturing organizations may as-sess the sustainability performance of their technical products as a means to manage business processes [Hussey, Kirsop, and Meissen, 2001; Global Reporting Initiative, 2013a] and the implementation and monitoring of sustainability and cor-porate social responsibility policies [Marimon et al., 2012; Global Reporting Initiative, 2013a,b]. The information gath-ered through such an assessment may be published in an or-ganizational sustainability report, where it becomes available to consumers who can subsequently use it to make purchasing decisions on the basis of product sustainability [Chapman, 2011; Koller, Floh, and Zauner, 2011], for example, which product to buy from an organization or which organization’s products to buy.
A number of sustainability performance evaluation meth-ods are available to designers and organizations during the design process and in later stages of the technical system life cycle. Prominent examples include life cycle assessment, material flow analysis, energy analysis, emergy analysis, and exergy analysis. All of these may be classified as evaluating the material and energetic performance of technical systems, and similarities may be detected across certain methods with respect to the broad areas being measured. For instance, the majority include performance indicators focusing on various types of emissions and waste products, as well as material and/or energy consumption at different life cycle stages. How-ever, as shown in Section 2.1, the specific indicators applied vary from method to method. Additionally, authors may be seen to define sustainability performance indicators (SPIs) in an ad hoc manner, seeming to draw upon their knowl-edge of the system and sustainability generally rather than any formal method [e.g., Denholm, Kulcinski, and Holloway,
2005; Rotella et al., 2012; Asif and Muneer, 2014]. These observations raise a basic question: what constitutes a com-prehensive set of material and energetic SPIs for evaluating the sustainability performance of technical systems? That is, what range of material and energetic aspects should funda-mentally be measured in order to gain a holistic view? Given that effective decision making requires comprehensive infor-mation on the issue at hand [Dalal-Clayton and Bass, 2002; Wahl and Baxter, 2008; Boyle et al., 2012], this question has ramifications for sustainability decision making in each of the contexts outlined above.
The Global Reporting Initiative (GRI) has developed a set of generic guidelines for organizational sustainability re-porting (SR), intended to foster a common and consistent approach worldwide [Hussey et al., 2001; Dalal-Clayton and Bass, 2002; Global Reporting Initiative, 2013a]. Clear guid-ance on the type and range of SPIs that should be included in a comprehensive assessment of an organization’s sustainabil-ity performance is provided [Hussey et al., 2001; Morhardt, Baird, and Freeman, 2002]; however, the guidelines do not prescribe the use of any particular evaluation methods, leav-ing the choice up to the assessor with the caveat that they report any “standards, methodologies, and assumptions used” [Global Reporting Initiative, 2013b: 91]. In contrast, there is a lack of any consistent and flexible guidance of this nature at the level of technical systems [Waage, 2007]. Whilst all of the methods listed above may be considered useful in sustainability performance evaluation, it is not clear whether they yield comprehensive sets of SPIs or what form such a set might take.
The remainder of the paper is organized as follows. First, the findings of a literature review on comprehensiveness in sustainability performance evaluation are presented in Sec-tion 2. The S-CPMatrix is introduced in SecSec-tion 3, and its development (Section 3.1) and evaluation through the clas-sification exercise mentioned above (Section 3.2) are de-scribed. The work is discussed in Section 4, where four av-enues for future research are highlighted: (i) the application of the matrix to support systems comparison/benchmarking; (ii) further investigation of metrics found to be unsupported by the classification exercise; (iii) the nature of contaminants as an influence on technical system sustainability, and how they may be measured and modeled; and (iv) assessing the comprehensiveness of SPI sets currently applied to technical systems. The paper concludes with a summary of the work in Section 5.
2. COMPREHENSIVENESS IN SUSTAINABILITY
PERFORMANCE EVALUATION
As a first step toward developing the S-CPMatrix, we sought to understand the issue of comprehensiveness from two per-spectives: (1) a sustainability perspective, focusing on what performance aspects should be measured at what scales and (2) a performance perspective, focusing on the nature of per-formance and perper-formance indicators. The three criteria for comprehensive SPI sets that we identified from this body of work are elaborated in the following sub-sections.
Literature from area (1) was gathered by searching major engineering databases (e.g., Compendex and the Technol-ogy Research Database), as well as several multidisciplinary databases via the Web of Science service. Search terms re-lating to sustainability and the environment were applied, in combination with a range of terms reflecting: (i) performance measurement, for example, assess*, eval*, indicator, mea-sur*, and metric and (ii) technical systems as conceptualized by Hubka and Eder [1988], for example, product, system, and engineer*. Regarding area (2), sources by authors generally considered to be influential in performance measurement re-search were selected for review, including: Kaplan and Norton [1992, 1996]; Neely, Gregory, and Platts [1995]; Bourne et al. [2000]; O’Donnell and Duffy [2002, 2005]; Neely, Adams, and Kennerley [2002a]; Neely et al. [2002b]; Duffy [2005]; and Bourne and Bourne [2007]. The literature on sustain-ability is reviewed in Section 2.1 below, and performance measurement is covered in Section 2.2.
2.1. Sustainability and the Technical System Life
Cycle
A range of methods may be applied to evaluate the sustain-ability performance of technical systems, falling into two broad categories: (i)ad hocapproaches and (ii) formal eval-uation methods. Inad hoc approaches (Table I), evaluators appear to define SPIs based on their own knowledge of sus-tainability and the technical system in question rather than any predefined method. Although the specific material and energetic aspects measured often differ as shown in Table I, similarities may be detected with respect to the broad areas
being measured, for example, emissions and waste products, energy efficiency, and material/energy consumption.
With respect to formal methods, Ness et al. [2007] high-light several product-related assessment methods that are commonly applied to technical systems, namely: life cycle assessment; material flow analysis; energy analysis; exergy analysis; and emergy accounting. The indicators typically associated with each method are presented in Table II be-low. None of the methods are positioned as comprehensive with respect to sustainability performance. However, they all focus on the material and/or energetic flows associated with a technical system, and are therefore frequently pre-sented as useful for assessing the sustainability performance of technical systems [e.g., Brown and Ulgiati, 1997; Rosen, Dincer, and Kanoglu, 2008; Gasparatos, El-Haram, and Horner, 2008; Ulgiati et al., 2011; Liao, Heijungs, and Hup-pes, 2011; Buonocore, Franzese, and Ulgiati, 2012]. As shown in Table II, the nature of the indicators associated with each method depends primarily upon its particular material and/or energetic perspective.
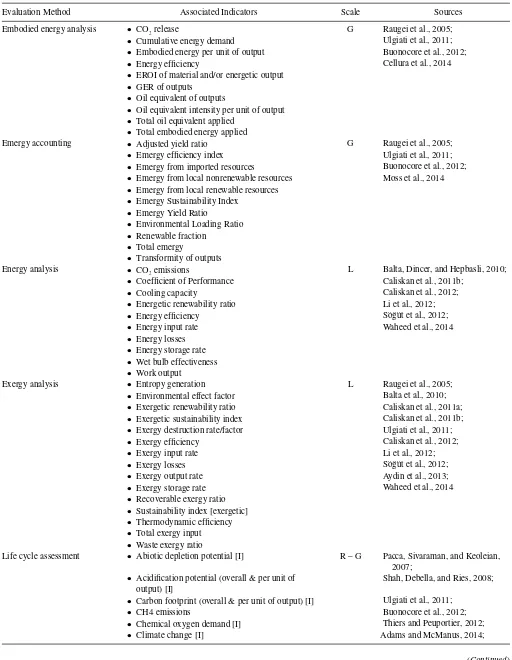
As indicated in Tables I and II, different evaluation meth-ods measure sustainability performance at different scales, ranging from local (L) to regional (R) and global (G). The notion of scale in this context may be understood in terms of the technical system life cycle, which is generally considered to consist of four key stages: (i) extraction and processing of raw materials required to manufacture the system; (ii) manufacturing (including design and development, and also transportation of components); (iii) system operation; and (iv) recycling and disposal [Blanchard and Fabrycky, 1981; Stasinopoulos et al., 2009; Ulgiati et al., 2011]. As shown in Figure 1, each stage is supported by the Earth system’s material and energetic resource base, as well as waste sinks and processing activities.
Sustainability performance may be evaluated across differ-ent portions of the life cycle. For instance, certain authors fo-cus upon the operation phase only [e.g., Caliskan, Dincer, and Hepbasli, 2012; Rotella et al., 2012; Aydin et al., 2013], whilst others apply methods such as life cycle assessment to evaluate performance across the full life cycle [e.g., Ulgiati et al., 2011; Adams and McManus, 2014; Ofori-Boateng and Lee, 2014]. Ulgiati et al. [2011: 177] highlight that life cycle stages are closely tied to the spatial scale at which material and energetic flows are evaluated, with each scale “characterized by well-specified processes” occurring at different stages:
• The local scale involves “final resource use,” that is, the operation of the technical system—here, only the direct material and energetic inputs to and outputs from the system need to be considered;
• The regional scale involves “manufacturing and trans-port of components” —here, the indirect material and energetic inputs/outputs associated with manufacturing and transporting system components must be considered in addition to the direct inputs/outputs above; and • The global scale involves “resource extraction and
Table I. A Selection of Authors ApplyingAd HocApproaches to Evaluating the Sustainability Performance of Technical Systems
Source Technical System Indicators Scale
Denholm et al. [2005] Baseload wind energy system, including turbines & storage)
• Fuel consumption rate
• GHG emission rate
• NOx emission rate
• Primary energy efficiency
• SO2 emission rate
R
Hondo [2005] A range of different power production systems
• Life cycle GHG emission factor R
Evans, Strezov, and Evans [2009]
Photovoltaic, wind, hydro, & geothermal energy production systems
• Efficiency of energy generation
• Greenhouse gas emissions
• Land use
• Price of electricity generation
• Social impacts
• Water consumption
R
Onat and Bayar [2010] Power production systems generally
• Carbon dioxide emissions
• Efficiency
• Fresh water consumption
• Land use
• Social effects
• Unit energy cost
L
Rotella et al. [2012] Hard machining system • Cutting force
• Material removal rate
• Mechanical power
• Thrust force
• Wear rate
• White layer thickness
L
Coelho, Lange, and Coelho [2012]
Ten different waste-to-energy plants
• Area required by treated waste
• Chemicals and additives consumption by treated waste
• CO2emissions by treated waste
• Dust emissions by treated waste
• Electricity consumption by treated waste
• Electricity generation by treated waste
• Fossil fuel consumption by treated waste
• Greenhouse gas emissions by treated waste
• Liquid effluents generated by treated waste
• Other gases emitted by treated waste
• Other materials consumed by treated waste
• Soil used by treated waste
• Thermal energy generation by treated waste
• Waste or sub products generated by treated waste
• Water consumption by treated waste
• Water vapor consumption by treated waste
L
Chandrasekaran and Guha [2012]
Turbofan engine • Emission index of carbon dioxide
• Emission index of carbon monoxide
• Emission index of hydrocarbons
• Emission index of NOx
• Inlet mass flow
• Net thrust
• Overall efficiency
• Specific fuel consumption
• Thermal efficiency
L
Abdel-Salam and Simonson [2014]
Membrane liquid desiccant air conditioning system
• CO emissions
• CO2emissions
• NOx emissions
• PM emissions
• Primary energy consumption
• SOx emissions
L
Table I. Continued
Source Technical System Indicators Scale
Asif and Muneer [2014]
Window (panel & frame) • Annual CO2emission—electricity
• Annual CO2emission—gas
• Annual electricity cost
• Annual gas cost
• Annual heat loss
• Life cycle CO2emission—electricity
• Life cycle CO2emission—gas
• Life cycle cost—electricity
• Life cycle cost—gas
• Life cycle heat loss
L
Rahman et al. [2014] Compression ignition engine • Brake specific fuel consumption
• Carbon monoxide (emission parameter)
• Exhaust gas temperature
• Hydrocarbons (emission parameter)
• Nitrogen oxides (emission parameter)
• Particulate matter (emission parameter)
• Thermal efficiency
L
Singh, Singh, and Agarwal [2014]
Biodiesel-fuelled HCCI engine • CO2emissions
• Hydrocarbon emissions
• Indicated specific fuel consumption
• Indicated thermal efficiency
• NO emissions
• Smoke opacity
L
Recycling/disposal of system components Extraction &
processing of raw materials
Manufacturing & transportation of components
System operation
MATERIAL AND ENERGETIC RESOURCE BASE WASTE SINKS AND PROCESSING ACTIVITIES
Figure 1. The technical system life cycle.
Recycling and disposal processes also occur at the regional scale, essentially mirroring manufacturing processes with a focus on system deconstruction as opposed to construction. However, data on the material and energetic flows associated with recycling and disposal are generally rather limited. Thus, in certain cases this phase may be excluded from a regional or global scale performance evaluation [Gurzenich and Wagner, 2004; Hondo, 2005; Raugei, Bargigli, and Ulgiati, 2005].
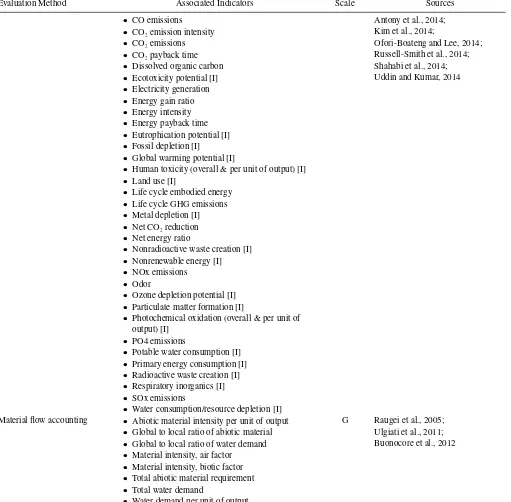
The different spatiotemporal scales delineated above may be illustrated by considering the notion that all of the activities involved in the technical system life cycle, including the operation of the system per se, occur within
a wider system of interest (SoI) that provides inputs to activities and receives the outputs produced [Blanchard and Fabrycky, 1981; Hubka and Eder, 1988; Tully, 1993; Stasinopoulos et al., 2009]. Essentially, increasing the spatial scale over which sustainability performance is to be evaluated means that: (i) more of the Earth system is included in the technical system’s wider SoI and (ii) the technical system’s interactions with this SoI must be considered across a broader portion of the system life cycle, as shown in Figure 2.
[image:5.594.48.546.87.468.2]Table II. Formal Sustainability Performance Evaluation Methods Applied to Technical Systems, and Associated Indicators
Evaluation Method Associated Indicators Scale Sources
Embodied energy analysis • CO2release G Raugei et al., 2005;
• Cumulative energy demand Ulgiati et al., 2011;
• Embodied energy per unit of output Buonocore et al., 2012;
• Energy efficiency Cellura et al., 2014
• EROI of material and/or energetic output
• GER of outputs
• Oil equivalent of outputs
• Oil equivalent intensity per unit of output
• Total oil equivalent applied
• Total embodied energy applied
Emergy accounting • Adjusted yield ratio G Raugei et al., 2005;
• Emergy efficiency index Ulgiati et al., 2011;
• Emergy from imported resources Buonocore et al., 2012;
• Emergy from local nonrenewable resources Moss et al., 2014
• Emergy from local renewable resources
• Emergy Sustainability Index
• Emergy Yield Ratio
• Environmental Loading Ratio
• Renewable fraction
• Total emergy
• Transformity of outputs
Energy analysis • CO2emissions L Balta, Dincer, and Hepbasli, 2010;
• Coefficient of Performance Caliskan et al., 2011b;
• Cooling capacity Caliskan et al., 2012;
• Energetic renewability ratio Li et al., 2012;
• Energy efficiency S¨o˘g¨ut et al., 2012;
• Energy input rate Waheed et al., 2014
• Energy losses
• Energy storage rate
• Wet bulb effectiveness
• Work output
Exergy analysis • Entropy generation L Raugei et al., 2005;
• Environmental effect factor Balta et al., 2010;
• Exergetic renewability ratio Caliskan et al., 2011a;
• Exergetic sustainability index Caliskan et al., 2011b;
• Exergy destruction rate/factor Ulgiati et al., 2011;
• Exergy efficiency Caliskan et al., 2012;
• Exergy input rate Li et al., 2012;
• Exergy losses S¨o˘g¨ut et al., 2012;
• Exergy output rate Aydin et al., 2013;
• Exergy storage rate Waheed et al., 2014
• Recoverable exergy ratio
• Sustainability index [exergetic]
• Thermodynamic efficiency
• Total exergy input
• Waste exergy ratio
Life cycle assessment • Abiotic depletion potential [I] R – G Pacca, Sivaraman, and Keoleian, 2007;
• Acidification potential (overall & per unit of output) [I]
Shah, Debella, and Ries, 2008;
• Carbon footprint (overall & per unit of output) [I] Ulgiati et al., 2011;
• CH4 emissions Buonocore et al., 2012;
• Chemical oxygen demand [I] Thiers and Peuportier, 2012;
• Climate change [I] Adams and McManus, 2014;
Table II. Continued
Evaluation Method Associated Indicators Scale Sources
• CO emissions Antony et al., 2014;
• CO2emission intensity Kim et al., 2014;
• CO2emissions Ofori-Boateng and Lee, 2014;
• CO2payback time Russell-Smith et al., 2014;
• Dissolved organic carbon Shahabi et al., 2014;
• Ecotoxicity potential [I] Uddin and Kumar, 2014
• Electricity generation
• Energy gain ratio
• Energy intensity
• Energy payback time
• Eutrophication potential [I]
• Fossil depletion [I]
• Global warming potential [I]
• Human toxicity (overall & per unit of output) [I]
• Land use [I]
• Life cycle embodied energy
• Life cycle GHG emissions
• Metal depletion [I]
• Net CO2reduction
• Net energy ratio
• Nonradioactive waste creation [I]
• Nonrenewable energy [I]
• NOx emissions
• Odor
• Ozone depletion potential [I]
• Particulate matter formation [I]
• Photochemical oxidation (overall & per unit of output) [I]
• PO4 emissions
• Potable water consumption [I]
• Primary energy consumption [I]
• Radioactive waste creation [I]
• Respiratory inorganics [I]
• SOx emissions
• Water consumption/resource depletion [I]
Material flow accounting • Abiotic material intensity per unit of output G Raugei et al., 2005;
• Global to local ratio of abiotic material Ulgiati et al., 2011;
• Global to local ratio of water demand Buonocore et al., 2012
• Material intensity, air factor
• Material intensity, biotic factor
• Total abiotic material requirement
• Total water demand
• Water demand per unit of output
To illustrate, consider the use of nonrenewable resources by a solar panel. A solar panel may be viewed as a relatively simple technical system that converts solar energy into electrical en-ergy. At the local scale, we may evaluate the panel’s consump-tion of nonrenewable resources and find that it uses none—the only energetic input to the system during its operation is re-newable solar energy. As discussed further in Section 3.1, for sustainability, the use of nonrenewable resources should be minimized, ideally to zero. Thus, at the local scale, the panel appears to be sustainable. However, if we evaluated the same
Recycling/disposal of system components Extraction &
processing of raw materials
Manufacturing & transportation of components
System operation
MATERIAL AND ENERGETIC RESOURCE BASE WASTE SINKS AND PROCESSING ACTIVITIES
Local Regional
Global
[image:8.594.49.546.68.340.2]system of interest boundary
Figure 2. The spatiotemporal scales of sustainability performance evaluation.
It can be seen from the above that a technical system’s sustainability performance may be interpreted differently depending on the spatiotemporal scale of the evaluation. Thus, in order to gain a comprehensive view, it may be necessary to measure a set of SPIs providing information on performance at different scales. This is supported by Ulgiati et al. [2011: 187], who suggest that “a selection of many indicators is needed in order to have a comprehensive evaluation across space and time scales.” As mentioned in Section 1, information on sustainability performance is used for different purposes. For example, a designer may wish to identify areas where changes could potentially be made to a technical artifact to improve aspects such as energy efficiency and consumption during its life in service [Aydin et al., 2013]. In this case, evaluation at the local scale is likely sufficient, given the relationship between temporal and spatial scale outlined above. In other cases, information may be used to understand what phase in a system’s life cycle is associated with the worst sustainability performance, and should therefore form the focus of redesign efforts [Park et al., 2005]. This is likely to entail evaluation at the regional and possibly also global scales. Thus, it may not be necessary to evaluate SPIs at every scale outlined above in all cases; however, it is necessary to ensure coverage of all scales that are relevant given the purposes of the evaluation. On this basis, we may define an initial criterion for comprehensive SPI sets:
• Criterion 1 (C1). A comprehensive set of SPIs for a technical system should include indicators measuring
performance at all relevant spatiotemporal scales, given the purposes of the evaluation.
2.2. Performance Axioms
activity
effectiveness
Ɛ
η
efficiency
goal
passive
resources output
[image:9.594.73.254.62.215.2]active resources
Figure 3. TheE2performance model (adapted from O’Donnell and
Duffy [2005: 79]).
Two criteria for comprehensive SPIs may be identified by considering a set of performance axioms derived from theE2
model by O’Donnell and Duffy [2002]. Briefly, these state that: “activities are the fundamental means that create per-formance, activities and their management are inextricably linked, and [ . . . ] all metrics [i.e. indicators] can be typified to efficiency or effectiveness indicators” [O’Donnell and Duffy, 2002]. The axioms are elaborated in Sections 2.2.1 and 2.2.2 below. We shall adopt the following terminology throughout, noting instances where other authors may be describing the same concept using different terms:
• Aperformance indicatoris taken to be a parameter used to quantify the efficiency or effectiveness of an activity [Neely et al., 2002b].
• Aperformance metricis defined here as a specification for a broadly based performance indicator [Neely et al., 2002a].
• Ameasureis considered to be an item of data required to compute a value for a performance indicator [Duffy, 2005].
2.2.1. Efficiency and Effectiveness
The first axiom posited by O’Donnell and Duffy [2002] states that: “All performance can be measured by efficiency and/or effectiveness. That is, no matter the metric(s) or aspect(s) under consideration, all indicators of performance, no matter how general or specific, will indicate either an efficiency or ef-fectiveness measure” [O’Donnell and Duffy, 2002: 1218]. In turn, O’Donnell and Duffy [2005: 79] argue that performance “is completely described within the elements of efficiency and effectiveness,” and therefore both elements must be measured to obtain “a fully informed view of activity performance.” This is supported by others. For instance, Kennerley and Neely [2002: 149] state that a set of performance indicators should include both efficiency and effectiveness measures in order to be “balanced.” Neely et al. [1995: 81] define a performance measurement system as “the set of metrics used to quantifyboththe efficiency and effectiveness of actions” (emphasis ours).
A one-eyed focus on efficiency may mean that gains are achieved at the expense of effectiveness, and vice versa. To
Manufacture products
annual product output (effectiveness)
∏
η
productivity (efficiency)
goal
passive
resources output
active resources
products materials
& energy
maximise annual product output
[image:9.594.317.543.65.224.2]manufacturing system
Figure 4. Activity carried out by a manufacturing system.
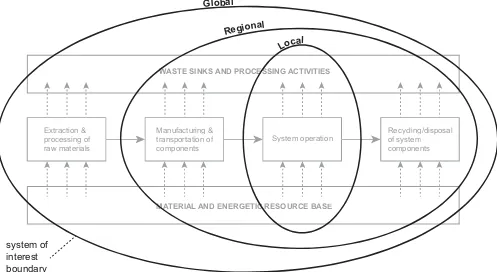
illustrate this, consider the performance of a manufacturing system as an example. As shown in Figure 4, the manufactur-ing system (a collection of resources) carries out an activity whereby materials and energy (inputs) are transformed into some kind of product (output), with the goal of maximizing the annual output of products.
The efficiency of the activity may be measured by an indicator such as productivity, that is, the number of prod-ucts produced per unit of materials and/or energy consumed. Given the activity goal, effectiveness may be measured by the number of products produced in a year. In isolation, we may set a target level for the effectiveness measure that appears to be appropriate given our knowledge of the system, the wider business, the customer, and so on. However, without consider-ing the potential productivity inherent in the activity—that is, the potential level of productivity that could be obtained given the activity’s attributes—this level of effectiveness may be produced in a grossly inefficient manner. In contrast, we may evaluate the activity’s productivity, without any knowledge of the target level for the effectiveness measure, and find that it is highly efficient in producing products from materials/energy. However, beyond our knowledge, the activity may be pro-ducing an output of products either far below or exceeding the target level considered adequate by decision makers. In both cases, it may be seen that measuring one performance component in isolation can yield a misleading view on overall activity performance.
Given that high efficiency does not necessarily equate with high effectiveness and vice versa, it is necessary to measure both elements to fully understand a system’s performance [O’Donnell and Duffy, 2005]. In a sustainability context, this is supported to some extent by McDonough and Braungart [2002], who suggest that sustainable systems must be both ecoeffective and ecoefficient. As we will show in Section 3.2, the majority of SPIs currently applied to technical systems may indeed be typified to efficiency or effectiveness indica-tors, although the sets of SPIs used may not always cover both elements. On this basis, we may define a second criterion for comprehensive SPI sets:
2.2.2. The Relationship between Indicators and Goals
The next two performance axioms defined by O’Donnell and Duffy [2002: 1217–1218] are stated thus:
i. “Activities are the fundamental means that create perfor-mance. [ . . . ] Other aspects influence the type, definition and behavior of an activity but it is the activity itself that realises performance.”
ii. “Activities and their management are inextricably linked. Carrying out an activity will always involve an element of management. Thus, every activity, even at an individual cognitive level, will involve its management.”
In short, it is fundamentally activities that produce perfor-mance [Lebas and Euske, 2002; Neely et al., 2002a; Bourne and Bourne, 2007], and these activities are managed by a decision maker (be it a human or an artificial intelligence system).
A key element of activity management is setting perfor-mance goals [Neely et al., 2002b; O’Donnell and Duffy, 2005]. These essentially define the behavior required to de-liver a desired level of performance [Hubka and Eder, 1988; O’Donnell and Duffy, 2005; Hay et al., 2014]. For example, the production of waste is a key sustainability consideration for technical systems, as discussed further in Section 3. The ideal performance to be achieved in this area is a waste out-put level of zero (we make no claims about whether this is actually achievable). Thus, a goal such as “minimize waste production” may be defined for the system. We may then take action by, for instance, making changes to the system or its support environment to ensure that it produces less waste in the future [Hay et al., 2014]. Note that performance goals can be defined for existing and conceptual systems. For instance, a designer may set the above goal for a conceptual system design and then make changes to the design to mini-mize its potential waste output [O’Donnell and Duffy, 2005; Russell-Smith et al., 2014].
It may be seen from the above that performance indica-tors should always be related to performance goals. This is supported in the wider literature on performance. For exam-ple, in a business context, Kaplan and Norton [1992: 73] state that in order to apply their balanced scorecard frame-work, “companies should articulate goals for time, quality, and performance and service and then translate these goals into specific measures.” In a similar context, Bourne et al. [2000: 757–758] suggest that “the two requirements of the design phase [for performance indicators] are identifying the key objectives to be measured and designing the measures.” Although efficiency may be viewed as an inherent property of an activity that is measurable without knowledge of goals, O’Donnell and Duffy [2005: 73] state that the “selection and application of metrics to determine efficiency allow particular views of efficiency to be created, e.g. cost based efficiency” [O’Donnell and Duffy, 2005: 73]. It is reasonable to suggest that the desired “views” of efficiency are likely to reflect certain goals of the activity being evaluated. For instance, it is unlikely that one would define an indicator to measure the based efficiency of an activity if the activity has no cost-focused goals.
In summary, goals define the behavior required to achieve certain performance, whilst indicators provide information on
whether system behavior is shifting in the required direction in response to management actions [O’Donnell and Duffy, 2005; Hay et al., 2014]. Thus, to obtain a fully informed view on the performance of a system from a particular per-spective, be it sustainability or something else, we need to select indicators that provide information in relation to all relevant goals. On this basis, we may define a third criterion for comprehensive SPI sets:
• Criterion 3 (C3). A comprehensive set of SPIs for a technical system should cover all of the sustainability goals defined for the system, that is, goals governing the aspects of behavior affecting a system’s sustainability performance.
The nature of sustainability goals for technical systems is discussed in Section 3, where the S-CPMatrix is introduced.
3. THE S-CYCLE PERFORMANCE MATRIX
(S-CPMatrix)
The three criteria for comprehensiveness identified from the literature in Section 2 form the basis of the S-CPMatrix discussed in Section 1. To construct the matrix, we derived the following elements from our previously developed S-Cycle model [Hay et al., 2014]: (i) generic sustainability goals, highlighting the general range of such goals that may be defined for a technical system (C3); (ii) SPI archetypes, highlighting the different types of efficiency and effectiveness indicator at the disposal of evaluators (C2); and (iii) a range of metrics (i.e., essentially, formulae) to measure each type of SPI, highlighting the scale at which different measures may be evaluated (C3). The S-Cycle model describes the general aspects of behavior affecting the sustainability performance of any system. In turn, the S-CPMatrix is intended to support the translation of these general aspects into comprehensive sets of measurable SPIs for specific technical systems.
The S-Cycle model is briefly introduced in Section 3.1, before the S-CPMatrix is presented and the goals, SPI archetypes, and metrics derived from the model are described and explained. Section 3.2 outlines a classification of 324 indicators undertaken to provide an initial evaluation of the matrix. Note that ongoing work to further evaluate the matrix in an industrial context is discussed in Section 4.
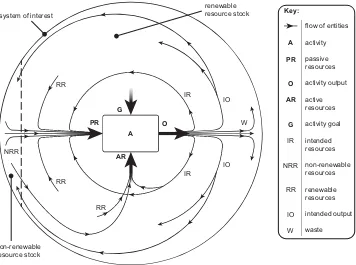
3.1. Elements of the S-Cycle Performance Matrix
A G
PR
AR
O W
RR
RR NRR
IR
IR
IO
IO
RR system of interest
renewable resource stock
non-renewable resource stock
Key:
A
PR
O
AR
G
IR
NRR
RR
IO
W
flow of entities activity
passive resources activity output
active resources
activity goal intended resources
non-renewable resources
renewable resources intended output
[image:11.594.121.477.63.328.2]waste
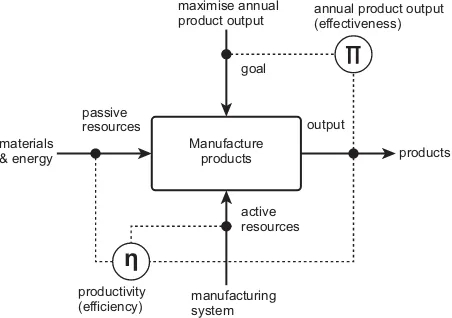
Figure 5. The S-Cycle model. Reprinted from Journal of Environmental Management, Vol. 133, Hay, L., Duffy, A., and Whitfield, R.I., The Sustainability Cycle and Loop: Models for a more unified understanding of sustainability, pp.232–257, Copyright (2013), with permission from Elsevier.
technical system in order to fulfil its function and meet human needs; (ii) intended resources, that is, resources produced by a technical system for its own use and self-sufficiency; and (iii) waste, that is, outputs with no utility to the technical system that produced them. Renewable resources originate from stocks that regenerate over time, whilst nonrenewable resources originate from stocks that do not regenerate sig-nificantly along anthropological timescales. Resources may be further sub-divided into: (i) passive resources, that is, the materials and energy being processed by the technical system activity and (ii) active resources, that is, the components of the technical systemper sethat carry out the processing of passive resources. The S-Cycle’s validity as a model of technical system sustainability has been evaluated through application to the bioethanol system referenced above plus a further nine distinct systems in an industrial setting [Hay, 2015]. Thus, it may be considered to provide a suitable basis for defining generic, comprehensive SPIs for technical systems.
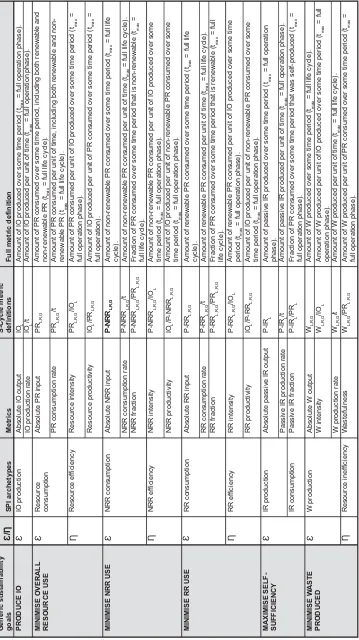
The initial version of the S-CPMatrix is presented in Table III; a refined version developed following evaluation is presented and discussed in Section 3.2.2. Throughout the following sections, readers are referred to Table IX for the meaning of abbreviations.
Generally speaking, the goals in the matrix were defined on the basis that they should reflect the aspects of behavior affect-ing system sustainability performance, that is, those aspects described in the S-Cycle model. With respect to measuring effectiveness, we considered what indicators would provide information on the achievement of these goals based on the behavior conveyed by the S-Cycle model. Regarding the mea-surement of efficiency, we considered what kinds of efficiency
are inherent in a technical system’s activity from a sustain-ability perspective given the inputs and outputs described in the S-Cycle model. In defining metrics for the resulting SPI archetypes, we considered how each SPI may be expressed from two perspectives:
i. Data, that is, what measures are needed to compute a value for the indicator, how these measures relate, and whether they can be related in different ways.
ii. Spatiotemporal scale, that is, whether the measures can be evaluated at local, regional, and/or global scales. As discussed in Section 2.1, both intended output and intended resources are produced during the operation phase of the life cycle and may therefore be mea-sured at the local scale only. Given that direct and in-direct resource inputs and waste outputs may be con-sumed/produced by a system throughout its life cycle, these may be measured at all scales. The scale of each measure in the matrix is denoted by a subscript letter, that is, L=local, R=regional, and G=global.
The rationale behind each goal in the S-CPMatrix and its associated SPI archetypes and metrics is outlined below.
3.1.1. Goal: Produce Intended Output
T a ble III. Initial V ersion of the S-Cycle P erformance M atrix (S-CPMatrix)
Generic sustainability goals
Ɛ/Ƞ SPI archetypes ci rt e m el c y C-S s ci rt e M d efinitions
Full metric definition
PRODUCE IO MINIMISE OVERALL RESOURCE USE MINIMISE NRR USE MINIMISE RR USE MAXIMISE SELF- SUFFICIENCY MINIMISE W
A
STE
PRODUCED
Ɛ Ɛ Ƞ Ɛ Ƞ Ɛ Ƞ Ɛ Ɛ Ƞ
IO production Resource consumption Resource ef
ficiency
NRR consumption NRR ef
ficiency
RR consumption RR ef
ficiency
IR production IR consumption W production Resource inef
ficiency
Absolute IO output IO production rate Absolute PR input PR consumption rate Resource intensity Resource productivity Absolute NRR input NRR consumption rate NRR fraction NRR intensity NRR productivity Absolute RR input RR consumption rate RR fraction RR intensity RR productivity Absolute passive IR output Passive IR production rate Passive IR fraction Absolute W output W intensity W production rate Wastefulness
IO L IO L /t PR L,R,G PR L,R,G /t PR L,R,G /IO L IO L /PR L,R,G P-NRR L,R,G P-NRR L,R,G /t P-NRR L,R,G /PR L,R,G P-NRR L,R,G /IO L IO L /P-NRR L,R,G P-NRR L,R,G P-RR L,R,G P-RR L,R,G /t P-RR L,R,G /PR L,R,G P-RR L,R,G /IO L IO L /P-RR L,R,G P-IR L P-IR L /t P-IR L /PR L W L,R,G W L,R,G /IO L W L,R,G /t W L,R,G /PR L,R,G
Amount of IO produced over some time period (t
max
= full operation phase).
Amount of IO produced per unit of time (t
max
= full operation phase).
Amount of PR consumed over some time period, including both renewable and non-renewable PR (t
max
= full life cycle).
Amount of PR consumed per unit of time, including both renewable and non- renewable PR (t
max
= full life cycle).
Amount of PR consumed per unit of IO produced over some time period (t
max
=
full operation phase). Amount of IO produced per unit of PR consumed over some time period (t
max
=
full operation). Amount of non-renewable PR consumed over some time period (t
max
= full life
cycle). Amount of non-renewable PR consumed per unit of time (t
max
= full life cycle).
Fraction of PR consumed over some time period that is non-renewable (t
max
=
full life cycle). Amount of non-renewable PR consumed per unit of IO produced over some time period (t
max
= full operation phase).
Amount of IO produced per unit of non-renewable PR consumed over some time period (t
max
= full operation phase).
Amount of renewable PR consumed over some time period (t
max
= full life
cycle). Amount of renewable PR consumed per unit of time (t
max
= full life cycle).
Fraction of PR consumed over some time period that is renewable (t
max
= full
life cycle). Amount of renewable PR consumed per unit of IO produced over some time period (t
max
= full operation phase).
Amount of passive IR produced over some time period (t
max
= full operation
phase). Amount of passive IR produced per unit of time (t
max
= full operation phase).
Amount of IO produced per unit of non-renewable PR consumed over some time period (t
max
= full operation phase).
Fraction of PR consumed over some time period that was self-produced (t
max
=
full operation phase). Amount of W produced over some time period (t
max
= full life cycle).
Amount of W produced per unit of IO produced over some time period (t
max
= full
operation phase). Amount of W produced per unit of time (t
max
= full life cycle).
Amount of W produced per unit of PR consumed over some time period (t
max
=
[image:12.594.124.483.83.723.2]continue producing intended output over time may be inter-preted as a loss of sustainability. Effectiveness against the goal may be evaluated by measuring the level of intended output produced by a system over time. That is, intended output productionas an absolute value or a rate. We did not define an efficiency measure for this goal, although intended output is involved in computing efficiency for resource-focused goals below.
3.1.2. Goals: Minimize Use of (i) Nonrenewable and (ii) Renewable Resources
As shown in Figure 5, a technical system’s ability to con-tinue producing intended output over time is fundamentally dependent upon the continued availability of the resources it requires, and may also be affected by its waste production behavior. Since the continued availability of nonrenewable resources cannot be guaranteed, their consumption should be minimized/eliminated where possible. It is also desirable to minimize the use of renewable resources given that stocks are depleted if consumption rates exceed regeneration rates [Hay et al., 2014]. At the very least, stock regeneration rates should be respected. Effectiveness against these goals may be evaluated by measuring the level of passive nonrenewable and renewable resources consumed by a system over time, re-spectively. That is,nonrenewable resource consumptionand
renewable resource consumptionas absolute values, rates, or fractions of the total passive resource input. Efficiency may be evaluated via the indicatorsnonrenewableandrenewable resource efficiency, defined as the ratio of intended output produced to passive nonrenewable or renewable resources consumed over time, respectively.
3.1.3. Goal: Minimize Overall Resource Use
As discussed above, it is desirable to minimize the consump-tion of resources derived from external stocks, that is, re-newable and nonrere-newable resources. Thus, a parent goal to minimize overall resource use may be defined for the above goals. Effectiveness against this goal may be evaluated by measuring the total level of passive nonrenewable and re-newable resources consumed by a system over time. That is,
resource consumptionas an absolute value or rate. Efficiency may be evaluated via the indicatorresource efficiency, defined as the ratio of intended output produced to the total passive nonrenewable and renewable resources consumed over time.
3.1.4. Goal: Maximize Self-Sufficiency
In other words, maximize the fraction of the passive re-source input that was self-produced (intended rere-sources) as opposed to externally derived (nonrenewable and renewable resources). Reducing an activity’s reliance upon external re-source stocks can reduce the impact of external shocks and disturbances (e.g., the sudden loss of a resource stock) on intended output production and in turn, sustainability. Effec-tiveness against this goal may be evaluated by measuring the level of intended resources produced by a system over time. That is, intended resource production as an absolute value or a rate. Alternatively, the fraction of the total passive resource input that was self-produced may be measured. That is,intended resource consumption.
3.1.5. Goal: Minimize Waste Produced
Waste production rates exceeding the waste processing capac-ity of the wider SoI may cause waste to accumulate in the SoI (i.e., pollution). Unintended consumption of waste products by system activities may disrupt their functioning and there-fore, compromise their sustainability. Effectiveness against this goal may be evaluated by measuring the level of waste produced by a system over time. That is,waste production
as an absolute value, a rate or a value per unit of intended output produced over time (i.e., waste intensity). Efficiency may be evaluated via the indicatorresource inefficiency, de-fined as the ratio of waste produced (i.e., undesired gain) to passive resources consumed over time. Resource inefficiency may be considered to indicate how inefficiently a system uses resources to produce output—that is, what fraction of a system’s resource input is transformed to waste rather than in-tended output. Summing the values obtained for the resource efficiency (above) and resource inefficiency indicators should always yield a value of 1 or less.
It may be seen in Table III and from the above discus-sion that there is often more than one way of computing a particular SPI, hence, an SPI may have more than one asso-ciated metric. The intention is not that every single metric in the S-CPMatrix should be applied in every assessment effort—rather, decision makers may select a subset of these metrics that best aligns with their interests and the audience for the results, as long as the resulting set of SPIs meets the three criteria for comprehensiveness identified herein. The matrix simply highlights the range of different types of metric at the disposal of decision makers. For instance, consider the resource intensity and productivity metrics as-sociated with the resource efficiency SPI and the goal to minimize overall resource use. These are both defined as the ratio between intended output and resource consumption; however, they are expressed as the inverse of one another as shown in Table III. Thus, measuring both does not inherently provide any more information than measuring one alone. However, the format of the information provided by each one may be more useful in different contexts. For example, engineers involved in assessing a power generation system may be more interested in how much electricity is produced per unit of resource consumed (resource productivity) given economic concerns. However, the resource intensity metric may be more effective at communicating the environmental impacts associated with electricity generation to consumers, who may then be motivated to reduce their personal electricity consumption.
3.2. Classification of Current Sustainability
Performance Indicators
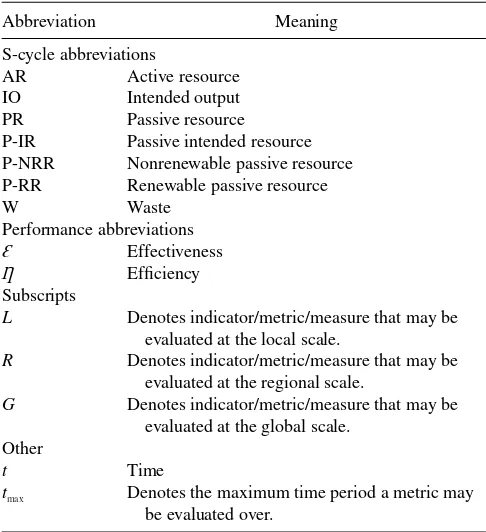
Table IV. Nomenclature
Abbreviation Meaning
S-cycle abbreviations
AR Active resource
IO Intended output
PR Passive resource
P-IR Passive intended resource P-NRR Nonrenewable passive resource P-RR Renewable passive resource
W Waste
Performance abbreviations
Ɛ Effectiveness
Ƞ Efficiency
Subscripts
L Denotes indicator/metric/measure that may be evaluated at the local scale.
R Denotes indicator/metric/measure that may be evaluated at the regional scale.
G Denotes indicator/metric/measure that may be evaluated at the global scale.
Other
t Time
tmax Denotes the maximum time period a metric may be evaluated over.
i. whether current indicators align with and reflect the pro-posed SPI archetypes and metrics in the matrix, thus providing support for the latter; and
ii. whether there are any indicators currently applied to technical systems that are notdescribed in the matrix, which may be suggestive of additional sustainability goals, SPI archetypes, and metrics.
It should be noted that the classification exercise was largely qualitative in nature, and focused on mapping indica-tors described in the literature to the proposed goals and SPI archetypes in the S-CPMatrix rather than statistical analysis of the sample. We were not concerned with differences be-tween groups of authors or evaluation methods, or the extent to which different types of indicator are applied in the sample. Rather, we sought qualitative evidence relating to our argu-ment that the generic goals and SPIs in the matrix constitute indicators of sustainability performance, which may be trans-lated to different technical systems and are compatible with existing evaluation methods.
The approach to the classification is briefly outlined in Section 3.2.1, before the outcome and a refined version of the S-CPMatrix are presented in Section 3.2.2.
3.2.1. Approach
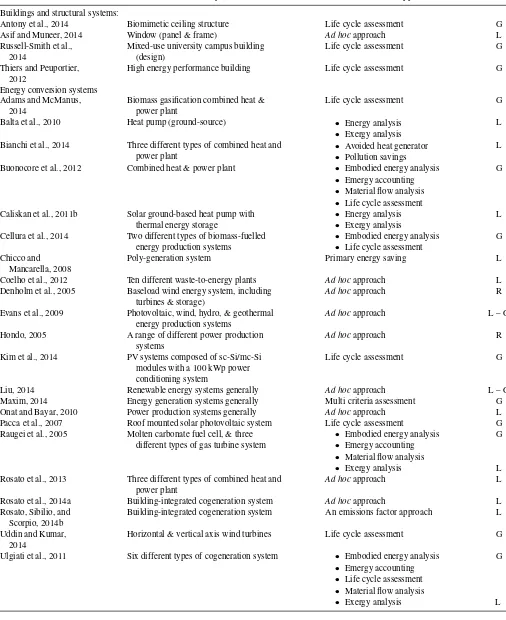
A sample of 43 sources (Table IV) evaluating the sustainabil-ity performance of technical systems (or elements thereof) was identified from the literature reviewed in Section 2. To arrive at a sample of indicators that is representative of cur-rent evaluation approaches (see Tables I and II), we selected sources based on their adopted methods (including both
for-mal evaluation methods and ad hoc approaches). Table IV shows the approaches represented in the sample.
To carry out the classification, we first extracted descrip-tions of the indicators applied in each source along with their associated metrics and units as reported by the authors. A total of 390 indicators were initially identified. In several cases, we observed indicators that were applied by different authors but had similar descriptions/metrics. For instance, numerous life cycle assessment (LCA) indicators were found to be applied by multiple authors providing similar descriptions, including: (i) global warming potential [Thiers and Peuportier, 2012; Russell-Smith et al., 2014; Antony et al., 2014; Ofori-Boateng and Lee, 2014; Kim et al., 2014]; (ii) ozone depletion poten-tial [Cellura et al., 2014; Russell-Smith et al., 2014; Ofori-Boateng and Lee, 2014]; (iii) acidification potential [Thiers and Peuportier, 2012; Cellura et al., 2014; Antony et al., 2014; Ofori-Boateng and Lee, 2014]; and (iv) eutrophication potential [Thiers and Peuportier, 2012; Cellura et al., 2014; Antony et al., 2014; Ofori-Boateng and Lee, 2014]. We did not systematically identify and remove similar/overlapping indicators, largely for the purposes of completeness and thor-oughness given nuances between different authors. However, 66 indicators were excluded from the classification exercise for the following reasons:
• Not enough information was provided to classify the indicator, for example, no formal definition or units • The indicator focused on purely technical aspects rather
than those relevant from a sustainability perspective (this was to be expected given that a number of sources openly aim to evaluate both sustainability/environmental perfor-mance and technical perforperfor-mance)
• Rather than material and/or energetic performance, the indicator focused on a technical system’s contribution to sustainable development (e.g., a focus on social and economic impacts) or socio-economic development gen-erally (e.g., a focus on financial aspects)
• The indicator focused on measuring something that may influence system performance, but is not performance
per se, for example, the availability of an energy resource [Onat and Bayar, 2010]
We attempted to classify the remaining 324 indicators with respect to the S-CPMatrix (Table III). In classifying the indi-cators, we interpreted their descriptions and associated met-rics to identify: (i) which of the generic sustainability goals they may relate to, if any; (ii) what element of performance they measure, that is, efficiency or effectiveness, based on the definitions provided in Section 2.2; and (iii) whether their metrics and measures align with those proposed in the S-CPMatrix. Table VI presents several illustrative examples of the classification process.
3.2.2. Outcome
Table V. Indicator Classification Sample
Source Technical System Evaluation Method/Approach Scale
Buildings and structural systems:
Antony et al., 2014 Biomimetic ceiling structure Life cycle assessment G
Asif and Muneer, 2014 Window (panel & frame) Ad hocapproach L
Russell-Smith et al., 2014
Mixed-use university campus building (design)
Life cycle assessment G
Thiers and Peuportier, 2012
High energy performance building Life cycle assessment G
Energy conversion systems Adams and McManus,
2014
Biomass gasification combined heat & power plant
Life cycle assessment G
Balta et al., 2010 Heat pump (ground-source) • Energy analysis L
• Exergy analysis Bianchi et al., 2014 Three different types of combined heat and
power plant
• Avoided heat generator
• Pollution savings
L Buonocore et al., 2012 Combined heat & power plant • Embodied energy analysis G
• Emergy accounting
• Material flow analysis
• Life cycle assessment Caliskan et al., 2011b Solar ground-based heat pump with
thermal energy storage
• Energy analysis
• Exergy analysis
L Cellura et al., 2014 Two different types of biomass-fuelled
energy production systems
• Embodied energy analysis
• Life cycle assessment
G Chicco and
Mancarella, 2008
Poly-generation system Primary energy saving L
Coelho et al., 2012 Ten different waste-to-energy plants Ad hocapproach L
Denholm et al., 2005 Baseload wind energy system, including turbines & storage)
Ad hocapproach R
Evans et al., 2009 Photovoltaic, wind, hydro, & geothermal energy production systems
Ad hocapproach L – G
Hondo, 2005 A range of different power production systems
Ad hocapproach R
Kim et al., 2014 PV systems composed of sc-Si/mc-Si modules with a 100 kWp power conditioning system
Life cycle assessment G
Liu, 2014 Renewable energy systems generally Ad hocapproach L – G
Maxim, 2014 Energy generation systems generally Multi criteria assessment G
Onat and Bayar, 2010 Power production systems generally Ad hocapproach L
Pacca et al., 2007 Roof mounted solar photovoltaic system Life cycle assessment G
Raugei et al., 2005 Molten carbonate fuel cell, & three different types of gas turbine system
• Embodied energy analysis
• Emergy accounting
G
• Material flow analysis
• Exergy analysis L
Rosato et al., 2013 Three different types of combined heat and power plant
Ad hocapproach L
Rosato et al., 2014a Building-integrated cogeneration system Ad hocapproach L
Rosato, Sibilio, and Scorpio, 2014b
Building-integrated cogeneration system An emissions factor approach L Uddin and Kumar,
2014
Horizontal & vertical axis wind turbines Life cycle assessment G Ulgiati et al., 2011 Six different types of cogeneration system • Embodied energy analysis G
• Emergy accounting
• Life cycle assessment
• Material flow analysis
• Exergy analysis L
Table V. Continued
Source Technical System Evaluation Method/Approach Scale
Fuel production systems:
Moss et al., 2014 Anaerobic digestion system Emergy accounting G
Ofori-Boateng and Lee, 2014
Biorefinery producing cellulosic ethanol & phytochemicals
• Exergetic life cycle assessment
G
• Life cycle assessment Heating and cooling systems:
Abdel-Salam and Simonson, 2014
Membrane liquid desiccant air conditioning system
Ad hocapproach L
Balta et al., 2010 Condensing and conventional boilers, and a solar collector
• Energy analysis
• Exergy analysis
L Caliskan et al., 2011a Four different types of air cooling system
for buildings
Exergy analysis L
Caliskan et al., 2012 Three different types of M-cycle air cooler • Energy analysis L
• Exergy analysis
• Emission factor approach G Shah et al., 2008 Three different residential heating and
cooling systems
Life cycle assessment G
Machining and industrial processing systems:
Rotella et al., 2012 Hard machining system Ad hocapproach L
S¨o˘g¨ut et al., 2012 Coal preparation unit for cement production
• Energy analysis
• Exergy analysis
L Propulsive and transportation systems:
Agarski et al., 2012 Five different car models Multi criteria assessment L
Aydin et al., 2013 Turboprop engine Exergy analysis L
Chandrasekaran and Guha, 2012
Turbofan engine Ad hocapproach L
Rahman et al., 2014 Compression ignition engine Ad hocapproach L
Singh et al., 2014 Biodiesel-fuelled HCCI engine Ad hocapproach L
Refining and distillation systems:
Li et al., 2012 Heterogeneous azeotropic distillation partitioned distillation column
• Energy analysis
• Exergy analysis
L Shahabi et al., 2014 Seawater reverse osmosis desalination
plant
Life cycle assessment R
Waheed et al., 2014 Crude oil distillation unit • Energy analysis L
• Exergy analysis
• IPCC CO2emissions
guidelines
analyzed were found to be classifiable to some extent. An overview of the archetypes found to be supported and un-supported is provided in Table VII alongside examples where applicable.
Upon closer examination, the 18 indicators whose metrics did not align with any of those proposed in the S-CPMatrix were seen to suggest additional metrics that had been over-looked. These are presented in Table VIII, alongside the indi-cators from the sample that they were based on. Furthermore, additional formulae were identified for two proposed metrics. First, in one source [Ofori-Boateng and Lee, 2014], it was observed that the wastefulness metric was computed as the ratio of passive resources to waste produced rather than the ratio of waste produced to passive resources consumed as proposed in the matrix (although the latter formula was found to be supported as shown in Table VII above). Second, it
was also observed that the resource productivity metric was computed via the following equation rather than as the ratio of intended output produced to passive resources consumed:
1 − ( WL
P RL,R,G), whereWLis the amount of a particular type of
waste produced by the system at the local scale, andPRL,R,G
is the amount of a particular passive resource consumed at the local, regional, or global scale. Note that whilst the au-thors measure waste production at the local scale, it may also be measured at regional and global scales as noted in Section 3.1.
The 19 indicators (5.9%) that we were unable to immedi-ately classify were found to suggest additional SPI archetypes and a sustainability goal that were not initially identified from the S-Cycle model in Section 3.1. First, one indicator was seen to suggest an additional SPI in relation to the goal
T a ble VI. Examples from the Indicator C lassification P rocess Ev aluation M ethod Reported Indicator Reported Definition Source Performance Element S -CPMatrix G oal SPI Archetype S-CPMatrix Metric Material flo w analysis T otal abiotic material requirement Grams o f abiotic material consumed p er year Buonocore et al., 2012 Ef fecti v eness M inimize external resource use Resource consumption Resource consumption rate Ex er gy ef ficienc y E x er g y ef fi cienc y Ratio o f total useful ex er gy output to total ex er g y input A ydin et al., 2013 Ef ficienc y M inimize external resource use Resource ef ficienc y R esource producti vity Ex er gy ef ficienc y R eco v erable ex er g y ratio Ratio of re cove ra b le ex er gy to total ex er gy input A ydin et al., 2013 Ef fecti v eness M aximize self-suf ficienc y Intended resource consumption Intended resource fraction Emer gy accounting E mer g y from local rene w able resources Sum o f all local rene w able emer gy inputs to system per y ear Buonocore et al., 2012 Ef fecti v eness M inimize rene w able resource use Rene w able resource consumption Rene w able resource consumption rate Ener gy analysis T o tal ener g y loss S um of ener gy losses from the system in me g aw atts W aheed et al., 2014 Ef fecti v eness M inimize w aste produced W aste p roduction A bsolute w aste output Ad hoc approach Thermal ef fi cienc y Ratio of thermal ener gy produced to primary ener gy consumed Rosato et al., 2014a Ef ficienc y M inimize external resource use Resource ef ficienc y R esource producti vity Ad hoc approach F o ssil fuel consumption b y treated w aste (system output) Kilo w att-hours o f electricity consumed p er tonne of w aste treated Coelho et al., 2012 Ef ficienc y M inimize nonrene w able resource use Nonrene w able
resource efficienc
y
Resource
[image:17.594.126.466.60.726.2]Table VII. List of Supported and Unsupported SPI Archetypes and Metrics
SPI Archetypes Metrics Examples Sources
IO production Absolute IO output Total exergy output Ofori-Boateng and Lee, 2014
IO production rate Exergy output rate Caliskan et al., 2012 Relative IO production Electricity generation by treated
waste
Coelho et al., 2012
Passive resource consumption Absolute PR input Cumulative energy demand Thiers and Peuportier, 2012; Antony et al., 2014
Energy payback time Energy payback period Adams and McManus, 2014; Kim et al., 2014
Relative PR consumption Environmental loading ratio Ulgiati et al., 2011; Buonocore et al., 2012; Moss et al., 2014 PR consumption rate Energy consumption per day Caliskan et al., 2012 Active resource consumption N/A (future research) Wear rate Rotella et al., 2012 Passive resource efficiency Resource intensity Material intensity, abiotic factor Raugei et al., 2005 Resource productivity Primary energy efficiency Denholm et al., 2005
Exergy efficiency Ofori-Boateng and Lee, 2014
NRR consumption Absolute NRR input Fossil fuel consumption Kim et al., 2014
NRR consumption rate Emergy from local nonrenewable resources (per year)
Buonocore et al., 2012
NRR fraction Currently unsupported –
NRR efficiency NRR intensity Embodied energy per MJ of
electricity
Buonocore et al., 2012 NRR productivity EROI of electricity Buonocore et al., 2012
RR consumption Absolute RR input Water consumption Thiers and Peuportier, 2012
RR consumption rate Total water demand (per year) Buonocore et al., 2012 RR fraction Energetic renewability ratio Balta et al., 2010
RR efficiency RR intensity Water demand per MJ of
electricity generated
Buonocore et al., 2012
RR productivity Currently unsupported –
IR production Absolute passive IR output Currently unsupported –
Passive IR production rate Currently unsupported –
IR consumption Passive IR fraction Recoverable exergy ratio Aydin et al., 2013 Waste production Absolute W output Carbon dioxide equivalent
emissions
Rosato et al., 2014b W concentration (new) NOx concentration Bianchi et al., 2014
W intensity CO2emission intensity Uddin and Kumar, 2014
W production rate CO2emissions rate Waheed et al., 2014
Resource inefficiency Wastefulness Waste exergy ratio Aydin et al., 2013
Thermodynamic sustainability index
Ofori-Boateng and Lee, 2014
an indicator termed “wear rate,” measuring the amount of material worn off the cutting component of a hard machin-ing system durmachin-ing operation. The cuttmachin-ing component may be viewed as an active resource in the machining system’s activity, transforming a workpiece (i.e., passive resource) into a machined component (i.e., intended output). Thus, the wear rate indicator appears to measure the consumption of active resources during the operation phase of the life cycle (i.e., at the local scale). This is suggestive of an additional SPI archetype, that is,active resource consumptionin relation to the goalminimize overall resource use.
Second, as discussed in Section 3.1, accumulations of waste within a SoI may potentially disrupt the functioning of system activities. Specifically, excess waste can contam-inate an activity’s resource input, which may in turn lead to
![Figure 2.Ulgiati et al. [2011: 177] highlight that the “value of a givenindicator is only ‘true’ at the scale at which it is calculated.”](https://thumb-us.123doks.com/thumbv2/123dok_us/1457789.98473/5.594.42.549.79.354/figure-ulgiati-highlight-value-givenindicator-true-scale-calculated.webp)