City, University of London Institutional Repository
Citation: Dabasia, Priya (2014). A study of the role of advanced technologies in glaucoma
case-finding. (Unpublished Doctoral thesis, City University London)This is the accepted version of the paper.
This version of the publication may differ from the final published
version.
Permanent repository link: http://openaccess.city.ac.uk/12364/
Link to published version:
Copyright and reuse: City Research Online aims to make research
outputs of City, University of London available to a wider audience.
Copyright and Moral Rights remain with the author(s) and/or copyright
holders. URLs from City Research Online may be freely distributed and
linked to.
A study of the role
of advanced technologies
in glaucoma case-finding
Priya L Dabasia
Submitted for the degree of
Doctor of Philosophy
December 2014
City University London
Division of Optometry and Visual Science
Contents
Page number
Contents 2
List of Tables 6
List of Figures 9
Acknowledgements 13
Declaration 15
Abstract 16
Abbreviations 17
Chapter 1: Introduction
1.1 Epidemiology of glaucoma 21
1.2 Classification and clinical features of glaucoma 23
1.3 Primary open angle glaucoma 23
1.3.1 Risk factors for the development of glaucoma 25
1.4 Primary angle closure and angle closure glaucoma 26
1.4.1 Risk factors for the development of angle closure glaucoma 28
1.5 Structural changes in glaucoma and their assessment 29
1.6 Functional changes in glaucoma and their assessment 31
1.7 Measurement of intraocular pressure 34
1.8 Screening for glaucoma 35
1.8.1 Primary open angle glaucoma 35
1.8.2 Angle closure glaucoma 36
1.9 Case-‐finding strategies for glaucoma by UK optometrists 37
1.9.1 Primary open angle glaucoma 37
1.9.2 Angle closure glaucoma 39
1.10 Increasing demand for glaucoma services in secondary care 40
1.11 Aims of the thesis 41
Chapter 2: An investigation of the use of standard and specialist equipment by UK
optometrists
2.1 Introduction 43
2.2 Methods -‐ a survey of current and anticipated use of standard and specialist equipment and IT by UK optometrists, 2013
47
2.3 Methods – the College of Optometrists (CoO) Clinical Practice survey, 2014 52
2.4 Statistical analysis 55
2.5 Results -‐ a survey of current and anticipated use of standard and specialist equipment and IT by UK optometrists, 2013
56
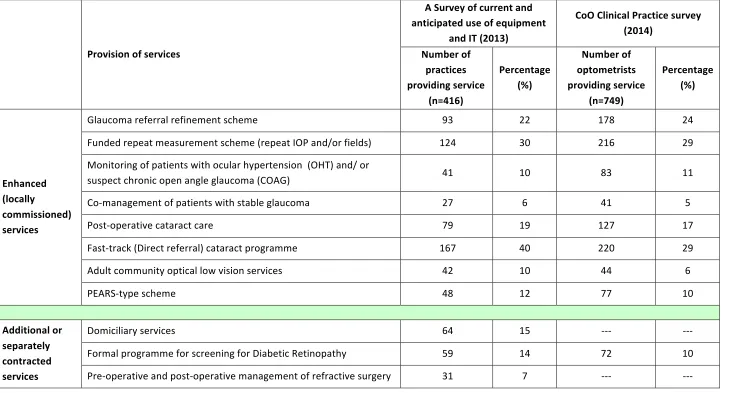
2.5.1 Provision of services 56
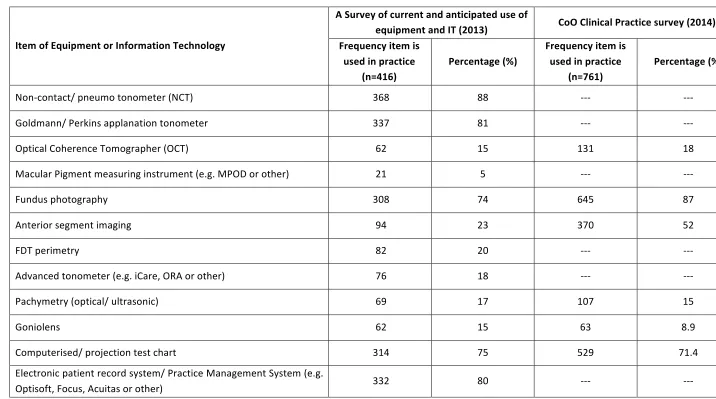
2.5.2 Standard ophthalmic equipment 59
2.5.3 Specialist equipment 59
2.5.4 Information technology 62
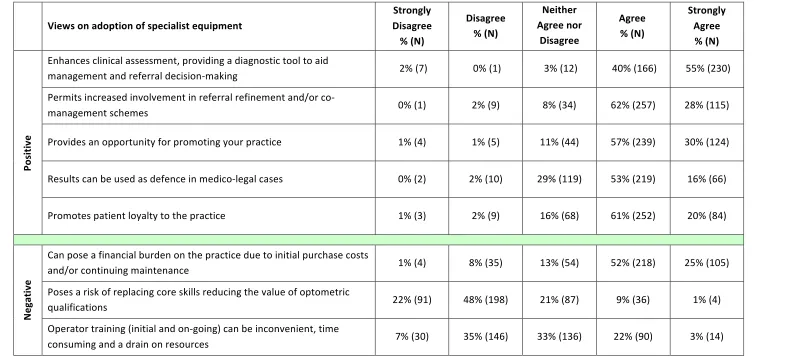
2.5.5 Views on the use of equipment and IT in optometric practice 62
2.5.6 Referrals 65
2.5.7 Use of the internet 65
2.5.8 Variations between countries 65
2.6 Results – the College of Optometrists (CoO) Clinical Practice survey, 2014 67 2.6.1 Use of instrumentation for the detection of ocular disease and
abnormality, and the measurement of refractive error and dispensing of optical aids
67
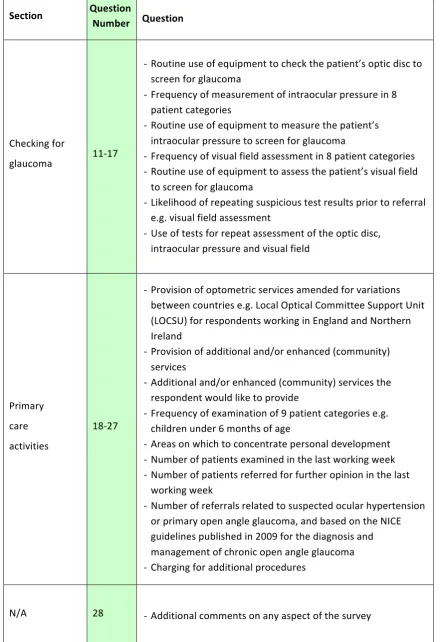
2.6.2 Checking for glaucoma 68
2.6.3 Primary care activities 69
2.6.4 Variations between countries 69
2.6.5 Additional comments 70
2.7 Discussion 71
2.7.1 Changes in service provision 75
2.7.2 Type of practice 76
2.7.3 Involvement in enhanced and additional schemes for service provision
77
2.7.4 Changes to glaucoma case detection and the influence of the NICE guideline
78
2.7.8 Strengths and limitations 89
2.7.9 Conclusions 91
Chapter 3: Performance of advanced technologies to improve case-‐detection of primary
open angle glaucoma
3.1 Introduction 92
3.2 Methods 97
3.2.1 Index tests 98
3.2.2 Reference standard ophthalmic examination 106 3.2.3 Validation of the reference standard examiner 108 3.2.4 The preliminary iVue normal database (NDB) study 109
3.2.5 Sample size calculation 111
3.2.6 Statistical analysis (main study) 112
3.3 Results 114
3.3.1 Basic index test data 118
3.3.2 Diagnostic performance of index tests 122 3.3.3 Combining index test results for detection of POAG 135
3.3.4 User acceptability survey 137
3.4 Discussion 139
3.4.1 Diagnostic effectiveness of visual function tests 140 3.4.2 Diagnostic effectiveness of iVue OCT 143 3.4.3 Diagnostic effectiveness of ORA 146 3.4.4 A summary of the diagnostic performance of index tests 147
3.4.5 Combining index test data 147
3.4.6 Implications for screening and case-‐finding of POAG 149
3.4.7 Strengths and limitations 153
3.4.8 Conclusions 154
Chapter 4: Non-‐contact screening methods for the detection of narrow anterior chamber
angles4.1 Introduction 155
4.2 Methods 160
4.2.1 Screening methods 161
4.2.2 Diagnostic definitions 169
4.2.3 Sample size calculation 170
4.2.4 Statistical analysis 170
4.3 Results 173
4.3.1 Diagnostic effectiveness of slit-‐lamp based index tests 179 4.3.2 Diagnostic effectiveness of imaging-‐based index tests 182
4.3.3 Combining test results 190
4.4 Discussion 193
4.4.1 Diagnostic performance of slit-‐lamp biomicroscope based screening tests
194
4.4.2 Diagnostic performance of imaging-‐based systems 197 4.4.3 Case-‐finding for narrow anterior chamber angles 200
4.4.4 Strengths and limitations 204
4.4.5 Conclusions 206
Chapter 5: Summary and directions for future work
5.1 Summary 207
5.2 Directions for future work 211
References 214
List of Appendices 234
Appendix A 235
Appendix B 251
Appendix C 261
List of publications and presentations 270
Conference presentations: Published abstracts 270
Other presentations 271
List of Tables
Page number
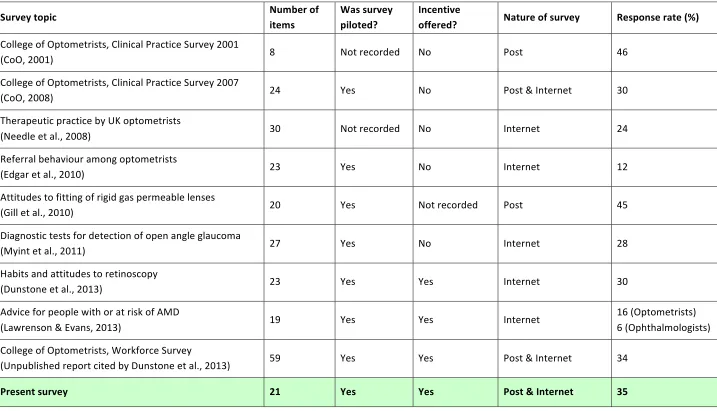
Table 2.1 Features of the present study compared with previous UK-‐
based practitioner surveys, ordered by date of publication
48
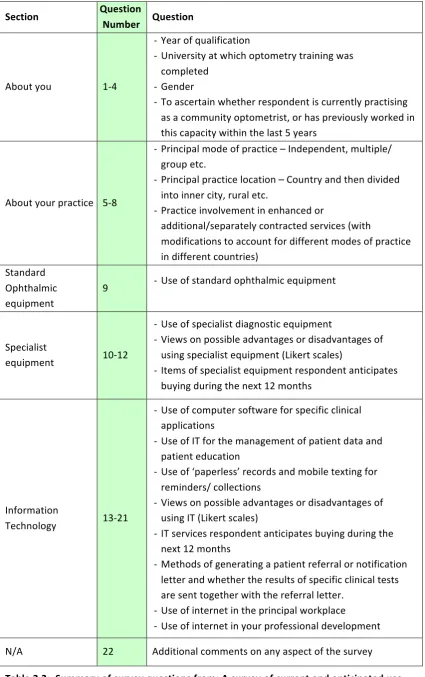
Table 2.2 Summary of survey questions from; A survey of current and anticipated use of equipment and IT by UK optometrists (2013)
51
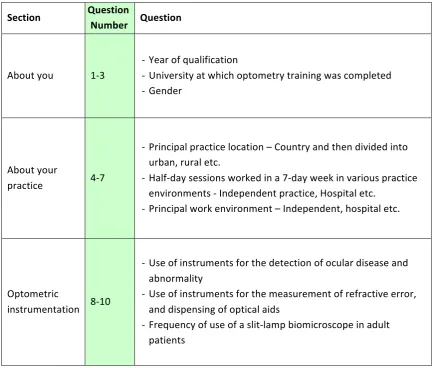
Table 2.3 Summary of survey questions from; The College of Optometrists (CoO) Clinical Practice survey, 2014
53-‐54
Table 2.4 Provision of enhanced (locally commissioned) and additional/ separately contracted services
58
Table 2.5 Relative frequency of the use of items of equipment and information technology by community optometrists
61
Table 2.6a Views on the adoption of specialist equipment
63
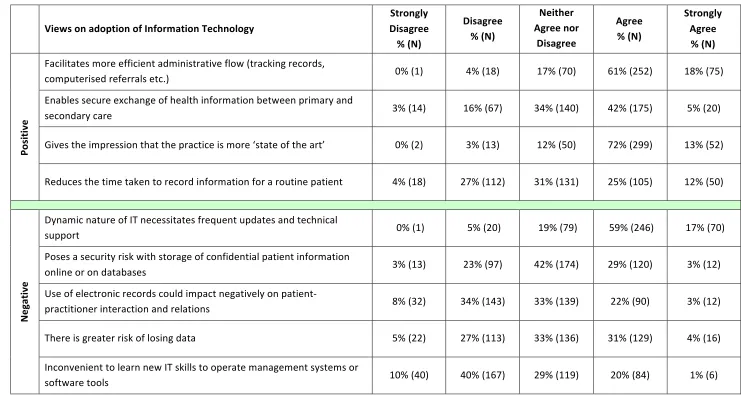
Table 2.6b Views on the adoption of IT
64
Table 2.7 Relative frequency of the use of equipment in community optometric practice in present and past surveys
74
Table 3.1 A summary of index test quality indicators and cut-‐offs to detect POAG and suspected POAG used in the present study
98
Tables 3.2a – 3.2b
Kappa agreement for classification of glaucoma between reference standard optometrist and consultant ophthalmologist
Table 3.3b Summary clinical data for each of the four subject groups
116
Table 3.4 Non-‐glaucoma related ocular pathology observed during the reference standard ophthalmic examination
117
Table 3.5 Summary data of visual function test reliability and repeat testing
119
Table 3.6 Sensitivity, specificity and likelihood ratios for the FDT, MMDT and iVue SD-‐OCT presented with 95% confidence intervals for the detection of POAG
124
Table 3.7a Sensitivity at 90% and 95% specificity for each index test parameter for detection of POAG and POAG/ suspect POAG combined
132
Table 3.7b Partial area under the ROC curve (PAUROC) data for ranges starting from 90% and 95% specificity for each index test parameter for detection of POAG and POAG/ suspect POAG combined
133
Table 3.8 Summary of combined analysis of index test data using Bayesian probabilistic reasoning for detection of POAG and suspect POAG/ POAG combined
136
Table 3.9 Aggregated Likert scale responses to index test acceptability survey in response to the statements a) ‘The test was uncomfortable’, b) ‘the test was too long’, and c) ‘the test was difficult to undertake’
138
Table 3.10a Sensitivity at set specificity data using best performing RNFL thickness parameters reported in the literature and compared with present study findings for detection of glaucoma
thickness parameters reported in the literature and compared with present study findings for detection of glaucoma
Table 4.1a Demographic data for narrow and open angle subject groups using two different classifications of a narrow anterior chamber angle by gonioscopy
174
Table 4.1b Clinical data for narrow and open angle subject groups using different classifications of a narrow anterior chamber angle by gonioscopy
175
Table 4.2 Distribution of gonioscopic Shaffer grade by quadrant between subject groups (classified using the ISGEO gonioscopy classification)
176
Table 4.3 Sensitivity, specificity and likelihood ratios for the van Herick technique and Smith’s test using various cut-‐offs and presented with 95% confidence intervals
181
Table 4.4 Sensitivity, specificity and likelihood ratios for Smith’s test, Pentacam imaging and Visante OCT using the Youden cut-‐off and presented with 95% confidence intervals
185
Table 4.5a Sensitivity at 90% and 95% specificity data for each index test parameter using the two gonioscopic classifications for a narrow angle
188
Table 4.5b Partial area under the ROC curve (PAUROC) data for each index test parameter using the two gonioscopic classifications for a narrow angle
189
Table 4.6 Aggregated Likert scale responses to index test acceptability survey in response to the statements a) ‘The test was comfortable’ and b) ‘the test was quick, with mean time taken to capture data of both eyes
List of Figures
Page number
Figure 1.1 A glaucomatous optic disc showing concentric enlargement of
the cup and inferior peripapillary haemorrhages, with the corresponding Humphrey C24-‐2 standard visual field plot
24
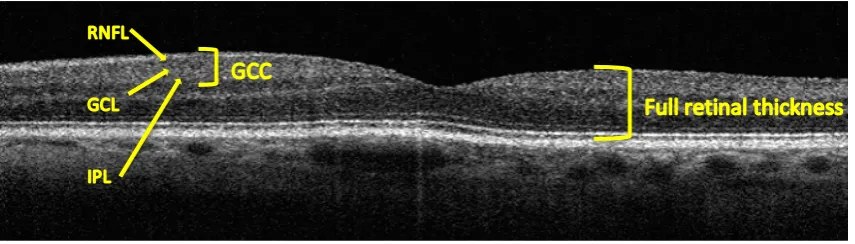
Figure 1.2 Segmentation of the ganglion cell complex (GCC) layer comprised of the retinal nerve fibre layer (RNFL), ganglion cell layer (GCL), and inner plexiform layer (IPL)
31
Figure 2.1 Sub-‐group analysis by country, practice type and provision of services (A survey of current and anticipated use of equipment and IT by UK optometrists, 2013)
66
Figure 2.2 Sub-‐group analysis by country, practice type and provision of services (College of Optometrists (CoO) Clinical Practice survey, 2014)
70
Figure 3.1 Study flow diagram
97
Figure 3.2 Patel et al. 2000 scoring algorithm of FDT suprathreshold results
100
Figures 3.3a – 3.3b
iVue SD-‐OCT scan outputs; a) Glaucoma ONH retinal nerve fibre layer thickness (RNFL), and b) iWellness (composite of GCC and retina map protocols)
103
Figure 3.4 Ocular Response Analyser (ORA) graphical plot comprising 3 curves: pressure of air applied to the cornea (green), raw signal of applanation detection system (red), and a filtered version of the latter to identify optimum points of applanation (blue)
Figure 3.5 Boxplots of the test duration for visual function tests
119
Figure 3.6 Distribution of mean RNFL thickness between quadrants with associated 95% confidence intervals
120
Figures 3.7a – 3.7b
Boxplots of ORA biomechanical parameter measurements between the four diagnostic subject groups; a) CH and b) CRF data
121
Figures 3.8a – 3.8b
Sensitivity-‐specificity plots for the FDT (number of missed locations) and MMDT (global PTD) for detection of POAG
123
Figure 3.9 Sensitivity-‐specificity plots for the two best-‐performing iVue SD-‐OCT GCC and RNFL parameters for detection of POAG
126-‐127
Figure 3.10 Sensitivity-‐specificity plots for ORA parameters for detection of POAG by corneal biomechanical parameters of a) Corneal hysteresis (CH), and b) Corneal resistance factor (CRF)
128
Figure 3.11 ROC curves (plotting sensitivity against 1-‐specificity) for detection of POAG and POAG/ suspect POAG combined using visual function tests (FDT, Patel et al. 2000 score and MMDT, global PTD), best performing iVue SD-‐OCT RNFL and GCC parameters and ORA corneal hysteresis (CH)
129-‐130
Figures 3.12a – 3.12c
Index test diagnostic effectiveness comparisons using ROC curves with sensitivity at set specificity estimates and associated 95% confidence intervals
134-‐135
Figure 3.13 Venn diagrams presenting combined index test results for identification of POAG using various cut-‐offs; FDT (1 or more missed location at any level), MMDT (global PTD ≥3.0), iVue SD-‐ OCT GCC inferior hemifield and RNFL inferior quadrant thickness (P<1%), ORA CH (<9.2)
Figure 3.14 Sensitivity and specificity estimates with associated 95% confidence intervals for detection of OAG using FDT C20-‐5 and a cut-‐off of one or more location(s) missed at any level of significance
141
Figure 4.1 Study flow diagram
160
Figure 4.2 Schematic representation of Grade 4 to Grade 1 anterior chamber angles as observed using the van Herick test
162
Figure 4.3 Photographic representation of Smith’s technique displaying a) separated images on the corneal and lenticular surfaces, and b) at the end-‐point where the two images appear to just meet
163
Figure 4.4 Image of Pentacam anterior segment capture with temporal and nasal ACA angle tools
165
Figure 4.5 A Visante OCT cross-‐section captured using ‘Anterior segment single mode’ with angle tool markers; AC-‐angle-‐180° and AC-‐ angle-‐0° and central anterior chamber depth caliper
167
Figure 4.6 A schematic representation of a gonioscopic view of a Grade 4 (open) to Grade 1 (narrow) anterior chamber angle, highlighting the main landmarks.
169
Figure 4.7 Boxplots of the time taken to capture data from both eyes using the four index tests
177
Figure 4.8 Bland-‐Altman plots evaluating repeatability of semi-‐ automated measurements for the first scan captured of the right eye by Visante OCT (N=36): a) Temporal ACA, b) Central ACD
Figure 4.9 Sensitivity-‐specificity plots for the van Herick technique and Smith’s test using the ISGEO gonioscopy classification
180
Figure 4.10 Sensitivity-‐specificity plots for imaging-‐based parameters using ISGEO gonioscopy classification
183-‐184
Figure 4.11 Bland-‐Altman plot comparing temporal and nasal ACA measurements using Pentacam imaging
186
Figure 4.12 ROC curves (plotting sensitivity against 1-‐specificity) constructed for each index parameter using the two gonioscopic classifications of a narrow angle
186-‐187
Figures 4.13a – 4.13b
ROC curves showing specificity at 90% sensitivity with 95% confidence intervals for a) van Herick test and Visante OCT ACA, and b) van Herick and Smith’s tests
189-‐190
Figure 4.14 Venn diagrams presenting agreement between van Herick and Smith’s test, and best performing imaging-‐based parameters for the detection of narrow angles using gonioscopy classifications based on the ISGEO and clinical opinion
191
Figure 4.15 Sensitivity and specificity estimates with associated 95% confidence intervals for detection of narrow anterior chamber angles using the van Herick cut-‐off point of ≤grade 2 (≤25%)
195
Figure 4.16 Cross-‐section of an open ACA acquired using a) iVue (800nm) OCT, b) Visante (1310nm) OCT (Image courtesy of Shima Shah, Moorfields Eye Hospital), shown with a histological section of the anterior chamber region, with the angle structures labeled
202
Acknowledgements
First and foremost, I would like to express my deepest gratitude to my supervisors
Professor John Lawrenson and Professor David Edgar for providing me with this
opportunity, and encouraging my research with unfounded patience and
understanding. It has been my privilege to learn from their knowledge and experience,
and I am incredibly proud of what we have achieved together. I am grateful to my co-‐
supervisor from Moorfields Eye Hospital, Professor David Garway-‐Heath, for offering
invaluable advice over the course of the project. A very special thanks to Mr Ian
Murdoch for providing the opportunity to collaborate on a study, and for giving so
much of his time to guide Chapter 4 with unbounded enthusiasm and words of
inspiration.
I am especially grateful to the College of Optometrists for their support and
cooperation with the distribution of the surveys, and for providing the funding to
conduct this work. To my examiners Dr Mark Dunne and Professor David Crabb, thank
you for making the experience so enjoyable, and for enabling the opportunity to learn
from your expertise in the field.
Declaration
I grant powers of discretion to the Division of Optometry and Visual Science, City
University London to allow this project to be copied in whole or in part without further
reference to me. This permission covers only single copies made for study purposes,
subject to the normal consideration of acknowledgement.
Abstract
In the UK, 11,000 new cases of open angle glaucoma (OAG) are diagnosed annually in
people aged 40 to 70 years. However, two-‐thirds of UK OAG cases may remain
undiagnosed, highlighting the need for improved detection. UK optometrists generate
more than 95% of referrals for suspected glaucoma and ocular hypertension. Case-‐
detection of glaucoma may be improved by using screening tests with better
diagnostic accuracy, but standardised protocols for advanced technologies used alone,
or in combination, to detect glaucoma are lacking.
Chapter 2 reports on two cross-‐sectional surveys of UK community optometrists,
determining
the equipment and information technology (IT) used in optometric
practice, and exploring the rationale behind the uptake of ophthalmic equipment and
IT. UK optometrists are increasingly investing in new ophthalmic equipment and IT,
including the latest technology. Longitudinal comparisons with previous surveys
revealed an increase in use of Optical coherence tomography (OCT), Goldmann/
Perkins tonometry and pachymetry. Variations in responses reflected differences in
General Ophthalmic Services provision across the UK and involvement in community
enhanced services. There was general agreement that specialised equipment
enhances clinical care and permits increased involvement in enhanced services, but
initial costs and ongoing maintenance can be a financial burden.
Chapter 3 summarises a prospective cross-‐sectional study investigating the diagnostic
accuracy of four advanced technologies for detecting POAG, used alone and in
combination, in a representative sample (N=505) of the UK primary care population
aged ≥60 years, and compared to a reference standard ophthalmic examination.
Structural imaging using the iVue SD-‐OCT provided better discrimination between
POAG and non-‐POAG/ non-‐OHT subjects than either visual function test (Frequency
Doubling Technology or Moorfields Motion Displacement Threshold). The low
specificity of visual function tests precludes their use in isolation, but their use
together with objective evaluation of optic nerve head structure by SD-‐OCT should
improve case-‐detection of glaucoma.
Chapter 4 describes a case-‐control study (N=78) evaluating the diagnostic effectiveness
of two slit-‐lamp based techniques (van Herick and Smith’s) and imaging-‐based systems
(Pentacam and Visante OCT) when compared to the reference standard gonioscopic
observation, to screen for individuals at-‐risk of angle closure glaucoma (ACG). Overall,
the van Herick test and Visante OCT, used either alone or in combination, showed best
discrimination between narrow and open angles. Recording of either the temporal or
nasal van Herick grade would be sufficient for case-‐finding in at-‐risk individuals.
Chapter 5 summarises preceding chapters and details recommendations for future
research.
Abbreviations
ACA
Anterior chamber angle
ACD
Anterior chamber depth
ACG
Angle closure glaucoma
ACV
Anterior chamber volume
AGIS
Advanced Glaucoma Intervention Study
AMD
Age-‐related macular degeneration
ANOVA
Analysis of variance
AoA
American Optometric Association
AOP
Association of Optometrists
AS-‐OCT
Anterior segment Optical coherence tomography
AUROC
Area under the receiver operating characteristic curve
BSV
Best Signal Value
CCG
Clinical Communications Gateway
CCT
Central corneal thickness
CET
Continuing Education and Training
CGS
Canadian Glaucoma Study
CH
Corneal hysteresis
CHRPE
Congenital hypertrophy of the Retinal Pigment Epithelium
COAG
Chronic open angle glaucoma
CoO
College of Optometrists
CP
Clinical Practice
CPD
Continued professional development
CRF
Corneal resistance factor
DBR
Diabetic retinopathy
DCT
Dynamic Contour Tonometry
DGH
David Garway-‐Heath
DOH
Department of Health
ECR
Electronic care records
EGS
European Glaucoma Society
EHR
Electronic health record
eReferrals
Electronic referrals
ESTA
Enhanced Standard Threshold Algorithm
ETDRS
Early Treatment Diabetic Retinopathy Study
FDT
Frequency Doubling Technology
FLV
Focal loss volume
GAT
Goldmann applanation tonometry
GCC
Ganglion cell complex
GIST
Glaucoma Inheritance Study in Tasmania
GLV
Global loss volume
GOC
General Optical Council
GON
Glaucomatous optic neuropathy
GOS
General Ophthalmic Services
GP
General Practitioner
HES
Hospital eye service
HFA
Humphrey Field Analyser
HRT
Heidelberg Retina Tomograph
HTA
Health Technology Assessment
IGA
International Glaucoma Association
IOP
Intraocular pressure
IOPcc
Corneal-‐compensated intraocular pressure
IOPg
Goldmann-‐correlated intraocular pressure
ISGEO
International Society of Geographical and Epidemiological
Ophthalmology
IT
Information Technology
LACD
Limbal anterior chamber depth
LOCS
Lens opacities classification system
LOCSU
Local Optical Committee Support Unit
logMAR
Logarithm of the Minimum Angle of Resolution
LPI
Laser peripheral iridotomy
MD
Mean deviation
MPOD
Macular pigment optical density
NAHIT
The National Alliance for Health Information Technology
NCT
Non-‐contact tonometry
NDB
Normative database
NHS
National Health Service
NICE
National Institute for Health and Care Excellence
NIHR
National Institute for Health Research
NRR
Neuro-‐retinal rim
NSC
National Screening Committee
NTG
Normal tension glaucoma
OAG
Open angle glaucoma
OCT
Optical Coherence Tomography
OHT
Ocular hypertension
OHTS
Ocular Hypertension Treatment Study
ONH
Optic nerve head
ONS
Office for National Statistics
ORA
Ocular Response Analyser
PAC
Primary angle closure
PACG
Primary angle closure glaucoma
PACS
Primary angle closure suspect
PAS
Peripheral anterior synechiae
pAUROC
Partial area under the receiver operating characteristic curve
PCT
Primary Care Trust
PEARS
Primary Eyecare Acute Referral Service or Primary Eyecare
Assessment and Referral Service
PhD
Doctor of Philosophy
PHE
Public Health England
PLD
Priya Laxmidas Dabasia
POAG
Primary open angle glaucoma
PPV
Positive predictive value
PSD
Pattern Standard Deviation
QS
Quality Score
RCOphth
Royal College of Ophthalmologists
RCT
Randomised controlled trial
RNFL
Retinal nerve fibre layer
ROC
Receiver Operating Characteristic
SAP
Standard automated perimetry
SCI
Scotland’s centralized internet
SD
Standard deviation
SD-‐OCT
Spectral domain Optical coherence tomography
SE
Standard error
SITA
Swedish Interactive Thresholding Algorithm
SLO
Scanning laser ophthalmoscope
SLP
Scanning laser polarimetry
SQI
Scan Quality Index
STARD
Standards for the Reporting of Diagnostic Accuracy Studies
UK
United Kingdom
US
United States
VF
Visual field
VPN
Virtual Private Network
WECI
Welsh Eyecare Initiative
WEHE
Welsh Eye Health Examination
WHO
World Health Organisation
WN
Winnie Nolan
WS
Waveform Score
Chapter 1: Introduction
1.1 Epidemiology of glaucoma
Glaucoma is the second leading cause of blindness worldwide (Quigley & Broman, 2006, WHO, 2012), and is considered a major public health problem. The World Health Organisation (WHO) estimates that 2% of visual impairment and 8% of blindness is attributed to glaucoma (WHO, 2012). The global prevalence for all glaucomas in people aged 40 to 80 years is estimated to be 3.54% (Tham et al., 2014), with open angle glaucoma (OAG) being the commonest cause (Quigley & Broman, 2006, Tham et al., 2014). Worldwide, the number of people with glaucoma (aged 40 to 80 years) is projected to increase by 74% from 64.3 million in 2013 to 111.8 million in 2040 (Tham et al., 2014).
In the UK, glaucoma is responsible for approximately 10% of blindness (severe sight impairment) registrations (NICE, 2009) and is the second commonest cause of certifiable severe sight impairment after age-‐related macular degeneration in England and Wales (Bunce et al., 2010). However, actual figures for severe sight impairment may be higher still given that the nature of visual morbidity resulting from glaucoma, notably the initial loss of non-‐central regions of visual field, the preservation of binocular field due to overlap between the nasal visual fields of the right and left eyes, and the asymmetric nature of the disease reduces the likelihood of registration compared to ‘more obvious’ loss of visual acuity (King et al., 2000). With age being an important risk factor for glaucoma, the number of people affected by the condition in the UK is expected to rise with the changing demographic of the population. The 2011 census demonstrated an increase in the number of people aged 65 years and older from 9.4 million in 2001 rising to 10.4 million in 2011 (ONS, 2011).
which symptoms of vision loss due to severe damage of the visual field and/or reduced visual acuity manifest at a more advanced stage.
The WHO estimates that of the 11.2 million people that will be bilaterally blind from glaucoma worldwide by the year 2020, nearly half of these cases will be attributed to angle closure mechanisms (WHO, 2007). These projections are based on the higher incidence of the condition in the populous country of China, together with other East and South East Asian countries where ACG is the predominant form of glaucoma (Foster & Johnson, 2001). The prevalence estimate for Angle Closure Glaucoma (ACG) in European-‐derived populations aged 40 years and older is 0.4% (Day et al., 2012), which corresponds to 130,000 cases in the UK. Although the condition is considered relatively uncommon in western populations, ACG is predicted to increase by 19% in the UK within the next decade due to increased longevity (Day et al., 2012).
Early detection and administration of treatment reduces the rate of progression of glaucomatous vision loss and visual field defects (2000, Heijl et al., 2002), which is likely to result in a better health-‐related quality of life for those persons affected by the condition. Long-‐term treatment is usually administered in the form of medical, laser or surgical interventions aimed to lower eye pressure to a level where further visual loss can be prevented. However, the cost of medical drug treatments for OAG and ocular hypertension (OHT) has seen an increase of 88% from £55.2 million in 2000 rising to £103.7 million in 2012 (Connor & Fraser, 2014). Fiscal factors, together with the need for lifelong review of patients affected by the chronic condition place a substantial burden on the NHS. As the use of resources and the direct costs of glaucoma management increase with worsening severity of disease (Lee et al., 2006b), early identification and treatment of glaucoma may provide potential economic savings.
The European Glaucoma Society defines glaucoma as “a group of diseases that result in a progressive optic neuropathy that causes characteristic changes in the optic nerve head and retinal nerve fibre layer” (EGS 2008). The pathogenesis of glaucoma is likely to be multifactorial (Fechtner & Weinreb, 1994), but the exact mechanism is not fully known.
Glaucoma is usually classified on the basis of the mechanism of damage, or aetiology. Clinically, gonioscopic observation of the anterior chamber angle is used to categorise glaucoma into open or closed angle groups. Further sub-‐division is based on whether the glaucoma is primary or secondary i.e. whether the glaucoma is the result of an underlying systemic and/ or ocular co-‐morbidity. Primary glaucomas account for 92% (Quigley & Broman, 2006) of all presentations and, as such, represent the predominant form of glaucoma detected by community optometrists.
For clarification of terminology used in this thesis, the term ‘Primary open angle glaucoma (POAG)’ is taken to be synonymous with ‘Chronic open angle glaucoma (COAG)’. The National Institute for Health and Clinical Excellence (NICE) published a clinical guideline (85) in 2009 (NICE, 2009) which led to the increased use of the term ‘COAG’. However, ‘POAG’ is used much more widely both in publications referenced in this thesis and in publications emerging from this thesis. For this reason, both terms are used in this thesis, to refer to the same condition, depending on the source of publication.
1.3 Primary open angle glaucoma
leaving an isolated temporal crescent, and central 5-‐degree island of vision (Figure 1.1).
Figure 1.1: A glaucomatous optic disc showing concentric enlargement of the cup and inferior peripapillary haemorrhages (image captured using Topcon TRC-‐NW8F), with the corresponding Humphrey C24-‐2 standard visual field plot
POAG is a bilateral condition but the severity of disease is typically asymmetric at the point of diagnosis and during its clinical course. The definitive mechanism of damage to ganglion cell axons is not fully known, but two main theories emerge from the literature. The mechanical theory proposes that loss of ganglion cell axons is the result of direct pressure-‐induced damage at the level of the lamina cribrosa. The vascular theory describes ischaemia of ganglion cell axons at the level of the optic nerve head as a result of microvascular changes and reduced perfusion. An alternative theory is cell ‘apoptosis’, or spontaneous degeneration of axons resulting from elevated IOP and impairment to axonal transport of neurotrophic factors (Munemasa & Kitaoka, 2012).
Normal tension glaucoma (NTG) is defined as a type of chronic OAG in which IOP has rarely been recorded above 21mmHg (statistical upper limit of the ‘normal’ range) (NICE 2009). However, researchers have debated whether NTG is a separate entity, or simply a variable phenotype in the spectrum of OAG (Wilson & Creighton, 2002, Shields, 2008).
[image:25.595.115.521.117.304.2]
or an observation group and, after monitoring both groups for 60 months, found a cumulative probability of developing POAG of 4.4% in the medically treated group, compared with 9.5% in the observation group (Kass et al., 2002). In England and Wales, prophylactic treatment is administered based on risk of conversion to manifest disease, determined by the IOP, age, and central corneal thickness in accordance with the NICE clinical guideline 85 (NICE, 2009).
1.3.1 Risk factors for the development of POAG
The onset of POAG is typically over the age of 40 years, with age consistently identified as an important risk factor for development of the disease in epidemiological surveys (Tielsch et al., 1991a, Gordon et al., 2002, Weinreb & Khaw, 2004, Rudnicka et al., 2006, Leske et al., 2008).
The risk of developing glaucoma and progression of the disease increases significantly with elevated IOP and fluctuating IOP (AGIS, 2000, Gordon et al., 2002, Bengtsson et al., 2007, Musch et al., 2011, Rao et al., 2013, Leidl et al., 2014). Moreover, it is presently the only modifiable risk factor for the treatment and management of the condition. Clinically, a reduction in IOP of 20-‐30% from the untreated pressure for POAG/COAG is considered standard practice (Heijl et al., 2002, Kass et al., 2002, CGS, 2006, NICE, 2009), with greater reductions required for more advanced disease (CGS, 2006).
Another important risk factor is ethnicity, whereby persons of Afro-‐Caribbean origin are at greater risk of developing glaucoma compared with White populations (Tielsch et al., 1991b, Gordon et al., 2002, Rudnicka et al., 2006, Leske, 2007). Furthermore, OAG presents at an earlier age (Quigley & Vitale, 1997), and demonstrates more rapid disease progression (Wilson et al., 1985) in persons of black origin compared with white populations. Interestingly, Rudnicka et al. reported a steeper increase in prevalence of OAG in white populations with age than compared with black populations (Rudnicka et al., 2006).
27% of previously diagnosed POAG patients were unaware of their true family history of glaucoma, raising the suggestion that a greater proportion of POAG in the adult population may be inherited than is reported (McNaught et al., 2000).
The Ocular Hypertension Treatment Study (OHTS) identified thinner central corneal thickness (CCT) as being a powerful predictor for conversion of OHT to POAG (Gordon et al., 2002). However, Medeiros and Weinreb (2012) have since warned that interpretation of CCT as an independent risk factor for the development of glaucoma may be misleading in view of the dependence of Goldmann tonometry measurements on CCT (Medeiros & Weinreb, 2012). Correction of the OHTS prediction model for CCT confirmed CCT as a risk factor for the development of glaucoma, but showed a lack of evidence to support the claim of CCT being a true independent risk factor for glaucoma (Medeiros & Weinreb, 2012).
Other risk factors identified in epidemiological studies include:
• Myopia (Mitchell et al., 1999, Weinreb & Khaw, 2004) – it has been proposed that structural differences that predispose an eye to myopia may also increase the susceptibility of the optic nerve to glaucomatous damage from elevated or normal IOP.
• Systemic diseases such as diabetes (Bonovas et al., 2004), hypertension (Dielemans et al., 1995, Bonomi et al., 2000b, Mitchell et al., 2004), migraine (Wang et al., 1997, Cursiefen et al., 2000) and Raynaud’s phenomenon. Systemic hypertension has been observed to reduce perfusion pressure at the level of the optic nerve head (Fuchsjager-‐Mayrl et al., 2004, Memarzadeh et al., 2010), while migraine and Raynaud’s may be linked to vasospasm.
• Gender – after adjusting for age males have a higher risk of OAG than females in white populations (Rudnicka et al., 2006, Leske et al., 2008).
1.4 Primary angle closure and angle closure glaucoma
the posterior (usually pigmented) trabecular meshwork (Foster et al., 2002).
Relative pupillary block is a term used to describe an increased resistance to aqueous flow through the pupil from the posterior to anterior chamber. This leads to increased pressure in the posterior chamber, causing the peripheral iris to bow forward, which narrows or occludes the angle. Relative pupillary block typically occurs in hyperopic eyes and is one of the most common mechanisms of angle closure, reported in approximately 90% of individuals diagnosed with primary ACG (Ritch et al., 1995, Nolan et al., 2000). Repeated contact between the iris and delicate structures of the trabecular meshwork can result in damage and abnormalities at a cellular level, including loss of endothelial cells and fusion of trabecular beams (Sihota et al., 2001, Hamanaka et al., 2011). These result in an elevated intraocular pressure and/ or the formation of irreversible adhesions representing complete obstructions of aqueous flow at points of contact, which are known as goniosynechiae, or, more commonly peripheral anterior synechiae (PAS) (Lee et al., 2006a). The term PACG only applies when PAC progresses to demonstrable glaucomatous optic neuropathy.
In common with all glaucoma disorders, treatment for ACG aims to prevent damage to the optic nerve and subsequent deterioration of the visual field. With timely detection of anatomically narrow angle eyes at risk of occlusion, and the subsequent administration of prophylactic therapy, the progression of the angle closure process to ACG can be arrested. An untreated PACS patient has an estimated 22% (Thomas et al., 2003) to 30% (Wilensky et al., 1996) chance of developing angle closure over 5 years. At the present time, laser peripheral iridotomy (LPI) is considered the most effective treatment to prevent the onset of ACG in predisposed individuals. Once angle closure has been diagnosed in one eye, it is common practice to perform a prophylactic procedure on the fellow eye to prevent it following suit, reducing the chances of an IOP rise in the long-‐term by over 85% (Ang et al., 2000). However, LPI is demonstrably less effective, and even considered suboptimal where manifest angle closure with evidence of functional damage to the drainage apparatus has already occurred, and in particular where there is evidence of glaucomatous optic neuropathy. The procedure can also be less beneficial in cases where angle closure is predominantly the result of non-‐ pupillary block mechanisms.
ACG is the result of anomalies in either the size or position of structures in the anterior segment, and assessment of angle width and configuration is an essential part of identifying those individuals at risk. Many population studies have identified common biometric characteristics that crowd the anterior segment, predisposing the eye to ACG (Lowe, 1970a, Congdon et al., 1996). These characteristics include shallow anterior chamber depth (ACD) defined as the distance between the corneal endothelium and anterior lens surface measured along the optical axis, anterior lens positioning, thickening of the crystalline lens, small corneal diameter, short axial length (hypermetropia) and small radius of curvature. Of these characteristics, shallow ACD has been documented as the cardinal risk factor in most ethnic groups (Nolan et al., 2006).
Age is a strong risk factor, as thickening of the crystalline lens with advancing age leads to crowding of anterior segment structures, and shallowing of the ACD by 0.35–0.50mm over a 50-‐year period (Lowe, 1970b). It has also been postulated that slackening of the zonules over time can induce further anterior movement of both the lens and iris structures (Lowe, 1970b, Markowitz & Morin, 1984).
Higher prevalences of occludable angles have also been repeatedly documented in females, and it is most likely that this can be attributed to an anatomically shallower ACD (Alsbirk, 1986, Oh et al., 1994).
It is well known that characteristics of the anterior chamber differ markedly among ethnic groups, whereby people of European lineage are anatomically distinct from those of both Asian and African descent. The predisposition of East Asian subjects to ACG may be explained by evidence that the iris joins more anteriorly to the scleral wall in this population, slightly more posteriorly in Afro-‐Americans and most posteriorly in Caucasians (Oh et al., 1994). The predominant pathological mechanism for angle closure also varies markedly with ethnicity (He et al., 2006b). When compared with Caucasians, angle closure in Asians is more likely to be the result of multiple mechanisms rather than pupil block alone. For example, a review paper reported that, in studies examining Chinese subjects, over 50% of cases of ACG were the result of combined mechanisms, including other peripheral non-‐pupil block mechanisms such as anteriorly positioned ciliary body (Wang et al., 2002). This variability in the mechanism of angle closure may also account for conflicting reports of the effectiveness of both screening tests and interventions for ACG among different ethnic groups (Thomas et al., 1996, Foster et al.,
The progressive loss of vision in glaucoma is the result of damage to retinal ganglion cells and their axons at the level of the optic nerve head. Early damage typically occurs at the inferior and superior poles of the optic disc, observed clinically as focal or diffuse loss of the neuroretinal rim with enlargement of the vertical cup to disc ratio. Comprehensive examination for structural damage requires the use of binocular indirect ophthalmoscopy through a dilated pupil, which affords a stereoscopic view for more sensitive assessment of subtle changes to the optic nerve head and peripapillary retina (Kotecha, 2009). In UK practice, examination of the optic nerve head by community optometrists is a recommended requirement during the course of a routine eye examination of an adult (CoO, 2014e) and child (CoO, 2014c), but the method used to observe the optic disc is at the discretion of the practitioner. In a 2007 survey of community optometrists, 50% of respondents reported use of slit-‐lamp binocular indirect ophthalmoscopy through undilated pupils for routine checking of the optic disc when case-‐finding for glaucoma (CoO, 2008). However, the technique is subjective and prone to intra-‐ and inter-‐observer variability in observations. This may, in part, be accounted for by the overlap in spectrum of optic disc features between glaucoma, suspect glaucoma and normal eyes. Furthermore, ancillary observation of the peripapillary retina surrounding the optic disc for nerve fibre layer defects is also difficult by clinical examination and photography, as visibility of subtle changes can be affected by age, media opacities, and fundal pigmentation (Zangwill & Bowd, 2006).
The past 20 years has seen rapid advancements in technologies for objective examination of the optic disc. Since the initial introduction of conventional ocular imaging, it became apparent that a permanent record afforded better documentation, study and monitoring of clinical features (Harding et al., 1995, Lin et al., 2002, Pirbhai et al., 2005, Jain et al., 2006). Use of fundus imaging in optometric practice has risen from 17% in 2001 (CoO, 2001) to 66% in 2007 (CoO, 2008) and as such, the device is increasingly considered commonplace in optometric practice. Modern devices have evolved to capture 3-‐dimensional images of ocular structures using laser technology. The optical coherence tomographer (OCT) is the most widely used scanning laser device in the UK, and has been established as a clinical diagnostic tool for detection and monitoring of optic nerve and macular disease that may be difficult to observe using conventional viewing techniques (Chen & Lee, 2007). The use of OCT imaging in community optometric practice is increasing, however, standardized protocols for use of this modality to detect and monitor glaucoma are lacking.