City, University of London Institutional Repository
Citation:
Kaparias, I., Bell, M. G. H., Dong, W., Sastrawinata, A., Singh, A., Wang, X. and Mount, B. (2013). Analysis of pedestrian-vehicle traffic conflicts in street designs withelements of shared space. Transportation Research Record, 2393, pp. 21-30. doi: 10.3141/2393-03
This is the accepted version of the paper.
This version of the publication may differ from the final published
version.
Permanent repository link:
http://openaccess.city.ac.uk/6251/Link to published version:
http://dx.doi.org/10.3141/2393-03Copyright and reuse: City Research Online aims to make research
outputs of City, University of London available to a wider audience.
Copyright and Moral Rights remain with the author(s) and/or copyright
holders. URLs from City Research Online may be freely distributed and
linked to.
Ioannis Kaparias
Collaborative Transport Hub, School of Engineering and Mathematical Sciences, City University London, Northampton Square, London EC1V 0HB, UK
Email: [email protected]
Michael G. H. Bell
Institute of Transport and Logistics Studies, University of Sydney, Newtown Campus C37, 144 Burren Street, Sydney, NSW, Australia
Email: [email protected]
Weili Dong
Centre for Transport Studies, Department of Civil and Environmental Engineering, Skempton Building, South Kensington Campus, Imperial College London, London SW7 2BU, UK
Email: [email protected]
Aditya Sastrawinata
Centre for Transport Studies, Department of Civil and Environmental Engineering, Skempton Building, South Kensington Campus, Imperial College London, London SW7 2BU, UK
Email: [email protected]
Amritpal Singh
Centre for Transport Studies, Department of Civil and Environmental Engineering, Skempton Building, South Kensington Campus, Imperial College London, London SW7 2BU, UK
Email: [email protected]
Xuxi Wang
Centre for Transport Studies, Department of Civil and Environmental Engineering, Skempton Building, South Kensington Campus, Imperial College London, London SW7 2BU, UK
Email: [email protected]
Bill Mount
Centre for Transport Studies, Department of Civil and Environmental Engineering, Skempton Building, South Kensington Campus, Imperial College London, London SW7 2BU, UK
Email: [email protected]
(6,118 + 4 . Figures (250) + 3 . Tables (250) = 7,868 words)
ABSTRACT
1
INTRODUCTION
The concept of shared space has emerged as part of a continuous trend over many years towards a more integrated approach to the design of urban streets, where both pedestrians and vehicles are present. Inspired by advances in the field of urban planning, it revolves around layouts aimed at asserting the function of streets as places rather than as arteries, which involves designing more to a scale aimed at easier pedestrian movement and lower vehicle speeds. As such, it contrasts the traditional car-oriented approach, which is based on greater segregation of pedestrians and vehicles to ensure unobstructed traffic flows (1). Recent guidance published by the UK Department for Transport defines shared space as “a street or place designed to improve pedestrian movement and comfort by reducing the dominance of motor vehicles and enabling all users to share the space rather than follow the clearly defined rules implied by more conventional designs” (2).
The term “shared space”, is not used to characterise entire streets and places as “shared” or “not shared”, particularly given that streetscape design cannot be standardised and needs to be context-sensitive. Instead, shared space is used as an “umbrella” term to collectively refer to a range of streetscape treatments, aiming at creating a more pedestrian-friendly environment. These may range from the removal of guardrails and the introduction of “informal” (uncontrolled) pedestrian crossing facilities in a traditional “kerbed” street layout, through to layouts with a single surface and little or no delineation between pedestrian and vehicle areas (3-7). Examples of streets with varying extents of shared space elements can be found around the world and include: the concept of “woonerf” and “home zone” in residential areas in the Netherlands and UK respectively; the “Manual for Streets” approach in the UK (8-9); and the “Complete Streets” initiative in the USA (10).
Naturally, shared space brings about potential implications in terms of safety. Opponents of the concept, on one hand, claim that shared space is likely to introduce more pedestrian-vehicle conflicts, which might be expected to lead to more accidents and hence a worse safety record; in particular, concerns have been expressed by certain road user groups, such as the elderly and disabled (11). Proponents of shared space, on the other hand, suggest that the concept introduces ambiguity, which makes both drivers and pedestrians more vigilant (4-5) and engineers conflicts into the design rather than excluding them, hence contributing positively to safety. The conflicts-based analysis of the safety-related impacts of shared space, hence, is an interesting research topic.
In recent research, a new analysis method for pedestrian-vehicle traffic conflicts in shared space was developed (12). The work was carried out as part of a traffic monitoring programme of the Exhibition Road project, comprising the conversion of the layout of the Exhibition Road site in London’s South Kensington area from a conventional dual carriageway to a single surface, featuring a number of elements of shared space. The new method was based on an existing widely-used vehicle-vehicle technique and was applied to the Exhibition Road site in its original conventional form prior to any redevelopment for validation purposes. Building on that work, the aim of this paper is to advance and refine the method developed (named Pedestrian-Vehicle Conflicts Analysis (PVCA)), on one hand, and to apply it to the recently completed new layout of Exhibition Road in a before-after comparative manner, on the other, in order to investigate changes in traffic conflicts as a result of the redevelopment and draw conclusions on the safety-related impacts of shared space in general.
2
BACKGROUND
The Federal Highway Administration (FHWA) of the US Department of Transportation (USDoT) defines a traffic conflict as “an event involving two or more road users, in which the action of one user causes the other user to make an evasive manoeuvre to avoid a collision” (13). Similarly, the Chartered Institution of Highways and Transportation (CIHT) in the UK provides a definition of a conflict as “an observable situation in which two or more road users approach each other in space and time to such an extent that a collision is imminent if their movements remain unchanged” (14). These definitions are the result of many years of research on the topic of traffic conflicts analysis between its inception in the late 1960s (15) and its role today as a well-known and widely-used tool of accident prevention around the world.
A large number of traffic conflicts techniques have been developed to date (16-17). While initial methods were purely qualitative and used only subjective statements to identify and characterise evasive actions of road users in response to conflicts, newer methods have become more quantitative and have provided definitions for measures of the severity of conflicts (18-20). This has also been facilitated by advances in imaging technology, which now enables the automated observation of sites and application of traffic conflicts techniques is a much simpler way, as opposed to earlier techniques based on manual observation and the use of grading sheets (21-22). Notable examples of techniques in use today include: the “Swedish Traffic Conflicts Technique” (STCT) from Lund University in Sweden (23), which focuses upon evaluating the time to accident and vehicle speed at the beginning of an evasive action using a graph, which has disaggregating lines to categorise the different conflicts according to severity; the “CIHT Conflicts Technique” (CIHTCT) from the Transport and Road Research Laboratory in the UK (14), which uses a categorisation of the various comprising elements of the conflict and creates levels of severity for each element, such that by summing up the given element levels an overall grading of the severity of the conflict can be obtained; and the “USDoT Conflict Technique” (USDoTCT) from the FHWA in the US (13), which is similar in concept to the CIHTCT but uses different grading criteria.
Conventionally, traffic conflicts techniques have been used for vehicle-vehicle conflicts, as they were intended for the assessment of the safety of road intersections. However, some examples of work on conflicts between vehicles and other road users can be found in the literature, mostly for the purpose of assessing the safety of pedestrian crossings and the interactions within mixed traffic flows. These include: (24), where a method categorising vehicle-pedestrian conflicts at crossings into one of 13 types was derived with a view of identifying potential safety hazards; (25), where pedestrian-vehicle conflicts along with traffic characteristics data were used to perform automated assessment of the safety of Pelican crossings in the UK; and (26-27), in which an automated video analysis system to classify road users as vehicles or pedestrians, identify conflict situations between them and categorise them according to their severity was developed. Also, there are several instances of methods adapted from well-established vehicle-vehicle methods to monitor pedestrian-vehicle conflicts, such as: the application of the STCT in (28) and (29); the use of the USDoTCT in (30); and the adaptation of the CIHTCT in (12) and in (31).
The vast majority of the pedestrian-vehicle conflicts analysis techniques developed have been successfully applied in conventionally-designed street environments. Nevertheless, their application in layouts designed according to the principles of shared space introduces some challenges, such as the fact that there is intended ambiguity about the right of way at certain locations, which can introduce some uncertainty in the exact prediction of the trajectories of vehicles and pedestrians.
and Grade 2, 3 or 4 occurrences corresponding to “serious” conflicts. A further adaptation of the PVCA method in (31), called Conflict-based Assessment of Pedestrian Safety (CAPS), provides revised definitions for the four existing factors and also defines an additional factor (lane condition) for the special case of conflicts analysis of complex road intersections.
Nevertheless, while a method has been developed, no analysis of pedestrian-vehicle conflicts has been performed in shared space so far, as applications have only been conducted in conventional environments. It is, hence, the objective of the next sections to assess the PVCA method with respect to its applicability in shared space, to refine it accordingly, and to carry out a before- and after-analysis of conflicts on the recently redeveloped Exhibition Road site in order to investigate impacts.
3
METHODOLOGY
The PVCA method developed in (12) and revisited in (31) consists of three steps, namely: the identification of a conflict situation; the classification of the severity of the four factors (A–D) through the observation of the conflict; and the determination of a conflict severity grade with the use of charts containing combinations of severity ratings of the individual factors. While the method forms a fairly solid base for analysing traffic conflicts in street designs with elements of shared space, there are still a number of ambiguous issues that need to be addressed, particularly as concerns the identification of evasive actions (and consequently of conflict occurrences) and the definition of the factors determining the conflict severity grades. This section, therefore, performs a step-by-step assessment of the PVCA method and makes the necessary additions and amendments in order to refine the methodology and prepare it for application in shared space. It should be noted that a complete description of the original PVCA and CAPS methods can be found in (12, 31) and is therefore omitted here; instead, the focus is on the modifications to the issues identified.
3.1 Identification of evasive actions
While the original PVCA describes fairly explicit procedures for the determination of the severity of a conflict, it does not provide a clear definition of how to identify a conflict occurrence. The existing definitions from the literature (13-14) state that for a conflict event to be characterised as such, an evasive action from at least one road user is required. Nevertheless, when observing a street scene, it can be realised that road users take a variety of actions, sometimes even in response to other road users’ actions, which are, however, not necessarily evasive and which are part of what is referred to as “interaction”. It is important, in the absence of a clear definition, to specify what constitutes an evasive action and hence forms part of a conflict event, particularly in a shared space environment, where a higher degree of interaction between vehicles and pedestrians is expected.
The first step of such a definition is to determine the context in which evasive actions (and hence conflicts) can occur. Namely, even though shared space designs are in theory based on the condition that vehicles and pedestrians fully share the same street surface, in practice this is only rarely the case, as streets with shared space elements are usually (formally or informally) divided into areas in which vehicles or pedestrians are dominant. These are termed “traffic zone” and “pedestrian zone” respectively, and may also overlap or complemented by an intermediate zone called “transition zone”. Naturally, the size and layout of each of these zones differ between different sites, and a wide variety of configurations exists in various schemes worldwide. As a general remark, however, vehicle speeds outside the traffic zone rarely exceed walking pace (in other words, vehicles behave like pedestrians), so it is sensible to characterise actions by pedestrians and vehicles as evasive only if they occur in the traffic zone.
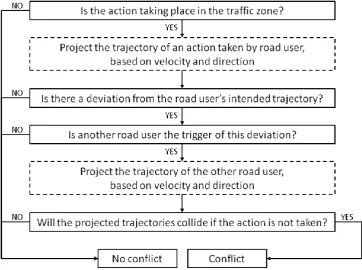
another road user, in which case the other road user’s trajectory is projected, again based on their velocity and direction, and it is assessed whether the intended trajectories would collide if the initial action was not taken. Only if the latter is the case can the initial action be considered evasive, and as a result the event be characterised as a conflict. The complete decision process is depicted in Figure 1.
It should be noted here that evasive actions should be distinguished from routine ones. Examples of the latter include pedestrians stopping upon entering the traffic zone to gauge their surroundings for safety reasons before continuing, pedestrians accelerating at formal crossings as a result of traffic light changes, and drivers intentionally stopping to give way to crossing pedestrians as an act of courtesy. An important consideration is also whether an action taken by a road user is a matter of choice or force, with only the latter being evasive.
3.2 Factor classification
Following the identification of a conflict occurrence, the second step of the PVCA method involves the classification of the severity of the four factors (A-D). The original PVCA (12) gives definitions for the various severity classes for each of the factors, with some of them being of qualitative nature. Nevertheless, while qualitative analysis can be a useful tool of identifying overall trends, it has the drawback that it entails an element of subjectivity in the evaluation, meaning that it is generally difficult to reproduce results if carried out by different observers. CAPS (31) is a step forward towards the quantification of the PVCA, particularly as concerns the grading of the evasive actions taken by drivers, so the present study builds on it and revises the factor classification for pedestrians, with the aim of converting PVCA to a fully quantitative approach. The four factors are hence redefined as follows, with the classes and respective thresholds listed in Table 1:
Factor A (Time to collision): Time to collision is defined as the time between the start of the pedestrian-vehicle conflict event and the point when the trajectories of the pedestrian and the vehicle intersect. Namely, the time to collision (in s) TTC = dv/v, where dv (in m) and v (in
m/s) are the distance from the vehicle’s front to the projected point of conflict, and the vehicle’s instantaneous speed, respectively, at the time of initialisation of the evasive action.
Factor B (Severity of evasive action): Revisiting the quantitative definition of CAPS (31), the severity of the evasive action describes how much road users need to decelerate to avoid a collision. Acceleration/deceleration threshold values are provided for vehicles, and the, previously qualitative, pedestrian severity hierarchy is quantified.
Factor C (Complexity of evasive action): The same definition as in the original PVCA and CAPS methods is kept, but a quantitative dimension is added.
Factor D (Distance to collision): In accordance with the original PVCA and CAPS definition, distance to collision describes the distance of the approaching road users to the projected collision point at the time of initialisation of the evasive action. The distance is defined in relation to the vehicle length, as its criticality is dependent on it.
definition, an evasive action of a road user that results in a gap of less than 2 s in the safety zone before the other road user crosses the projected collision point is classified as necessary, whereas an action resulting in a time gap longer than 2 s in the safety zone is considered an overreaction.
3.3 Conflict categorisation
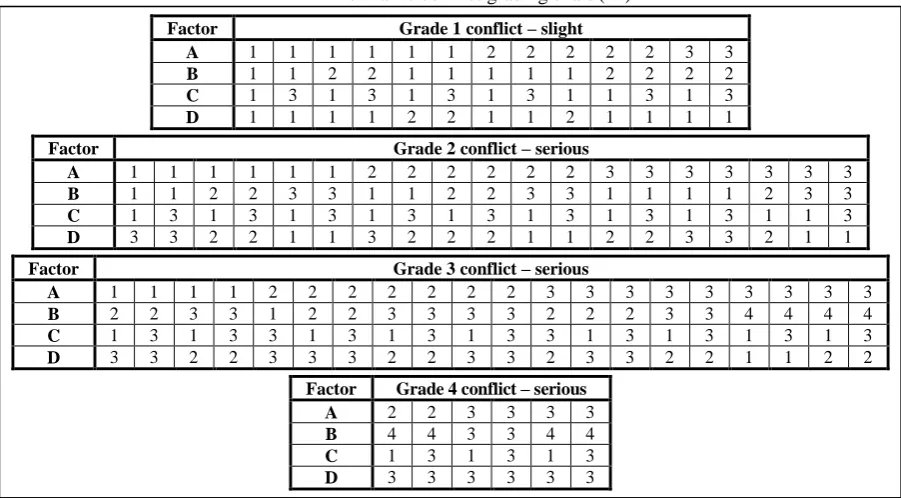
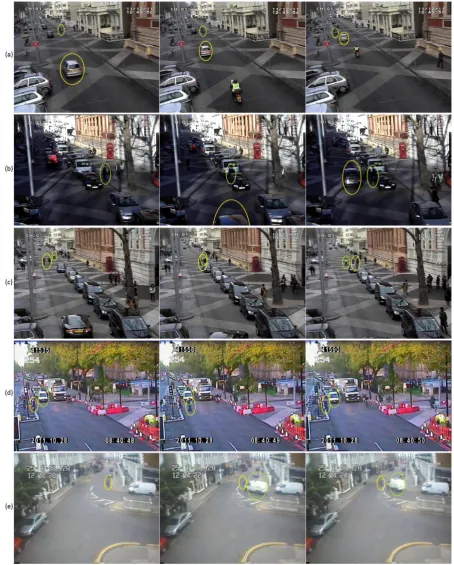
After the classification of the severity of each of the four factors A–D constituting a conflict, the grades assigned are collated so as to determine an overall grade for the conflict. Severity grades range from 1 to 4, with Grade 1 conflicts being characterised as ‘slight’ and Grades 2, 3 and 4 corresponding to ‘serious’ conflicts, with increasing severity. Each combination of ratings for Factors A–D corresponds to a specific conflict grade, as these are presented in the grading chart of Table 2, taken from the original PVCA method. Diagrammatic illustrations of the different grades of conflict occurrences are shown in Figure 2.
It should be noted here that ratings of the severity of the individual constituent factors of conflicts refer to both vehicles and pedestrians and therefore it is likely that two grades of conflict will occur as vehicles and pedestrians take evasive actions of differing severity and complexity. When such a case arises the PVCA method takes the worst of the two grades to mark the conflict.
4
IMPLEMENTATION
The revised PVCA method is implemented on the Exhibition Road site in London using video data, in order to investigate the effects of shared space street design on traffic conflicts. This section presents the implementation setup and procedure, including a description of the site and data collection, followed by a summary of the results obtained.
4.1 Implementation setup
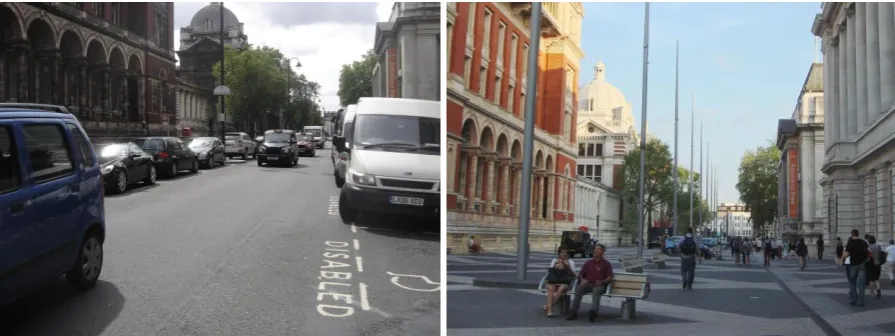
Exhibition Road is an 800 m long road located in the Royal Borough of Kensington and Chelsea (RBKC) in London and is home to a number of London’s most popular museums (Natural History, Science, V&A). The surrounding area of South Kensington is well-known as a cultural centre, including other venues such as the Royal Albert Hall as well as many academic institutions, including Imperial College London. As the previous conventional dual-carriageway-layout of Exhibition Road was crowded (a problem exacerbated by numerous pedestrian barriers) and dominated by high traffic flows and parked vehicles, the RBKC undertook an engineering scheme, the ‘Exhibition Road Project’, which included its redevelopment to a modern design with some elements of shared space (Figure 3). The project was implemented over four years from mid 2008 to completion in late 2011.
In order to assess the impact of the new design of Exhibition Road on traffic conflicts using the PVCA method, video footage has been collected for periods before and after the implementation of the scheme. In the before-case, video has been collected in August 2008, prior to the start of the redevelopment works, through high-mast cameras installed at a number of critical locations in terms of conflict occurrences. For the after-situation, video has been recorded at the same locations for periods between October and December 2011, following the completion of the scheme. The locations are the following (Figure 4):
• Location I: Northern Exhibition Road (Before: Camera A – After: Cameras 4 & 5):
In the original layout, pedestrians wishing to cross Exhibition Road at this location (entrance of Science Museum) needed to detour by more than 100 m to reach the closest formal pedestrian crossing; as a result, they chose to cross freely. The new layout facilitates that crossing movement.
• Location II: Middle Exhibition Road (Before: Camera B – After: Cameras 6 & 7):
cross freely; the new layout has facilitated those crossings.
• Location III: Eastern Cromwell Road junction (Before: Camera C – After: Cameras E & F): In the original layout, the facility provided to pedestrians wishing to cross Cromwell Road to continue walking on the eastern kerbside of Exhibition Road was a staggered pelican crossing; this has been retained but redesigned in the new layout.
• Location IV: Western Cromwell Road junction (Before: Camera D – After: Cameras H & G): In the original layout, the facility provided to pedestrians wishing to cross Cromwell Road to continue walking on the western kerbside of Exhibition Road was a staggered pelican crossing, which required a detour and often long waiting times for a green man signal. As a result, the vast majority of the pedestrians used a “shortcut” by-passing the staggered crossing and coming into conflict with right-turning southbound traffic from Exhibition Road. The arrangement has been replaced by a wide straight-across crossing in the new layout.
• Location V: Thurloe Street (Before: Camera F – After: Cameras 1 & 2):
Pedestrians using this location in the original layout were faced with two problems: the non-provision of adequate pedestrian crossing facilities, and the insufficient space for pedestrians on the southern kerbside of the road, such that footpath overcrowding resulted in a large number of free crossings. Coupled with high vehicle speeds and poor visibility for both vehicles and pedestrians, this location presented a well-known safety hazard. In the new layout, this location has been redesigned as “access-only”, giving much more space to pedestrians.
As analysing the complete duration of the video data would take up a significant amount of time and provided that peak and off-peak periods exist in traffic conflicts as a result of fluctuation in traffic and pedestrian flows, five hours of analysis for each location for the before- and after-case have been selected, with a mix of week and weekend days chosen depending on the location and the availability of video data, giving 50 hours of footage in total for the whole site. These are:
• Weekdays: 08:00 – 09:00 (morning rush hour, offering an insight of the local residents’ and workers’ use of the road), 12:00 – 13:00 (midday, when a large number of tourists enter and exit the museums) and 17:00 – 18:00 (evening rush hour, with tourists and workers leaving the area, and locals returning)
• Weekends: 12:00 – 13:00 and 17:00 – 18:00 (again midday and evening rush hour)
The video footage is analysed using the revised PVCA method and conflict occurrences and their severity are identified, drawing comparisons between the before- and after-situation. In addition, vehicle traffic and pedestrian crossing counts are conducted in order to relate the changes in conflicts to changes in the traffic conditions around the site.
4.2 Results
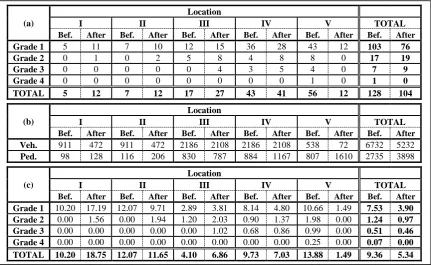
Following the observation of the Exhibition Road site, the conflict occurrences and grades encountered at each location before and after the implementation of the new layout are given in Table 3a. Looking at the general picture, it can be seen that the vast majority of the recorded conflicts in both the before- and the after-case are Grade 1 (slight), with the number of more severe conflicts reducing with increasing severity, thus following the expected “pyramid” form (32). Comparing the before- and after-situation, it is found that the total number of conflicts across the site is lower in the after-case; this finding consists of a significant reduction in slight conflicts (Grade 1), coupled with relatively constant (insignificantly higher) low levels of serious conflicts (Grades 2, 3 and 4). It is also notable that no Grade 4 conflict is recorded anywhere on the site in the after-implementation case.
pedestrian crossing numbers have increased, which means that more interaction is expected between pedestrians and vehicles, even though vehicle traffic flows have decreased. The vehicle and pedestrian traffic flows are shown in Table 3b. As can be seen, there is a significant increase in pedestrian crossings across the site, which is concentrated at Locations IV and V, coupled with small increases at Locations I and II and a small decrease at Location III. These are accompanied by greatly reduced traffic flows at Locations I, II and V, and by relatively constant flows on the intersecting Cromwell Road (Locations III and IV).
Normalising the conflict occurrences with pedestrian crossing flows to draw more meaningful conclusions, it can be seen in Table 3c that the redevelopment scheme has achieved a significant reduction in terms of conflicts per 1000 pedestrians across the site, which is, again, mainly attributed to the significant drop in slight conflicts. However, conversely to the pure conflicts results, the comparison of the normalised numbers also makes clear that the constant levels of serious conflicts are actually drops in conflict occurrence rates, given the significantly higher number of pedestrian crossing events.
Considering the results at the individual locations, significant decreases in both pure slight conflict numbers and normalised slight conflict rates are recorded at Locations IV and V, which is in line with what would be expected. Namely, the redesign of Location V from a one-way street with bad visibility and overcrowded footpaths to an access-only road has excluded vehicular through-traffic, thus eliminating most conflicts. It is notable that no serious conflicts are recorded at Location V post-redevelopment, and that the significantly fewer slight conflicts are mostly between pedestrians and cycles. Similarly, the redesign of the pedestrian crossing at Location IV (junction of Exhibition Road and Cromwell Road) from staggered to straight-across seems to better follow pedestrian desire-lines, as it has reduced the number of free crossings and has increased compliance by the pedestrians. This is reflected both in the fewer slight conflicts and in the clearly lower normalised conflict rate figures, with the accompanying rather stagnant serious conflict rates being mainly attributed to the fact that a certain degree of non-compliance is always expected in signalised pedestrian crossings.
As concerns Locations I, II and III, these see minor rises in slight conflicts, coupled with similar trends in serious conflicts. Location II records increased pedestrian flows resulting in a lower normalised conflict rate, which is something that would be expected as a result of the redevelopment. The fact, however, that Location I has relatively constant pedestrian crossing flows and hence a higher normalised conflict rate may be pointing to an issue potentially needing further attention. Similarly, in Location III, the slightly higher conflict numbers are also coupled with lower pedestrian flow numbers, resulting in higher rates. Given, however, that the staggered crossing has remained in place after the redevelopment of the rest of the site, this is an expected finding, which still deserves further investigation.
All in all with respect to the results obtained, it should be noted additionally that the before-monitoring period is during the student summer break, while the after-before-monitoring period is actually immediately after the completion of the scheme (less than one month). This may have a bearing on the results, the former because it may imply lower pedestrian numbers than usual, but most importantly, the latter because it may point to the so-called “settling down” period, and thus not reflecting the long-term behaviour. It would be, hence, useful to further investigate the implications of the timing of the study and to compare the results with a subsequent after-study, when pedestrians and drivers have become more accustomed to the new layout.
5
CONCLUSIONS
redeveloped Exhibition Road in London, where, using video data from a number of critical locations around the site before and after redevelopment, an evaluation in terms of pedestrian-vehicle traffic conflicts has been carried out.
Coupled with a significant increase in pedestrian movement in the area (higher number of pedestrian crossing events), the results indicate a general drop in traffic conflict rates, but also highlight specific locations that may require additional analysis. Specifically, the biggest drop is naturally observed at the location converted to an access-only (i.e. almost exclusively pedestrian) street, while small increases are recorded at the “more shared” single surface locations, largely as a direct consequence of the increased pedestrian presence. A clear decrease in conflicts is observed at a pedestrian crossing location having undergone a simplification in design (from staggered to straight-across), while a small increase is seen at a location having retained the previous staggered crossing layout.
Overall, it can be suggested from this study that the redevelopment of urban streets according to the principles of shared space seems to result in reduced rates of pedestrian-vehicle traffic conflicts. In particular, shared space elements appear to mainly target slight conflicts, with more serious occurrences being tackled better by more drastic measures giving priority to pedestrians (e.g. converting a road to access-only). On the other hand, it seems that some features coupled with shared space may increase conflict numbers (e.g. the use of conventional staggered crossings), and it is imperative to further investigate those.
While the present study has shed some light on the topic of shared space and conflicts analysis, work in this direction continues. It is an essential next step to conduct more analyses with different observers on the same site using the PVCA method in order to eliminate any arising observer bias and consolidate the findings. Further experiments with the PVCA method also need to be carried out in other sites, so as to be able to extract more generic conclusions and investigate how traffic conflicts vary with different combinations and extents of shared space features. It is also important to combine traffic conflicts with behavioural analysis in order to investigate in more depth the human factors behind traffic safety in shared space. Other related aspects to be looked at include the impact of shared space and traffic conflicts on vulnerable road users, such as the elderly and the disabled. Finally, it would be of value to complement the analysis with further technological tools (e.g. detectors and imaging software), as well as with on-site observations, to further improve on the accuracy of the results.
ACKNOWLEDGEMENT
The authors would like to thank the Royal Borough of Kensington and Chelsea, and in particular Antoneta Horbury and Tesfaye Assegedow, for supporting this work by providing data and guidance.
REFERENCES
(1) Buchanan C, Cooper GHC, MacEwen A, Crompton DH, Crow G, Michell G et al. Traffic in towns, HMSO, 1963.
(2) UK Department for Transport. Local Transport Note 1/11 - Shared space, 2011.
(3) Hamilton-Baillie, B. A street revolution. Green Places, Vol. June 2004, 2004, pp. 20-23. (4) Hamilton-Baillie, B. Urban design: Why don't we do it in the road. Journal of Urban
Technology, Vol. 11, 2004, pp. 43-62.
(5) Hamilton-Baillie, B and Jones, P. Improving traffic behaviour and safety through urban design. Proceedings of the Institution of Civil Engineers - Civil Engineering, Vol. 158, 2005, pp. 39-47. (6) Hamilton-Baillie, B. Towards shared space. Urban Design International, Vol. 13, 2008, pp.
130-138.
(8) UK Department for Transport. Manual for Streets. 2007.
(9) Chartered Institute of Highways and Transport. Manual for Streets 2 – Wider application of the principles. 2010.
(10) LaPlante, JN and McCann, B. Complete streets in the United States, 90th Annual Meeting of the Transportation Research Board, Washington, DC, USA, 2011.
(11) Deichman, J, Winterberg, B and Bredmose, A. Shared space - safe space. Ramboll-Nyvig report, 2008.
(12) Kaparias, I, Bell, MGH, Greensted, J, Cheng, S, Miri, A, Taylor, C and Mount, B. Development and implementation of a vehicle-pedestrian conflicts analysis method: Adaptation of a vehicle-vehicle technique. Transportation Research Record, Vol. 2198, 2010, 75-82. (13) Parker, MR Jr and Zegeer, CV. Traffic conflict techniques for safety and operations - Observers
manual. FHMA-IP-88-027, Federal Highway Administration, 1989.
(14) Swain, J. Highway safety: The traffic conflict technique. Transport and Road Research Laboratory, 1987.
(15) Perkins, SR and Harris, JI. Traffic conflict characteristics - Accident potential at intersections. Highway Research Record, Vol. 225, 1968, pp. 35-43.
(16) Archer, J. Traffic conflict technique: Historical to current state-of-the-art. KTH/INFRA--02/010-SE, Institutionen för Infrastruktur, Kungl Tekniska Högskolan, 2001.
(17) Muhlrad, N. Traffic conflict techniques and other forms of behavioural analysis: Application to safety diagnoses. Proceedings of the 6th International Co-operation on Theories and Concepts in Traffic Safety (ICTCT) Workshop, 1993.
(18) Allen, BL and Shin, BT. Analysis of traffic conflicts and collisions. Transportation Research Record, Vol. 667, 1978, pp. 67-74.
(19) Chin, H-C and Quek, S-T. Measurement of traffic conflicts. Safety Science, Vol. 26, 1997, pp. 169-185.
(20) Minderhoud, MM. and Bovy, PHL. Extended time-to-collision measures for road traffic safety assessment. Accident Analysis and Prevention, Vol. 33, 2001, pp. 89-97.
(21) Saunier, N and Sayed, T. Automated road safety analysis using video data. Transportation Research Record, Vol. 2019, 2007, pp. 57-64.
(22) Saunier, N, Mourji, N and Agard, B. Mining microscopic data of vehicle conflicts and collisions to investigate collision factors. Transportation Research Record, Vol. 2237, 2011, pp. 41-50.
(23) Hydén, C. The development of a method for traffic safety evaluation: The Swedish traffic conflicts technique. Department of Technology and Society, Lund University, 1987.
(24) Cynecki, MJ. Development of a conflicts analysis technique for pedestrian crossings. Transportation Research Record, Vol. 743, 1980, pp. 12-20.
(25) Malkhamah, S, Tight, M and Montgomery, F. The development of an automatic method of safety monitoring at Pelican crossings. Accident Analysis and Prevention, Vol. 37, 2005, pp. 938-946.
(26) Ismail, K, Sayed, T and Saunier, N. Automated analysis of pedestrian-vehicle conflicts using video data. Transportation Research Record, Vol. 2140, 2009, pp. 44-54.
(27) Ismail, K, Sayed, T and Saunier, N. Automated analysis of pedestrian-vehicle conflicts: Context for before-and-after studies. Transportation Research Record, Vol. 2198, 2010, pp. 52-64.
(28) Svensson, Å. A method for analysing the traffic process in a safety perspective, PhD thesis, Lund University, 1998.
(29) Chen, Y, Meng, H and Wang, Z. Safety improvement practice for vulnerable road users in Beijing junctions. Transportation Research Record, Vol. (In press), 2009
(31) Salamati, K, Schroeder, B, Rouphail, NM, Cunningham, C, Long, R and Barlow, J. Development and implementation of conflict-based assessment of pedestrian safety to evaluate accessibility of complex intersections. Transportation Research Record, Vol. 2264, 2011, pp. 148-155.
FIGURE 1 Decision process for conflict identification
TABLE 1 PVCA factor classes and thresholds
TABLE 2 Traffic conflict grading chart (12)
FIGURE 2 (a) Vehicle brakes in response to the crossing pedestrian, but the trajectories do not collide: No
conflict (b) Pedestrians stop to let the oncoming cab pass and continue straight after: Conflict Grade 1, with factor classifications “1, 2, 1, 1”; (c) Cyclist changes course to avoid colliding with the crossing pedestrians: Conflict Grade 2, with factor classifications “2, 2, 1, 2”; (d) Pedestrian returns to pavement to avoid colliding with the departing vehicle from the stop-line: Conflict Grade 3, with factor classifications “2, 2, 3, 2”; (e) Pedestrian changes pace from ‘walk’ to ‘sprint’ to avoid a collision with the oncoming van: Conflict Grade 4, with factor classifications “3, 3, 1, 3”
FIGURE 3 Exhibition Road before (left) and after redevelopment (right)
FIGURE 4 Camera locations at the Exhibition Road site in the before- (left) and after-monitoring (right)
TABLE 3 (a) Conflict numbers and severity; (b) vehicle traffic flows (veh/h) and pedestrian crossing flows
TABLE 1: PVCA factor classes and thresholds
Factor A: Time to collision
Long [Class 1] (TTC > 2 s): The vehicle or the pedestrian has to decelerate, however the time to
collision is such that the braking is steady and there is no change of course of either road user. This case also applies to occasions when either road user has to accelerate.
Moderate [Class 2] (0.5 < TTC≤ 2 s): The time to collision is greatly reduced, such that the road user
has to brake hard and may also need to change his/her course after braking to avoid a collision.
Short [Class 3] (TTC≤ 0.5 s): The road user has to both brake hard and at the same time significantly
change his/her course in order to avoid a collision.
Factor B: Severity of evasive action
Light [Class 1]: Light, controlled deceleration or acceleration (less than 2 m/s2) for vehicles. For
pedestrians this corresponds to a change up/down by one level on the severity hierarchy.
Medium [Class 2]: Moderate, but controlled deceleration or acceleration (2 – 3.45 m/s2) for vehicles.
For pedestrians this corresponds to a change up/down by two levels on the severity hierarchy
Heavy [Class 3]: Sharp, less controlled deceleration or acceleration (3.45 – 8.5 m/s2) for vehicles. For
pedestrians this corresponds to a change up/down by three levels on the severity hierarchy. This is likely to be combined with a change of course, which occurs after the deceleration or acceleration.
Emergency [Class 4]: Sudden, uncontrolled deceleration or acceleration (> 5.5 m/s2) for vehicles. For
pedestrians this corresponds to a change up/down by four levels on the severity hierarchy. This is likely combined with a fairly instant change of course.
Pedestrian severity hierarchy:
‘stop’ (0 m/s) – ‘walk’ (1 – 2.5 m/s) – ‘jog’ (2.5 – 4 m/s) – ‘run’ (4 – 5.5 m/s) – ‘sprint’ (> 5.5 m/s)
Factor C: Complexity of evasive action
Simple [Class 1]: The road user either decelerates/accelerates in order to avoid a collision (change in
speed without change in course), or distinctively changes course (>45°) in order to avoid a collision (change in course without change in speed).
Complex [Class 3]: The road user takes an action involving a distinct (>45°) change of course and
decelerates or accelerates in order to avoid a collision (combined change of course and speed)
Factor D: Distance to collision
In accordance with the original PVCA and CAPS definition, distance to collision describes the distance of the approaching road users to the projected collision point at the time of initialisation of the evasive action. The distance is defined in relation to the vehicle length, as its criticality is dependent on it. As such, a definition of vehicle length is added. Hence:
Far [Class 1]: Greater than two vehicle lengths between the conflicting road users, when they begin to
take action to avoid the collision. For formal pedestrian crossings this should be taken as greater than one vehicle length.
Medium [Class 2]: Between one and two vehicle lengths between the conflicting road users, when
they begin to take action to avoid the collision. For formal pedestrian crossings this should be taken as between 0.5 and 1 vehicle length.
Short [Class 3]: Less than one vehicle length between the conflicting road users, when they begin to
take action to avoid the collision. For formal pedestrian crossings this should be taken as less than 0.5 vehicle length.
Vehicle length values:
Heavy vehicles (trucks): 8 m – 4-wheelers (cars, vans): 5 m – 2-wheelers (cycles, motorcycles): 2 m
TABLE 2: Traffic conflict grading chart (12)
Factor Grade 1 conflict – slight
A 1 1 1 1 1 1 2 2 2 2 2 3 3
B 1 1 2 2 1 1 1 1 1 2 2 2 2
C 1 3 1 3 1 3 1 3 1 1 3 1 3
D 1 1 1 1 2 2 1 1 2 1 1 1 1
Factor Grade 2 conflict – serious
A 1 1 1 1 1 1 2 2 2 2 2 2 3 3 3 3 3 3 3
B 1 1 2 2 3 3 1 1 2 2 3 3 1 1 1 1 2 3 3
C 1 3 1 3 1 3 1 3 1 3 1 3 1 3 1 3 1 1 3
D 3 3 2 2 1 1 3 2 2 2 1 1 2 2 3 3 2 1 1
Factor Grade 3 conflict – serious
A 1 1 1 1 2 2 2 2 2 2 2 3 3 3 3 3 3 3 3 3
B 2 2 3 3 1 2 2 3 3 3 3 2 2 2 3 3 4 4 4 4
C 1 3 1 3 3 1 3 1 3 1 3 3 1 3 1 3 1 3 1 3
D 3 3 2 2 3 3 3 2 2 3 3 2 3 3 2 2 1 1 2 2
Factor Grade 4 conflict – serious
A 2 2 3 3 3 3
B 4 4 3 3 4 4
C 1 3 1 3 1 3
TABLE 3: (a) Conflict numbers and severity; (b) vehicle traffic flows (veh/h) and pedestrian crossing flows (ped/h); (c) normalised conflict occurrence rates (conflict / 1000-ped)
(a)
Location
I II III IV V TOTAL
Bef. After Bef. After Bef. After Bef. After Bef. After Bef. After
Grade 1 5 11 7 10 12 15 36 28 43 12 103 76
Grade 2 0 1 0 2 5 8 4 8 8 0 17 19
Grade 3 0 0 0 0 0 4 3 5 4 0 7 9
Grade 4 0 0 0 0 0 0 0 0 1 0 1 0
TOTAL 5 12 7 12 17 27 43 41 56 12 128 104
(b)
Location
I II III IV V TOTAL
Bef. After Bef. After Bef. After Bef. After Bef. After Bef. After
Veh. 911 472 911 472 2186 2108 2186 2108 538 72 6732 5232
Ped. 98 128 116 206 830 787 884 1167 807 1610 2735 3898
(c)
Location
I II III IV V TOTAL
Bef. After Bef. After Bef. After Bef. After Bef. After Bef. After
Grade 1 10.20 17.19 12.07 9.71 2.89 3.81 8.14 4.80 10.66 1.49 7.53 3.90
Grade 2 0.00 1.56 0.00 1.94 1.20 2.03 0.90 1.37 1.98 0.00 1.24 0.97
Grade 3 0.00 0.00 0.00 0.00 0.00 1.02 0.68 0.86 0.99 0.00 0.51 0.46
Grade 4 0.00 0.00 0.00 0.00 0.00 0.00 0.00 0.00 0.25 0.00 0.07 0.00