rsfs.royalsocietypublishing.org
Research
Cite this article:
Mackenzie JA, Nolan M,
Insall RH. 2016 Local modulation of
chemoattractant concentrations by single cells:
dissection using a bulk-surface computational
model.
Interface Focus
6
: 20160036.
http://dx.doi.org/10.1098/rsfs.2016.0036
One contribution of 12 to a theme issue
‘Coupling geometric partial differential
equations with physics for cell morphology,
motility and pattern formation’.
Subject Areas:
computational biology, systems biology
Keywords:
chemotaxis, cell motility, self-generated
gradients, bulk-surface model,
surface finite-elements
Author for correspondence:
J. A. Mackenzie
e-mail: [email protected]
Local modulation of chemoattractant
concentrations by single cells: dissection
using a bulk-surface computational model
J. A. Mackenzie
1, M. Nolan
1and R. H. Insall
21Department of Mathematics and Statistics, University of Strathclyde, Glasgow G1 1XH, UK
2Beatson Institute for Cancer Research, Switchback Road, Bearsden G61 1BD, UK
JAM, 0000-0003-4412-7057; RHI, 0000-0003-4898-040X
Chemoattractant gradients are usually considered in terms of sources and sinks that are independent of the chemotactic cell. However, recent interest has focused on ‘self-generated’ gradients, in which cell populations create their own local gradients as they move. Here, we consider the interplay between chemoattractants and single cells. To achieve this, we extend a recently developed computational model to incorporate breakdown of extra-cellular attractants by membrane-bound enzymes. Model equations are parametrized, using the published estimates fromDictyosteliumcells chemo-taxing towards cyclic AMP. We find that individual cells can substantially modulate their local attractant field under physiologically appropriate con-ditions of attractant and enzymes. This means the attractant concentration perceived by receptors can be a small fraction of the ambient concentration. This allows efficient chemotaxis in chemoattractant concentrations that would be saturating without local breakdown. Similar interactions in which cells locally mould a stimulus could function in many types of directed cell motility, including haptotaxis, durotaxis and even electrotaxis.
1. Introduction
Cell movement is fundamental throughout medicine and biology. In particular, embryonic development is largely mediated by cells moving relative to one another; immune responses are entirely dependent on white blood cells’ amoe-boid migration, and cancer metastasis is fuelled by inappropriate movement of tumour cells into the blood, lymph and surrounding tissues. Random move-ment is an extremely inefficient way to move cells any distance, and limits the ability of cells to explore. Hence, the steering of cell migration by gradients of diffusible chemicals (chemotaxis), and its relatives haptotaxis and durotaxis, is central to moving cells’ ability to move between defined sites.
In the mainstream view of chemotaxis described in most of the literature, the gradients of attractants are imposed by external influences, and cells respond rela-tively passively, simply reading the gradients and moving in response to them. Recently, however, a new paradigm has emerged in which cells have the capa-bility to alter local levels of ligand molecules [1,2]. This can lead to populations of cells generating their own gradients in their local environment. This interaction occurs in various biological contexts. For example, in Dictyosteliumcells, cyclic AMP (cAMP) is a key chemoattractant that mediates multicellular aggregation. However, cAMP is broken down by secreted and membrane-bound phospho-diesterases; without them, it cannot function [3–5]. Dictyosteliumcells use an alternative chemoattractant, folate, to locate their bacterial food; folate is broken down, using a dedicated deaminase [6,7]. During zebrafish neural development, the cells of the lateral primordium migrate in a chain that is driven by a self-generated gradient. Migration requires the CXCR7 receptor, which recognizes the chemokine SDF-1 [8]. However, the role of this receptor is not to transduce
the SDF-1 signal but to sequester it and hence remove it from the back of the primordium. This leads to a gradient in SDF-1 across the primordium that is actually read and responded to by a separate receptor CXCR4.
Many other types of signalling molecule are used in self-generated gradients. Growth factors, for example—one study shows the ability of epithelial cells to migrate persistently through microscopic mazes that are seeded initially with homogeneous concentrations of epidermal growth factor (EGF). Migration is achieved through the local depletion of EGF, the restricted transport of EGF through the constrained maze structure and the subsequent chemotactic response to the locally self-generated EGF microgradients [9]. Similarly, the lipid signal LPA is a key determinant of melanoma metas-tasis [10]. Melanoma cells rapidly break down LPA, giving gradients that are low inside and high outside tumours, and provide a steering cue that directs cells out of the tumour.
Because self-generated gradients involve many feedback loops, which can lead to unpredictable behaviour, they are best analysed using mathematical and computational models. The invasion of fibroblast cells in wound healing was con-sidered in [11]. A one-dimensional model was constructed to include the effect of breakdown of platelet-derived growth factor (PDGF), which is both a chemoattractant and a mitogen, through endocytosis of its receptor. The model is shown to pre-dict an invasive wave of cells that dynamically maintain a moderate gradient of PDGF at its leading edge. The invasive wave is robust in the sense that it travels over large length scales where the PDGF concentration varies over orders of mag-nitude, and is not strongly affected by a range of PDGF secretion rates. In [12], the authors consider a simple one-dimensional model incorporating ligand diffusion, receptor expression and receptor and ligand co-internalization in the vicinity of a moving cell collective. The existence of a dynamically main-tained travelling wave solution was established for the coupled system. Furthermore, it was shown that movement of the cell collective results in a higher ligand concentration at the front of the collective compared with that at the rear, thus creating a ligand gradient in the migration direction. This self-generated chemotactic gradient therefore allows the cell col-lective to migrate over large distances. In [7], an agent-based approach was used to simulate the self-generated chemotaxis of a population of cells. Simulations compared well with exper-imental data fromDictyosteliumcells migrating in an under agar assay that was homogeneously seeded with the chemoattractant folate. The agent-based model assumed that individual cells move with a biased random walk with directional persistence arising from an estimate of the difference in receptor occupancy of the individual cells based on the local concentration of the ligand field. Each agent breaks down the ligand, and a linear diffusion model with time-dependent sinks is used to evolve the ligand field in the extracellular region.
While the agent-based approach is flexible and relatively easy to implement computationally, it does not account for important effects such as changes to cell morphology and individual cell polarization. In [13,14], we developed a ‘pseudopod-centred’ [15] model based on a three species reaction–diffusion system involving an autocatalytic local activator, a global inhibitor and a local inhibitor. The read-out level of the local activator was used to drive a simple biomechanical model of forces exerted on the cell membrane by cortical tension and actin polymerization. External signals, where present, steer the cells by slightly biasing their
endogenous movement. Using advanced numerical tech-niques to solve the coupled biochemical and biomechanical system equations, the computational model was remarkably successful in capturing multiple aspects of real cell behaviour including persistent cell migration in the absence of directional signals and chemotaxis in shallow and steep gradient fields [14]. The computational framework was extended recently to model the coupling of physical processes in the extracellular region with those taking place on an evolving cell membrane [16]. This required the development of novel numerical techniques to solve the resulting bulk-surface system of partial differential equations (PDEs). In this paper, we couple the pseudopod-centred model to enzymatic local degradation of chemoattractants to study the ability of single cells, not the populations used in previous work, to affect their own steering by breaking down attractants. Previous studies of self-gener-ated gradients typically consider populations of cells. By fitting parameters to our equations using published estimates fromDictyosteliumresponding to cAMP, we ensure that these studies are physiologically relevant.
The layout of this paper is as follows. In the next section, we introduce the model equations for cell polarization, cell movement and interaction with an extracellular ligand field. This section also includes details of the non-dimensionaliza-tion of the model equanon-dimensionaliza-tions and the reference quantities used based on parameter estimates in the literature. In §3, we outline the numerical techniques used to approximate the time-dependent coupled bulk-surface systems arising from the model. The predictions using the computational model are presented in §4. Finally, we make some con-clusions and suggest some biological implications of our results and suggestions for future research in §5.
2. Methods
2.1. Pseudopod-centred model for cell polarization and
movement
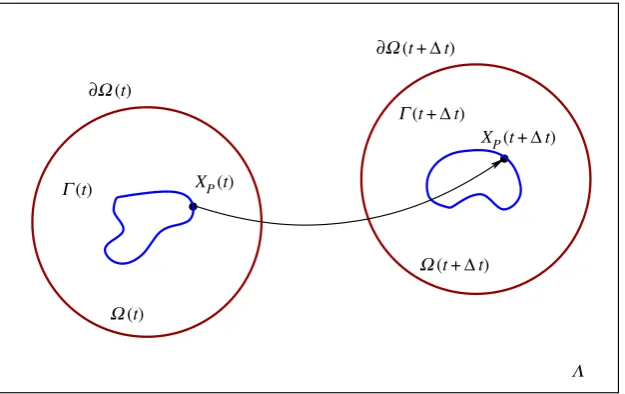
A schematic of the domains over which the model equations are
posed is shown in figure 1. The cell membraneG(t) is assumed to
move through a stationary laboratory frame of referenceL. The
governing equations for the extracellular region are solved on the evolving region between the cell membrane and a
time-dependent circular far-field boundary@V(t), which is located a
distancerffrom the centroid of the intracellular region enclosed
byG(t). We assume that each material pointPlocated atXp(t)
on G(t), has velocity X_pðtÞ. Therefore, there exists a velocity
fieldu, so that points onG(t) evolve such thatX_pðtÞ ¼uðXpðtÞ,tÞ.
Letn¼(n1,n2) denote the unit outward normal toG(t), and
letNðtÞbe any open subset ofR2containingG(t). For any
func-tionzwhich is differentiable inNðtÞ, we define the tangential
gradient on G(t) by rGz¼ rz ðrznÞn, where denotes the
usual scalar product andrzdenotes the usual gradient onR2.
For a vector functionz¼ ðz1,z2Þ[R2, the tangential divergence
is defined by
rGz¼ r z
X2
i¼1
ðrzinÞni:
The Laplace–Beltrami operator onG(t) is defined as the
tan-gential divergence of the tantan-gential gradientDGz¼ rG ðrGzÞ.
The following set of equations was derived from a discrete model proposed by Meinhardt [17]. The model describes the interaction between a membrane-bound local autocatalytic
acti-vator a, a rapidly distributed global inhibitor b and a local
rsfs.r
oy
alsocietypublishing.org
Interfa
ce
Focus
6
:
20160036
inhibitor c. Assuming that the cell boundary G(t) moves with
velocityu, then forx[GðtÞthe equations take the form
@a
@tþ rG ðuaÞ ¼DaDGaþ
sða2=bþb
aÞ
ðscþcÞð1þsaa2Þ
raa, ð2:1Þ @b
@tþ rG ðubÞ ¼DbDGbrbbþ rb
jGðtÞj
þ
GðtÞ
adx ð2:2Þ
and @c
@tþ rG ðucÞ ¼DcDGcþbcarcc: ð2:3Þ
The linear rates of decay of the local activator, global
inhibi-tor and local inhibiinhibi-tor are denoted byra,rbandrc, respectively.
The diffusion coefficients for the three species are denoted by
Da,DbandDc. In the activator equation,sais a saturation
coeffi-cient, sc is a Michaelis –Menten constant and ba is a basal
production rate of the activator. The rate of growth of the local
inhibitorc in the presence of the activatora is determined by
the constantbc. The signal termsincorporates the effect of any
external chemotactic field. Owing to the complexity of real cells and the difficulty in obtaining definitive experimental data, at this stage, we do not prescribe specific molecular realizations to the activators and inhibitors in this model. We therefore prefer to view the model as a top-down approach, where each parameter can potentially represent several molecular species. For example, SCAR/WAVE proteins could play the role of the local activator leading to pseudopod actin nucleation [18].
Actin polymerization creates a protrusive pressure that pushes the cell membrane outward in the normal direction. We assume that the rate of polymerization is proportional to the con-centration of the local activator. The effect of cortical tension is modelled by a retractive force that is proportional to the local curvature of the membrane. The cell membrane is therefore assumed to evolve according to the geometrical evolution law for the normal velocity
Vðx,tÞ ¼Kprotaðx,tÞ lðtÞk, x[GðtÞ, ð2:4Þ
where Kprot is a positive constant and k denotes curvature.
Numerical experimentation with a constant cortical tension coef-ficient can lead to large unphysical variations in the area
enclosed by G(t). We have therefore used a spatially constant
but time-dependent cortical tension factor which is the solution of the dynamic equation
dl
dt¼
l0lðAA0þdA=dtÞ
A0ðlþl0Þ
bl: ð2:5Þ
Here,A0is the initial area of the cell andbandl0are positive
parameters. The solution of equation (2.5) is found using an
explicit Euler method, and the parameter values for band l0
are the same as used in [13].
A more sophisticated model, which includes the effect of the bending rigidity of the membrane, leads to a fourth-order geo-metric evolution law [19]. Although more faithful to the underlying physics, simulations presented in [19] suggest that there is little qualitative difference in the resulting cell mor-phologies and behaviour using this model compared with the simpler second-order model (2.4).
2.2. Ligand diffusion in the extracellular region
We will assume that the material velocityu¼0 in the
extracellu-lar regionV(t) and the concentration of ligand evolves according
to the linear diffusion equation
@l
@t¼DDl, x[VðtÞ, ð2:6Þ
whereldenotes the ligand concentration andDis the
extracellu-lar ligand diffusion coefficient. At the far-field boundary, we assume
lðx,tÞ ¼hðxÞ, x[@VðtÞ, ð2:7Þ
whereh(x) corresponds to a fixed imposed field. At the cell
mem-brane,G(t), we assume that a chemoattractant ligand moleculeL
binds to a receptorR at the rate k1to form a receptor–ligand
complex LR. The complex LR can then disassociate at the rate
k1 releasing the ligand L back off the membrane. We also
allow the possibility of the complex LR to diffuse laterally along the membrane. Finally, we also assume that the total con-centration of bound and unbound receptors is constant and takes
the valueRtot. The concentration of bound receptors,ls, therefore
evolves such that
@ls
@tþ rG ðulsÞ ¼DsDGlsþk1ðRtotlsÞlk1ls,
x[GðtÞ,
ð2:8Þ
whereDsis the membrane diffusion coefficient.
2.3. Enzyme degradation of extracellular ligand field
We now consider extending the model to include membrane-bound enzyme degradation of the extracellular ligand field. We
∂W(t+Dt)
∂W(t)
W(t+Dt)
W(t)
G(t)
G(t+Dt)
L
XP(t+Dt)
[image:3.595.143.456.42.239.2]XP(t)
Figure 1.
We consider the simulation of a motile cell through a fixed laboratory frame of reference
L
. The cell membrane is denoted by
G
(
t
) and the extracelluar
region close to the cell is denoted by
V
(
t
) with far-field boundary
@
V
(
t
). After a time interval of size
D
t
, the material point located at
X
p(
t
) on the cell
membrane
G
(
t
) evolves to the new location
X
p(
t
þ
D
t
).
rsfs.r
oy
alsocietypublishing.org
Interfa
ce
Focus
6
:
20160036
assume that a ligand molecule L first binds to a
membrane-bound enzyme moleculeEat the ratekonforming an enzyme–
ligand complex LE. The complex can disassociate at the rate
koff, or go on to form a productPand the original enzyme
mol-ecule at the rate kcat. Assuming a quasi-steady state in the
concentration of LE and that the total number of enzyme
mol-ecules (bound and unbound) is fixed at Etot, then it can be
shown that
dp
dt¼Vmax
l Kmþl
, ð2:9Þ
wherep is the concentration of product, Vmax¼kcatEtot is the
maximum rate of degradation at a saturating ligand
concen-tration, and Km¼ ðkoffþkcatÞ=kon is the Michaelis –Menten
constant [20]. A balance of fluxes of ligand molecules at the moving cell membrane is expressed in terms of the normal flux boundary condition
D@l
@n GðtÞ
zfflfflfflfflfflfflffl}|fflfflfflfflfflfflffl{Diffusive flux
þ ðunÞljGðtÞ
zfflfflfflfflfflfflffl}|fflfflfflfflfflfflffl{
Advective flux
¼k1ðRtotlsÞljx[GðtÞk1lsVmax
l Kmþl
x[GðtÞ zfflfflfflfflfflfflfflfflfflfflfflfflfflfflfflfflfflfflfflfflfflfflfflfflfflfflfflfflfflfflfflfflfflfflfflfflfflfflfflfflfflfflfflfflfflffl}|fflfflfflfflfflfflfflfflfflfflfflfflfflfflfflfflfflfflfflfflfflfflfflfflfflfflfflfflfflfflfflfflfflfflfflfflfflfflfflfflfflfflfflfflfflffl{Rate of surface reaction
, ð2:10Þ
where the cell is advancing into the extracellular region,
ðunÞ.0, leading to an advective flux onto G(t). Where the
cell is retracing away from the extracellular region,ðunÞ,0,
leading to a flux off of G(t). This asymmetry in terms of the
advective flux can potentially lead to increased ligand flux at the advancing edge of a cell and less at its receding edge. Cell movement can therefore potentially result in a positive feedback of increased ligand concentration at the cell front thus stabilizing the current direction of motion.
2.4. Intrinsic noise
Determining the concentration of bound receptors,lsallows the
estimation of the local fractional receptor occupancy
Roðx,tÞ ¼
lsðx,tÞ
Rtot
: ð2:11Þ
In the absence of any external cues, it has been observed that cer-tain cells move randomly. We therefore include an intrinsic noise component that is independent of the external chemotactic
signal. For this purpose, we assume that the intrinsic noiseht
satisfies a stochastic differential equation of mean reverting type [13]. The combined effect of the response to the external signal and random intrinsic noise is modelled by the term
sðx,tÞ ¼raðhtþRoðx,tÞÞ,
which feeds in multiplicatively to the autocatalytic activator equation (2.1).
2.5. Equation non-dimensionalization
For computational purposes, we next non-dimensionalize the coupled bulk-surface system of equations (2.6), (2.8) and (2.10). To do this, we define the non-dimensional variables
x¼ x
L
, l¼ l
l
, t¼ t
t
and D¼ D
L2
=t
, ð2:12Þ
whereL*is a characteristic length scale,l*is a characteristic ligand
concentration andt*is a characteristic time scale. In terms of the
non-dimensional variables, the ligand diffusion equation (2.6) takes the form
@l
@t¼
DDl, ð2:13Þ
whereD denotes the Laplace operator with respect to the
non-dimensional spatial variables. The non-non-dimensional variables associated with processes at the membrane take the form
ls¼ ls
ðlsÞ
, u¼ u
L=t,
Ds¼ Ds
L2
=t,
Vmax¼ t
ðlsÞ
Vmax ð2:14Þ
and
Rtot¼
Rtot
ðlsÞ
, k1¼
k1
1=ðtlÞ,
k
1¼
k1
1=t,
Km¼
Km
l ,
where ðlsÞ is a characteristic concentration of the ligand –
receptor complex. In terms of these variables, equation (2.8) can be written as
@ls
@tþrG ðulsÞ ¼DsDGlsþk1ðRtotlsÞljx[GðtÞk1ls: ð2:15Þ
Finally, ifðlsÞ¼lL, the normal flux condition (2.10) can be
expressed as
D@
l @n GðtÞ
þ½ðunÞlj
GðtÞ¼k1ðRtotlsÞljx[GðtÞk1ls
Vmax
l
Kmþl
x[GðtÞ
: ð2:16Þ
The non-dimensionalized equations therefore take exactly the same form as the original dimensional equations as long as
ðlsÞ¼lL.
2.6. Choice of reference scales
2.6.1. Time scale
The reference time scale t* is chosen such that the cell speed
obtained from the numerical simulations is 10mm min21which
is approximately the speed of a migratingDictyosteliumcell. In
the numerical experiments, we have used the reference time
scalet*¼1/80 s.
2.6.2. Length scale
The non-dimensional initial radius of the cell in the simulations is
r¼0:1. Assuming an initial cell radiusr0¼5mm [21], we
there-fore have a reference spatial scaleL*¼50mm.
2.6.3. Ligand and receptor concentration scales
In the simulations that follow, the reference ligand concentration is
l*¼1 nM. For the non-dimensional and the dimensional flux
con-ditions to be equivalent, we therefore set ðlsÞ¼lL¼1 nM
50mm. With the reference scales chosen above, the non-dimensional
values for all simulation parameters are therefore specified according to (2.12) and (2.14).
3. Numerical solution of model equations
The solution of the model equations poses a considerable computational challenge involving the approximation of non-linear systems of reaction–diffusion systems on evolving curves coupled to a diffusion equation on an evolving two-dimensional domain. Motivated by the desire to model complex problems in biology and the physical sciences, the numerical solution of bulk-surface PDEs is an area that has received much attention recently. Specific studies include the development and analysis of finite-element discretization methods for steady-state problems on stationary domains [22], and the application of finite-element methods to time-dependent problems on stationary domains [23,24]. The situation is made far more complicated, however, once thebulk and surface domains are time-dependent, and the surface domain is driven by solution components on the surface that are changing dynamically themselves. Here, we outline only the computational techniques used here with detailed descrip-tions given in [13,16]. The reaction–diffusion system (2.1)–(2.3) is approximated, using an arbitrary Lagrangian evolving finite-element method (ALE–FEM) [25]. The ALE framework is necessary when the time-dependent computational mesh does not necessarily move with the material velocity of individ-ual mesh points. The approximation of the cell membrane is obtained using a novel adaptive moving mesh method that moves mesh points in the normal direction with a velocity determined by the geometrical evolution law (2.4). The method simultaneously moves points in the tangential direc-tion to increase the resoludirec-tion of soludirec-tion features or rapid changes to the cell morphology as well as maintaining the over-all quality of the mesh. The bulk diffusion equation is approximated using an ALE–FEM method with piecewise linear elements on an evolving triangular mesh. The bulk mesh is generated using an adaptive approach based on the solution of a system of moving mesh partial differential equations (MMPDEs) [26]. Finally, the coupling of the solution components between the bulk region and the cell membrane is achieved, using a predictor–corrector approach based on a second-order Crank–Nicolson time integration scheme.
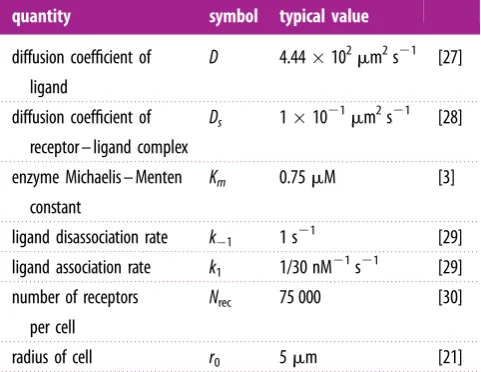
For the numerical simulations, we have assumed an initial circular cell radius r0¼5mm. The non-dimensional par-ameter values for the Meinhardt system (2.1) –(2.3) and the mechanical response to the activator level (2.4) are those used in [13,16]. The physical parameters used for the ligand diffusion model, receptor binding–unbinding and enzyme degradation are based on estimates in the literature for Dictyosteliumcells and are given in table 1.
4. Results and discussion
4.1. Effect of breakdown
To investigate the effect of enzyme breakdown, simulations were first performed using a stationary circular cell embedded in a linear gradient of chemoattractant. In terms of polar coordinates, the initial ligand concentration is set to
lðuÞ ¼lmþmrsinðuÞ, 0u2p, ð4:1Þ
wherelmis the ligand concentration whenu¼0,pandmthe gradient. At the far-field boundary, the ligand concentration is kept fixed at its initial value. The initial ligand field at the back of the cell is determined by an imposed equilibrium receptor occupancyR0, so that
linit back¼
RoKd
1Ro ,
whereKd¼k1=k1is the receptor disassociation constant. The
initial ligand field at the front of the cell is then set to a given percentage increase on that at the back of the cell and this then allows the determination of the linear gradientm.
Simulations were performed using a saturating ligand concentration which results in 95% of available receptors (R0¼0.95) being occupied. A very shallow 2% gradient in
[image:5.595.118.481.43.212.2]the initial ligand concentration from the back to the front of the cell was then imposed. Figure 2 shows the computed steady-state ligand field in the absence of breakdown. We can see that the interaction of the cell membrane receptors alone has a limited effect on the linear field close to the cell. This is due to the inability of the receptors to sequester enough ligand molecules to the cell surface. We see further that the gradient in the receptor occupancy is extremely
Table 1.
Dimensional parameters used in the model of cell migration
based on
Dictyostelium discoideum
cells and the ligand cyclic AMP.
quantity
symbol
typical value
diffusion coefficient of
ligand
D
4.44
10
2m
m
2s
21[27]
diffusion coefficient of
receptor – ligand complex
D
s1
10
21m
m
2s
21[28]
enzyme Michaelis – Menten
constant
K
m0.75
m
M
[3]
ligand disassociation rate
k
11 s
21[29]
ligand association rate
k
11/30 nM
21
s
21[29]
number of receptors
per cell
N
rec75 000
[30]
radius of cell
r
05
m
m
[21]
ligand concentration (nM)
550 555 560 565 570 575 580 585 590 595 600
–4 –3 –2 –1 0
q 1 2 3 4
0.9490 0.9495 0.9500 0.9505 0.9510 0.9515 0.9520
[image:5.595.313.554.306.492.2]fractional receptor occupancy
Figure 2.
Simulated ligand concentration and receptor occupancy for a stationary circular cell with no breakdown. The far-field concentration corresponds to a
saturating field on which is imposed a shallow 2% linear gradient in the ligand concentration from the back to the front of the cell.
rsfs.r
oy
alsocietypublishing.org
Interfa
ce
Focus
6
:
20160036
small, and the absolute value of the receptor occupancy is very close to the initial saturating level. By contrast, figure 3 shows equivalent results whenVmax¼1000 nmoles per 107cells per minute. We can see that receptor occupancy has been reduced to levels corresponding to a ligand concentration level compar-able to the receptor disassociation constantKd¼30 nM. Larger values ofVmaxlead to significant degradation of the ligand field, so that noise dominates the chemotactic signal. On the other hand, smaller values ofVmaxlead to insufficient degra-dation and receptor saturation and loss of chemotactic efficiency. The value ofVmaxused here is somewhat larger than that reported in the literature. For example, Malchow et al.[31] find thatVmax¼1.8 nmoles per 107cells per minute for aggregative stage Dictyostelium cells. It is important to point out, however, that the membrane ligand concentration also depends on the extracellular diffusion coefficient. In the simulations presented here, we have used a value in the litera-ture for cAMP diffusing in agar. However, cAMP is multiply charged, so will interact with other charged molecules in its neighbourhood, so its effective diffusion coefficient will be
lower. Degradation of the ligand field towardsKd-like levels would then require a far smaller breakdown rate.
4.2. Ligand breakdown modulates external chemotactic
signals in a saturating environment
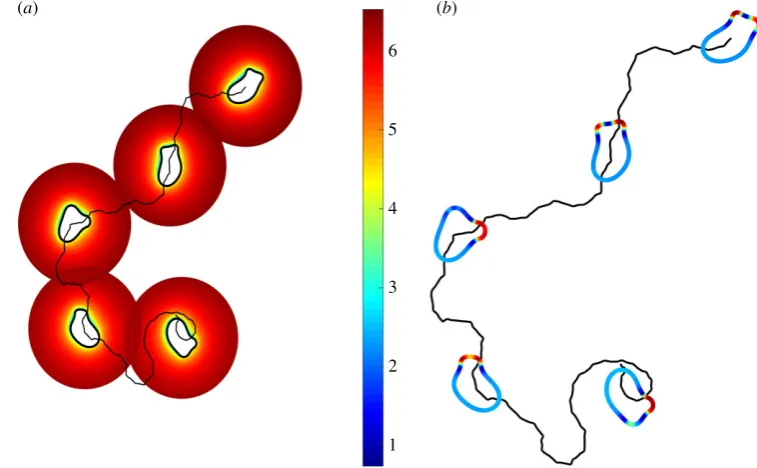
We next allow the cell to move in the same saturating linear chemotactic field considered above. In the simulations that follow, we setVmax¼1000 nmol min21
per 107cells. Figure 4a shows five time-lapsed frames of the computed ligand field and position of the cell. We can see that the effect of ligand breakdown and cell movement leads to a narrow depletion zone around the moving cell that displays an elongated mor-phology with generally two pseudopods driving the migration of the cell at its front. While the cell initially moves in the wrong direction, after a short period it is able to discern the shallow gradient and then directs its movement upgradient. The polarized nature of the local activator concentration driving the cell motion can be seen in figure 4b. As seen in multiple real cell types, directed cell migration is a result of a biased selection
0.131 0.132 0.133 0.134 0.135 0.136 0.137 0.138 0.139
fractional receptor occupanc
y
–4 –3 –2 –1 0
q 1 2 3 4
600
500
400
300
200
100
[image:6.595.117.472.44.212.2]0 ligand concentration (nM)
Figure 3.
Simulated ligand concentration and receptor occupancy for a stationary circular cell with membrane-bound enzyme breakdown.
6
(a) (b)
5
4
3
2
1
Figure 4.
(
a
) Cell migration in an initially saturating linear gradient ligand field. Five snapshots of the position of the cell membrane and ligand field in the
extracellular region. Membrane-bound enzyme degradation results in a depletion zone close to the cell. The continuous black line shows the trajectory of the
cell centroid and the ligand concentration has been plotted on a log scale. (
b
) Colour plot of the local activator level on the cell membrane.
rsfs.r
oy
alsocietypublishing.org
Interfa
ce
Focus
6
:
20160036
[image:6.595.103.482.256.490.2]of pseudopods generated at the front of the cell mainly by a pseudopod splitting mechanism [32].
[image:7.595.103.491.43.234.2]The computed ligand concentration and receptor occu-pancy on the evolving cell membrane are shown in figure 5. We can see that the ligand concentration has been degraded significantly to a level well below the value ofKd. The maximum value occurs at the cell pseudopods, whereas the minimum occurs in proximal lateral regions. There is therefore a significant lateral gradient in the ligand field resulting in a considerable relative difference. We see that the resulting receptor occupancy ranges from around 8% to 20%, and at this level, it is possible for the cell to modulate the generation of pseudopods leading to directed migration. Figure 6a shows the trajectories of the centroids of 16 simulated cells over a time period of 20 min. All of the cells display a biased random walk behaviour, with all but one of them ending up with a net movement in the direction of the chemoattractant gradient. To quantify the directional data, a rose plot of the angle between the straight line joining the initial cell position and the cell centroid att¼20 min is shown in figure 6b. The resultant vector of all the cell dis-placements is shown in red indicating strong evidence of chemotaxis. A Rayleigh test [33] was carried out to investi-gate the null hypothesis that the population is distributed
uniformly around the circle. The test was implemented using the Matlab toolbox CircStat [34]. A calculated value of p¼21024 strongly supports evidence of directional migration. We have also calculated the chemotactic index
time (s) 1
2 3 4 5 6 7 8 9 10 11 12
ligand concentration at membrane (nM)
maximum on membrane minimum on membrane
0 200 400 600 800 1000 1200
time (s)
0 200 400 600 800 1000 1200
0.05 0.10 0.15 0.20 0.25 0.30
receptor occupancy
Figure 5.
Computed ligand concentration and receptor occupancy on the membrane of an evolving cell in a shallow linear chemotactic field.
–200 –200 –100 0 100 200
–100 0
X(µm) Rayleigh p-value = 0.0002
240
270
300 330
0 30 60 90
120
150
180
210
0.4
0.2
Y
(µm)
100 200
[image:7.595.123.475.290.458.2](a) (b)
Figure 6.
(
a
) Cell trajectories for simulated cells migrating in a shallow linear ligand field. A total of 16 cells are simulated over a time period of 20 min. (
b
) Rose
plot of distribution of direction data; the resultant vector is shown in red.
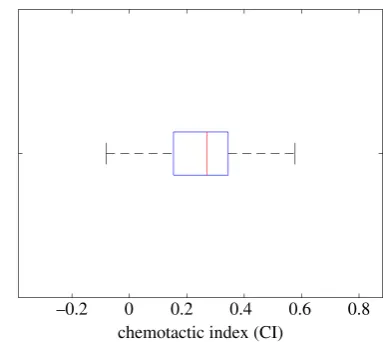
–0.2 0 0.2 0.4 0.6 0.8
chemotactic index (CI)
Figure 7.
Boxplot of the chemotactic index of 16 simulated cells migrating in
an initial saturating linear field of chemoattractant. The mean value
CI
¼
0
:
26 and the standard error of the mean s
:
e
:
CI¼
0
:
04.
rsfs.r
oy
alsocietypublishing.org
Interfa
ce
Focus
6
:
20160036
[image:7.595.331.523.505.676.2](CI) of each simulated cell, which is defined here as the ratio of the displacement in the gradient direction to the total length of the cell trajectory. Figure 7 shows a box plot of the distribution of CI. The mean value CI¼0:26 compares well with the experimentally observed value of CI¼0:25 obtained using a similar linear chemotactic field with an initial mean concentration of 500 nM and gradient
jrlj ¼1 nMmm21[35].
4.3. Breakdown and cell migration in an initially
homogeneous ligand field
Simulations were performed to test the ability of the modelled cells to migrate in an initially homogeneous ligand field. A saturating concentrationl¼570 nM was used correspond-ing to 95% receptor occupancy. Figure 8 shows four snapshots of the computed ligand field in the extracellular region close to a typical migrating cell. We can see that enzyme degradation of the ligand field close to the cell has resulted in a narrow depletion zone where the concentration drops dramatically from the saturating far-field value to a value resulting in a mean receptor occupancy of around 15%.
[image:8.595.110.483.45.236.2]The cell displays undirected persistent cell migration even though the homogeneous far-field concentration would nor-mally lead to receptor saturation.
Figure 9ashows the trajectories of the centroids of 16 simu-lated cells over a time period of 20 min. All of the cells display a persistent random walk behaviour with no apparent overall directional bias. The rose plot and the resultant vector shown in figure 9bindicate that there does not appear to be a pre-ferred mean migration direction. The Rayleigh valuep¼0.91
suggests that there is no evidence to reject the null hypothesis that the angular information is uniformly distributed.
5. Conclusion
We have presented simulations suggesting that single cells can radically change their local chemoattractant levels, in initially saturating environments. Given a correctly tuned degree of breakdown, the ligand field at the membrane can be modu-lated allowing cell receptors to accurately read off shallow gradients leading to efficient chemotaxis. This has strong impli-cations for the generality of self-generated chemotaxis, as well as the dynamic range of chemotactic responses.
6.0
5.5
5.0
4.5
4.0
3.5
3.0
2.5
2.0
1.5
[image:8.595.129.473.309.474.2]1.0
Figure 8.
Cell migration in an initially saturating homogeneous ligand field. Four time frames show the position of the cell membrane and ligand field in the
extracellular region. Membrane-bound enzyme degradation results in a depletion zone close to the cell. The dotted line shows the trajectory of the cell centroid and
the ligand concentration has been plotted on a log scale.
–200 –200 –100 0 100 200
(a) (b)
–100 0
X(µm) Rayleigh p-value = 0.9100
240
270
300 330
0 30 60 90
120
150
180
210
0.2
0.1
Y
(µm)
100 200
Figure 9.
(
a
) Cell trajectories for simulated cells migrating in an initially homogeneous ligand field. A total of 16 cells are simulated over a time period of 20 min.
(
b
) Rose plot of distribution of direction data; the resultant vector is shown in red.
rsfs.r
oy
alsocietypublishing.org
Interfa
ce
Focus
6
:
20160036
In this work, we have assumed ligand breakdown takes place via the activity of membrane-bound enzymes. Ligand degradation can also be achieved using secreted enzymes. Future work will look at the modelling of these additional mechanisms to determine if there are significant differences in migratory behaviour. In our current model, we have also ignored the effect of receptor internalization and receptor expression. These more realistic assumptions can be included as considered in [36] and it remains to be seen under which cir-cumstances these processes have an effect on self-generated chemotaxis. We also plan to investigate the use of near-field boundary conditions based on Green’s functions [37,38] rather than the use of Dirichlet conditions corresponding to an undisturbed field. These should ensure that the compu-tational mesh is not needed to extend far from the evolving cell when diffusion is fast.
The computational model used here has been applied to single cell migration. There is great interest of course on how populations of cells interact, especially when they individually and collectively generate their own chemotactic gradients. We plan to extend the computational framework presented here to investigate the interaction of multiple cells. This will require a procedure for dealing with overlapping computational domains of each individual cell. One possibility is the use of overlapping domain decomposition techniques where each cell can be simulated in parallel thus reducing the overall com-putational cost. We do believe, however, that the detailed information gained through simulations of single cells or the interaction of a few cells could be used to better inform agent-based approaches and the use of macroscopic models
using partial differential equations to evolve cell density fields [39,40]. Currently, such models usually presume that individual cells perceive the concentration of chemoattractant in the bulk medium, in a large-scale gradient. The work we have described shows both presumptions are inaccurate. Taking local breakdown into account, cells may perceive only a small fraction of the bulk attractant concentration, which depending on the level of receptor saturation may make the attractant cause a greater or smaller change in the signal per-ceived by the cell. Similarly, breakdown may reshape the local steepness of gradients as well as their amplitude. The effect of local attractant breakdown should therefore be con-sidered even in larger-scale models.
Authors’ contributions.J.A.M. was involved with the development of the numerical algorithms, performed the numerical experiments and drafted the manuscript. M.N. was involved with the development of the numerical algorithms. R.H.I. provided the biological back-ground material, the design of the numerical experiments and drafted the manuscript.
Competing interests.We have no competing interests.
Funding.M.N. gratefully acknowledges the financial support from the UK Engineering and Physical Sciences Research Council (EPSRC) and Cancer Research UK for a postgraduate studentship award. Core sup-port for R.H.I was provided by Cancer Research UK, grant no. 15672. This work was completed while J.A.M. was a Leverhulme Trust Research Fellow, supported by the award RF-2014-522.
Acknowledgements.J.A.M. thanks the Isaac Newton Institute for Math-ematical Sciences for its hospitality during the programme ‘Coupling Geometric PDEs with Physics for Cell Morphology, Motility and Pattern Formation’, supported by EPSRC grant no. EP/K032208/1.
References
1. Tweedy L, Susanto O, Insall RH. 2016 Self-generated
chemotactic gradients – cells steering themselves.
Curr. Opin. Cell Biol.42, 46 – 51. (doi:10.1016/j.ceb. 2016.04.003)
2. Majumdar R, Sixt M, Parent CA. 2014 New
paradigms in the establishment and maintenance
of gradients during directed cell migration.Curr.
Opin. Cell Biol.30, 33 – 40. (doi:10.1016/j.ceb.2014. 05.010)
3. Bader S, Kortholt A, Van Haastert PJM. 2007 Seven
Dictyostelium discoideumphosphodiesterases
degrade three pools of cAMP and cGMP.Biochem. J.
402, 153 – 161. (doi:10.1042/BJ20061153)
4. Sucgang RH, Weijer CJ, Siegert F, Franke J, Kessin RH.
1997 Null mutations of theDictyosteliumcyclic
nucleotide phosphodiesterase gene block chemotactic
cell movement in developing aggregates.Dev. Biol.
192, 181– 192. (doi:10.1006/dbio.1997.8720)
5. Garcia GL, Rericha EC, Heger CD, Goldsmith PK,
Parent CA. 2009 The group migration of
Dictyosteliumcells is regulated by extracellular
chemoattractant degradation.Mol. Biol. Cell20,
3295 – 3304. (doi:10.1091/mbc.E09-03-0223)
6. Kakebeeke PIJ, de Wit RJW, Konijn TM. 1980 Folic acid
deaminase activity during development in
Dictyostelium discoideum.J. Bacteriol.143, 307– 312.
7. Tweedy L, Knecht DA, Mackay G, Insall RH. 2016
Self-generated chemoattractant gradients: attractant
depletion extends the range and robustness of
chemotaxis.PLoS Biol.14, e1002404. (doi:10.1371/
journal.pbio.1002404)
8. Dona` Eet al.2013 Directional tissue migration
through a self-generated chemokine gradient.
Nature503, 285 – 289.
9. Scherber C, Aranyosi AJ, Kulemann B, Thayer SP,
Toner M, Iliopoulos O, Irimia D. 2012 Epithelial cell
guidance by self-generated EGF gradients.Integr.
Biol.4, 259 – 269. (doi:10.1039/c2ib00106c)
10. Muinonen-Martin AJet al.2014 Melanoma cells
break down LPA to establish local gradients that
drive chemotactic dispersal.PLoS Biol.12,
e1001966. (doi:10.1371/journal.pbio.1001966) 11. Haugh JM. 2006 Deterministic model of dermal
wound invasion incorporating receptor-mediated signal transduction and spatial gradient sensing.
Biophys. J.90, 2297 – 2308. (doi:10.1529/biophysj. 105.077610)
12. Streichan SJ, Valentin G, Gilmour D, Hufnagel L. 2011 Collective cell migration guided by
dynamically maintained gradients.Phys.
Biol.8, 04004. (doi:10.1088/1478-3975/8/
4/045004)
13. Neilson MP, Mackenzie JA, Webb SD, Insall RH. 2011 Modelling cell movement and chemotaxis using
pseudopod-based feedback.SIAM J. Sci. Comput.33,
1035 – 1057. (doi:10.1137/100788938)
14. Neilson MP, Veltman DM, van Haastert PJM, Webb SD, Mackenzie JA, Insall RH. 2011 Chemotaxis: a feedback-based computational model robustly predicts multiple
aspects of real cell behaviour.PLoS Biol.9, e1000618.
(doi:10.1371/journal.pbio.1000618) 15. Insall RH. 2010 Understanding eukaryotic
chemotaxis: a pseudopod-centred view.Nat. Rev.
Mol. Cell Biol.11, 453 – 458. (doi:10.1038/nrm2905) 16. MacDonald G, Mackenzie JA, Nolan M, Insall RH.
2016 A computational method for the coupled solution of reaction-diffusion equations on evolving domains and manifolds: application to a model of
cell migration and chemotaxis.J. Comput. Phys.
309, 207 – 226. (doi:10.1016/j.jcp.2015.12.038)
17. Meinhardt H. 1999 Orientation of chemotactic cells
and growth cones: models and mechanisms.J. Cell
Sci.112, 2867 – 2874.
18. Insall RH, Machesky LM. 2009 Actin dynamics at the leading edge: from simple machinery to complex
networks.Dev. Cell.17, 310 – 322. (doi:10.1016/j.
devcel.2009.08.012)
19. Elliott CM, Stinner B, Venkataraman C. 2012 Modelling cell motility and chemotaxis with
evolving surface finite elements.J. R. Soc. Interface
9, 3027 – 3044. (doi:10.1098/rsif.2012.0276)
20. Cornish-Bowden A. 2013 The origins of enzyme
kinetics.FEBS Lett.587, 2725 – 2730. (doi:10.1016/
j.febslet.2013.06.009)
rsfs.r
oy
alsocietypublishing.org
Interfa
ce
Focus
6
:
20160036
21. Soll DR, Yarger J, Mirick M. 1976 Stationary phase and
the cell cycle ofDictyostelium discoidiumin liquid
nutrient medium.J. Cell. Sci.20, 513 – 523.
22. Elliott CM, Ranner T. 2013 Finite element analysis for a coupled bulk-surface partial differential
equation.IMA J. Numer. Anal.33, 377 – 402.
(doi:10.1093/imanum/drs022)
23. Madzvamuse A, Chung AHW, Venkataraman C. 2015 Stability analysis and simulations of coupled
bulk-surface reaction – diffusion systems.Proc. R. Soc. A
471, 20140546. (doi:10.1098/rspa.2014.0546)
24. Madzvamuse A, Chung AHW. 2016 The bulk-surface finite element for reaction-diffusion systems for
stationary volumes.Finite Elements Anal. Des.108,
9 – 21. (doi:10.1016/j.finel.2015.09.002)
25. Elliott CM, Styles V. 2012 An ALE ESFEM for solving
PDEs on evolving surfaces.Milan J. Math.80,
469 – 501. (doi:10.1007/s00032-012-0195-6)
26. Huang W, Russell RD. 2010Adaptive moving mesh
methods, volume 174. Berlin, Germany: Springer. 27. Dworkin M, Keller KH. 1977 Solubility and diffusion
coefficient of adenosine 30:50-monophosphate.
J. Biol. Chem.252, 864 – 865.
28. Ueda M, Sako Y, Tanaka T, Devreotes P, Yanagida T. 2001 Single-molecule analysis of chemotactic
signaling inDictyosteliumcells.Science294,
864 – 867. (doi:10.1126/science.1063951) 29. Van Haastert PJM, De Wit RJ. 1991 Demonstration
of receptor heterogeneity and affinity modulation by nonequilibrium binding experiments. The cell
surface cAMP receptor ofDictyostelium discoideum.
J. Biol. Chem.259, 13 321 – 13 328.
30. Johnson RL, Vaughan RA, Caterina MJ, Van Haastert PJ, Devreotes PN. 1991 Overexpression of the cAMP
receptor in growingDictyosteliumcells.Biochemistry
30, 6982 – 6986. (doi:10.1021/bi00242a025)
31. Malchow D, Na¨gele B, Schwarz H, Gerish G. 1972 Membrane-bound cyclic AMP phosphodiesterase in
chemotactically responding cells ofDictyostelium
discoideum.Eur. J. Biochem.28, 136 – 142. 32. Andrew N, Insall RH. 2007 Chemotaxis in shallow
gradients is mediated independently of PtdIns 3-kinase by biased choices between random
protrusions.Nat. Cell. Biol.9, 193 – 200. (doi:10.
1038/ncb1536)
33. Fisher NI. 1995Statistical analysis of circular data.
Cambridge, UK: Cambridge University Press. 34. Berens P. 2009 CircStat: A MATLAB toolbox for
circular statistics.J. Stat. Soft.31, 1 – 21. (doi:10.
18637/jss.v031.i10)
35. Varnum B, Soll DR. 1984 Effects of cAMP on single
cell motility ofDictyostelium.J. Cell Biol.99,
1151 – 1155. (doi:10.1083/jcb.99.3.1151) 36. Garcı´a-Pen˜arrubia P, Ga´lvez JJ, Ga´lvez J. 2014
Mathematical modelling and computational study of two-dimensional and three-dimensional dynamics of receptor – ligand interactions in
signalling response mechanisms.J. Math. Biol.69,
553 – 582. (doi:10.1007/s00285-013-0712-4) 37. Ditkowski A, Suhov A. 2008 Near-field infinity
simulating boundary conditions for the heat
equation.Proc. Natl. Acad. Sci. USA105, 10 646 –
10 648. (doi:10.1073/pnas.0802671105) 38. Suhov A, Ditkowski A. 2011 Artificial boundary
conditions for the simulation of the heat equation
in an infinite domain.SIAM J. Sci. Comput.33,
1765 – 1784. (doi:10.1137/100794171) 39. Sherratt JA. 1994 Chemotaxis and chemokinesis
in eukaryotic cells: the Keller – Segel equations
as an approximation to a detailed model.Bull.
Math. Biol.56, 129 – 146. (doi:10.1007/ BF02458292)
40. Hillen T, Painter KJ. 2009 A user’s guide to PDE
models for chemotaxis.J. Math. Biol.58, 183 – 217.
(doi:10.1007/s00285-008-0201-3)