O R I G I N A L A R T I C L E
Porosities of building limestones: using the solid density
to assess data quality
Christopher Hall.Andrea Hamilton
Received: 15 June 2015 / Accepted: 16 December 2015
ÓThe Author(s) 2016. This article is published with open access at Springerlink.com
Abstract A good knowledge of the volume-fraction porosity is essential in any technical work on porous materials. In construction materials the porosity is commonly measured by the Archimedes buoyancy method, from which the bulk density of the test specimen is also obtained. The porosity and the bulk density together fix the solid density of the specimen, as only two of the three quantities are independent. The solid density, although rarely discussed, is determined by the mineralogy of the specimen, and therefore can provide a valuable check on the accuracy of porosity and bulk density measurements. Our analysis of published data on calcitic limestones shows that the solid density is generally close to the ideal crystallographic density of calcite. Small devi-ations can often be traced to varidevi-ations in mineral composition. However some published porosity–den-sity data are inconsistent with the known mineralogy. Deviations which cannot be ascribed to composition may be assumed to arise from measurement errors. We show the value of using the solid density as a quality check on the measured porosity. We recommend that
the solid density should always be calculated for this purpose when the Archimedes method is used. This check can be useful also when porosities are measured by helium pycnometry or by mercury intrusion porosimetry.
Keywords PorosityDensityArchimedes method
LimestoneCalcite
1 Introduction
Most inorganic construction materials, including the main building stones, are porous. In research on mechanics, transport, and durability in these materials, the porosity is often used as an explanatory (indepen-dent) variable, and so it is measured and reported as a material property. The porosity appears as a parameter in many technical calculations in building physics. There are now hundreds of publications containing porosity data, stretching back to the early method papers of Purdy and Moore [1], and of Washburn and his collaborators [2–4]. The data on construction materials form a subset of the larger resource that includes related work in geology, petrophysics, and industrial ceramics.
Unfortunately, reported porosity data are not always of high quality. Porosity values are sometimes incon-sistent with the stated bulk densities and the known mineral compositions, and are therefore probably inaccurate. In this paper, we examine some published C. Hall (&)
School of Engineering, University of Edinburgh, Edinburgh EH9 3FB, UK
e-mail: [email protected]
A. Hamilton
Department of Civil and Environmental Engineering, University of Strathclyde, Glasgow G1 1XJ, UK e-mail: [email protected]
data on the porosities of limestones, a group of building materials where the material composition is often known, or can be assumed to lie within narrow limits. We aim to show that estimating the solid density from porosity and bulk-density data provides a simple quality check on the measured specimen porosity.
2 Measuring the porosity
2.1 The Archimedes method
The porosity of building stones is usually measured by the long-established Archimedes buoyancy method— see [5, 6] for practical descriptions of such tests, and [7] for a recent discussion. Test procedures can be found in EN 1936 [8], which is the basis of many European national standards. Similar methods are described in EN 772 [9]. No equivalent American standard method exists for porosity in natural stone. In ASTM C97 [10] the bulk density is determined by a buoyancy method, but the porosity is not calculated.
In the Archimedes method three quantities are mea-sured on a single specimen:wd, the weight of the dry specimen;wsat, the weight in air of the specimen fully saturated with a liquid (usually water); and wA, the weight of the saturated specimen suspended and fully immersed in the saturating liquid. The last of these, wA, is known as the Archimedes weight. From these three quantities, the bulk densityqb, the solid density qs, and the volume-fraction porosityfof the specimen can be calculated from the following equations:
qb¼ wdqw wsatwA
; ð1Þ
qs¼ wdqw wdwA
; ð2Þ
f ¼wsatwd
wsatwA
¼1qb
qs
: ð3Þ
Hereqwis the density of the saturating liquid at the temperature of the measurement. Strictly, the quantity fis the open porosity, the pore-space accessible to the saturating liquid. Any closed pores are treated as part of the solid material, and the solid density qs is accordingly the density of the impermeable matrix, including any closed pores.
Equations 2 and 3 follow from the Archimedes buoyancy relations
Vs¼ ðwdwAÞ=qw; ð4Þ
and
Vb¼ ðwsatwAÞ=qw; ð5Þ
where Vs,Vb are the solid and bulk volumes of the specimen. Of the quantititiesqs,qbandf, any two are independent (knowing two, the third is fixed). In publications providing porosity data, the bulk density is sometimes also reported. Surprisingly, the solid density is rarely given. Even if given, it is rarely the subject of much comment.
The Archimedes method is conceptually simple, but in practice prone to error. In measuring wA and wsat, it requires care to achieve complete saturation of the specimen using vacuum apparatus. To obtainwd, the specimen must be completely dried without thermal alteration of the material composition or structure. In measuringwsatliquid may be lost from the specimen by evaporation, or sometimes by drainage from low-suction cavities and cracks.
Equations1–3 show how these three sources of measurement error affect the estimates off,qb, andqs. (1) When the test specimen is not completely driedwd is too high. It then follows that qb is overestimated, while both f and qs are underestimated, as shown schematically in Fig. 1. (2) As discussed in [7], failing to saturate the specimen completely leaves the value ofqbunchanged, but leads to underestimates of bothf andqs. (3) Any loss of water from the surface of the saturated specimen before it is weighed in air means thatwsatis too low. This causes the bulk volumeVbto be underestimated, and as a resultqbis overestimated, andfunderestimated, while the value ofqsis correct. None of these three measurement errors causes the solid density to be overestimated.
A serious practical problem in implementing the Archimedes method is that reference materials of certified porosity are not available. This makes traceable calibration difficult. The published literature also shows a wide variation in the estimates of uncertainty used by different authors in reporting porosity and density. 2.1.1 Effects of measurement errors on porosity
and density estimates
Appendix we give the exact relations between the relative errors in the dry weight or in the saturated weight and the associated relative errors in the calculated quantities. The relative errors in the poros-ity and the solid densporos-ity may sometimes be consider-ably larger than the relative errors in the measured weights. For example, in the case of incomplete saturation in a specimen with a solid density of 2500 kg/m3and porosity 0.2, a-1 % relative error in the saturated weight wsat leads to a -11 % relative error in the porosity. In a test in which the specimen is incompletely dried, a?1 % relative error in the dry weight leads also to a -11 % relative error in the porosity, and to a -2 % relative error in the solid density. Careful experimental technique is required to minimize such amplification in errors.
2.2 The solid density, the real density and closed porosity
In the Archimedes method, the solid density qs is obtained from Eq.2 (or in practice from Eq.3). However the quantityqs is not calculated in the test procedures of EN 1936, which instead describes a stand-alone method to determine the so-called real density qr on a powdered specimen using a liquid pycnometer. Powdering is considered to remove
closed porosity (although the evidence for this is not clear). The total porosity fT is then calculated from Eq. 3: fT¼1qb=qr. It is unusual however for laboratories using the procedures of EN 1936 to report both open and total porosity. When both are deter-mined, the differencefTf is used as a measure offc, the volume-fraction closed porosity, although as the small difference of two experimental quantities it may be of low accuracy. Detecting and measuring closed porosity in stones and other porous inorganic materials is a difficult matter, for which there are no satisfactory general methods.
2.3 Variants and alternatives
In a variant of the Archimedes method, used when the specimen is in the form of a regular cylinder or a rectangular block, the bulk volume Vb is calculated directly from the specimen dimensions. The bulk density is then calculated from the formula qb¼ wd=Vb, and the porosity from the formula f ¼1 ðwdwAÞ=ðqwVbÞ. The saturated weight wsat is not required, although the specimen must be fully satu-rated in order to measure the Archimedes weightwA. This variant eliminates errors arising from problems in weighing the saturated specimen in air. These may be severe in specimens with coarse porosity which lose liquid by drainage.
An alternative to the standard Archimedes method is to obtain the open porosityfby helium pycnome-try [11], a technique often used in petrophysics but rarely for building materials. The solid volumeVsof the specimen is measured directly by expanding a known volume of helium gas into the open pores. Knowing the dry weight wd, we calculate the solid densityqs¼wd=Vs. The porosityfis then calculated from the formulaf ¼1qb=qs(Eq.3). All measure-ments are made on the dry specimen, and liquid saturation is not needed (although it may be used to obtain the specimen bulk volumeVb). Assuming that the open pore-space is equally accessible to helium and to the saturating liquid used in the Archimedes method, the two methods measure the same porosity f [11]. However, it is an open question whether this assumption is precisely true. Open porosities obtained by mercury-intrusion porosimetry may also be reported, but are often in poor agreement with Archimedes porosities where both are measured.
Bulk density ρb (kg/m3)
Volume fraction porosity
f
Complete drying
Incomplete drying
Bulk density ρb (kg/m3)
Solid density
ρs
Complete drying
Incomplete drying
[image:3.547.49.261.54.239.2]3 Limestones
Limestones are an important group of building mate-rials used throughout the world as dimension stones in masonry construction. In this paper, we use the term limestone to include also chalks, marbles, and travertines. In most building limestones, the main carbonate mineral is calcite, although there is a small subgroup in which it is dolomite. Many building limestones have high calcite contents, often over 90 wt%, sometimes over 98 wt%. Other minerals which may be found in the composition (usually in small quantities) are quartz, occasionally feldspars, and the high-density iron minerals haematite, goethite and siderite. Minor amounts of clays, notably illite, and micas such as glauconite, may also be present. When present, these minerals influence the density of the limestone, and their individual densities are listed in Table1. The calcite phase in limestones is close to CaCO3 in composition, but may contain small
amounts of substitutional Mg. The effect of this is to increase slightly the mineral density, so that calcite containing 1.5 mol% Mg has a density of 2715 kg/m3, compared with 2709 kg/m3for pure calcite.
If the mineral composition of a stone is known, we can calculate its composite mineral density [CMD], which we denoteqCM. A specimen of solid volumeVs consists ofimineral components, each of volumeVsi,
so that qCM¼
X
viqi; ð6Þ
wherevi¼Vsi=Vs is the solid volume fraction of the componenti, andqiits mineral density. (The CMD is
the quantity that the real density qr as defined
operationally in EN 1936 aims to measure). The CMD of a pure calcite limestone is of course 2709 kg/ m3. In the general case where the solid material incorporates closed pores, the volume-fraction closed porosity fc¼fTf ¼qbð1=qs1=qCMÞ. Therefore the solid densityqs¼qbqCM=ðfcqCMþqbÞ.
3.1 Calcitic limestones
We showed previously [7] that for 61 British and Irish calcitic limestones from the BRE Stone List [13] the relation between porosity and bulk density is well represented by the equation
qb¼Cð1fÞ; ð7Þ
withC¼qc, the solid density of calcite, 2709 kg/m
3.
This equation follows of course from the second part of Eq. 3, setting qs¼qc for the particular case of calcitic limestones. What is surprising about the result reported in [7] is how little variation there is in the measured solid density in a large set of commercial limestones.
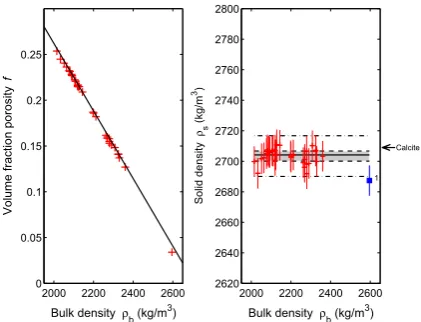
To these 61 limestones, we have now added data from other sources to make a larger porosity–density dataset of 117 calcitic limestones. All the additional data come from published research studies in which the materials and test methods are clearly described [7, 14–20]. All the sources use the Archi-medes method of EN 1936, except [17] in which helium pycnometry is used. In Fig.2Leftwe see that the porosity–density data for the entire set lie close to the ideal calcite line. The best fit to Eq. 7 has C=2708 kg/m3, indistinguishable from the calcite line. The spread of the data is shown in Fig.2Right, where the solid density of each specimen, qs¼ qb=ð1fÞ(Eq.3) is plotted against qb. The median ofqsis 2709 kg/m
3
[image:4.547.47.262.514.665.2], the same as the mineral density of calcite. The interquartile range (IQR), a measure of the spread inqs, is 12 kg/m3, about 0.4 % of the median. It is conventional to define outliers as datapoints which lie more than 1.59IQR above the first quartile, or 1.5 9 IQR below the third quartile. By this definition, there are eight outliers in the set of 117 limestones, although these outliers are hard to discern in Fig.2 Left. They are identified individually in the caption to Fig.2. For the outlier Portland specimens 1, 3, there are no mineralogical reasons to expect an abnormal solid density. Outlier 2 is Ham Hill Lower Bed limestone. This is known to contain at least 90 wt%
Table 1 Mineral densities [7,12]
Mineral Solid density (kg/m3)
Calcite 2709
Dolomite 2866
Quartz 2648
Orthoclase &2590
Siderite 3944
Haematite 5275
Goethite 4269
Illite &2750
Kaolinite &2645
calcite, along with a small amount of goethite and quartz (DP Jefferson, private communication). The observed solid density is accounted for by 2.5 wt% goethite, and 5 wt% quartz. The Green Purbeck marble is described as containing iron-rich glauconite, although we have no compositional information on specimens tested. The two low outliers, 7, 8, are Monte Acuto specimens. The porosity data are reported to only two significant figures, so the uncertainty in the calculated solid density qs is greater than for lime-stones from other sources.
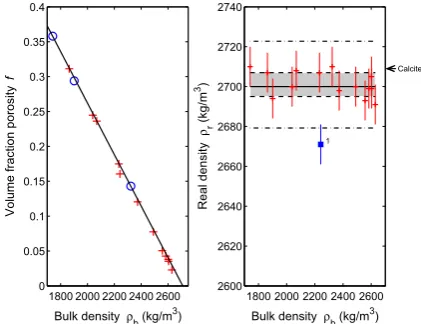
It is interesting to compare the data of Fig. 2with a dataset in which the solid density is obtained directly on crushed material, so perhaps reducing the possi-bility of including any closed porosity inqs. Bednarik et al. [21] report porosity data on 12 limestones from the Leitha formation in Austria using this method. To
these, we can add also three high-calcite Spanish limestones for which real density data are given by Va´zquez et al. [20]. For the Spanish stones, the calcite content is known by analysis to be C97 wt%. As shown in Fig.3, the data plot close to the ideal calcite line, with a small interquartile range. The only outlier is the Zeilerberg limestone of the Leitha group, with a solid density of 2671 kg/m3, 1.5 % below the ideal calcite value. We have no quantitative mineralogical information on the Zeilerberg stone, but its petro-graphic description mentions the presence of quartz. The important conclusion is that these data (which are based on real density) closely resemble the large dataset of Fig. 2(which is based on the Archimedes solid density). Both the solid density and the real density are the same as the calcite mineral density, so there is no indication of any closed porosity in these calcitic limestones.
Not all published porosity–density data on lime-stones conform closely to the pattern of Fig.1. Figure4 shows data on 23 British and Irish calcitic limestones from a reference source [22]. Here the spread about the ideal calcite line is large, with an interquartile range of 218 kg/m3. There are a number of extreme outliers, and for many of the stones the
1500 2000 2500 0 0.1 0.2 0.3 0.4 0.5
Bulk density ρb (kg/m3)
Volume fraction porosity
f
1500 2000 2500 2600 2620 2640 2660 2680 2700 2720 2740 2760 2780 2800
Bulk density ρb (kg/m3)
Solid density ρs (kg/m 3) Median 5 2 3 1 6 4 8 7
Fig. 2 Left Porosity f vs bulk density qb for 117 calcitic
limestones. The stones included are:times symbol61 British and Irish limestones from the BRE Stone List [13]; plus symbol16 specimens of eight French and English limestones (Ancaster, Chauvigny, Clipsham, Massangis, Monk’s Park, Portland, and Richemont) [7]; white circle 20 specimens of Portland limestone [15]; white up-pointing triangle 11 specimens of Monte Acuto limestone [17]; diamond Savonnie`res lime-stone [18]; white down-pointing triangle Savonnie`res lime-stone [14]; white square Maastricht limestone [16]; filled
circlefour French limestones (Euville, Savonnie`res, Massangis,
Coulmier-le-Sec) [19]; filled square two Spanish limestones (Fraga Campanil, Santa Pudia) [20]. The solid lineis the ideal calcite relation, Eq. 1, with C=2709 kg/m3. Right Solid densityqsversus bulk densityqbfor the same 117 limestones.
The median value of the solid densityqs is 2709 kg/m3. The
grey bandshows the interquartile range, 12 kg/m3. Thesolid
squaresmark outliers:1Portland Independent Whitbed,2Ham
Hill Lower Bed, 3Portland Bowers Base Bed, 4Maastricht,5
Green Purbeck Marble, 6Totternhoe, 7,8Monte Acuto
1800 2000 2200 2400 2600 0 0.05 0.1 0.15 0.2 0.25 0.3 0.35 0.4
Bulk density ρ
b (kg/m 3
)
Volume fraction porosity
f
1800 2000 2200 2400 2600 2600 2620 2640 2660 2680 2700 2720 2740
Bulk density ρ
b (kg/m 3 ) Real density ρr (kg/m 3) Calcite 1
Fig. 3 LeftPorosity f versus bulk density qb for 12 Leitha
limestones [21] plus symboland three Spanish limestones [20]. The points plotted for Leitha stones are the means of measurements on several specimens from each source (89 in total), and for the Spanish stones the means of nine specimens of each type. The solid lineis the ideal calcite line, and not a regression line.RightReal densityqrversus bulk densityqbfor
the same 15 limestones. The median value of the solid densityqr
[image:5.547.49.260.287.454.2] [image:5.547.286.497.382.544.2]values of solid density calculated from the porosity and density cannot be reconciled with the known mineral composition.
We note that Mosch and Siegesmund [23] (see also Mosch [24]) have carried out statistical analyses of the technical properties of large number of building stones, including more than 200 limestones. Their graphs of porosityvsbulk density show considerable scatter, but regression equations are not given. Neither the numerical values nor the sources of the data are stated. Therefore we cannot compare these analyses with the findings we report here.
3.2 Portland limestone
Portland stone is a high-calcite limestone which has been used in the construction of public buildings in Britain for many centuries [25]. Portland building stone is extracted at a number of quarries and mines on the Isle of Portland, Dorset, on the south coast of England. Stone is taken from three horizons at increasing depths, and designated as roach, whitbed and base bed respectively.
Because of its prominence and accessibility, Port-land stone is often used in technical studies of stone behaviour and properties. Porosity–density data are available from many sources, both in the research literature and in technical data sheets from commercial suppliers. Although there are numerous petrographic descriptions of materials from different quarries and different geological horizons (see for example
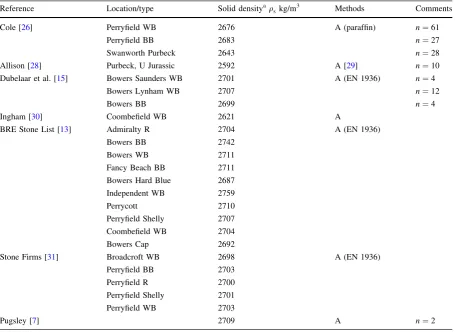
Cole [26] and Palmer [27]), quantitative mineralogi-cal analysis is sparse. However there is broad agree-ment that the calcite content of Portland stone is generally at least 95 wt%. Dubelaar et al. [15] report from XRF analysis that the Portland whitbed stone from Bowers Quarry has a calcite content of 97–98 wt%, with 1–2 wt% silica, and is ‘‘almost free of clay and iron minerals’’. Cole [26] found at least 98 wt% calcite in cores analysed by X-ray diffraction. We have looked in detail at porosity–density data from the sources that we list in Table2. In most cases, the solid density qs is not reported, but we have calculated it from the published bulk-density and porosity data. The range of solid density is 2592–2759 kg/m3, clustered around a median value of 2703 kg/ m3, with five outliers, as shown in the box plot, Fig.5
left. The low outliers 1, 3 come from the data of Cole [26], who made an extensive study of port-landian limestones in which porosity–density mea-surements were made on over 800 specimens. However, most were geological field specimens, and we include here only the three sets of data obtained on quarry stones. Fig.5Rightshows the data of Cole and of Allison from Table2. Thesef–qb data lie slightly but distinctly below the ideal calcite line. The corresponding solid densities (see Table 2) are not consistent with the high calcite mineral composition. It could be argued that this is an indication of a small amount of closed porosity, but there is little evidence of that from other data on Portland stones.
We now exclude the outlier data, and consider the data from the central cluster only. Figure6shows that f–qb data lie close to the ideal calcite line; there is a single marginal outlier, but this is a stone of unusually low porosity. The median solid density is 2705 kg/m3, with an interquartile range of 7 kg/m3. The median solid density is therefore only about 0.15 % below the crystal density of mineral calcite. This difference sets an upper limit to the closed porosityfc, which therefore appears to be negligible in Portland stone.
3.3 Maastricht limestone
Maastricht limestone has been widely used as a dimension stone in Belgium [32], and has been the subject of several studies of water transport and durability. It is an exceptionally porous material, with f as high as 0.55. Maastricht stone is highly calcitic: Van Hees and Nijland [33] give CaCO3contents of
1800 2000 2200 2400 2600 28000 0.05
0.1 0.15 0.2 0.25 0.3
Bulk density ρb (kg/m3)
Volume fraction porosity
f
1800 2000 2200 2400 2600 2200
2300 2400 2500 2600 2700 2800 2900 3000 3100 3200 3300
Bulk density ρb (kg/m3)
Solid density
ρs
(kg/m
3)
Calcite
Fig. 4 Left Porosity fversus bulk densityqb for 23 British
limestones [22]. The solid lineis the ideal calcite line.Right
[image:6.547.48.261.460.623.2]95–98 wt%, with the balance mainly as substitutional Mg. The composite mineral density is therefore expected to be in the range 2710–2715 kg/m3. Pub-lished density/porosity data are not entirely consistent. Cnudde et al. [16], using EN 1936 methods, report f=0.517±0.008, andqb¼132218 kg/m
3, values
which correspond to a solid densityqs¼27378 kg/ m3, about 1 % higher than the composite mineral density. On the other hand, Van Hees & Nijland [33] give data based on RILEM CPC 11.3 methods which correspond toqs= 2653±6 kg/m3, about 2 % lower than the composite mineral density. A third study, by Rescic et al. [34], using helium pycnometry, reports solid densities for quarry and building specimens of 2680 and 2770 kg/m3. Even allowing for some variability in the materials tested, it appears that the solid density of Maastricht stone is not known to better than about±3 %.
3.4 Tuffeau limestones
While Fig.2shows that a large number of the calcitic limestones used in construction have solid densities close to that of pure calcite, there are of course exceptions. Tuffeau is the name used to describe certain high-porosity siliceous limestones of northern France. The mineral composition is complex, and tuffeau stones typically contain only about 50 wt% calcite. For tuffeau quarry specimens from Marigny-Brizay, Robert [35] found the Archimedes porosity f =0.460, and the solid density qs¼2550 kg/m
3
[image:7.547.47.503.72.404.2](mean values, n =15). The value of qs, although much lower than that of calcite, is consistent with the reported XRD mineral composition (wt% calcite 48; quartz 23; opal-CT 13; orthoclase 2; glauconite/ smectite clay 14). Allowing for some uncertainty in the individual densities of opal-CT (2000 kg/m3),
Table 2 Sources of porosity–density data for Portland stones
Reference Location/type Solid densityaqs kg/m
3 Methods Comments
Cole [26] Perryfield WB 2676 A (paraffin) n¼61
Perryfield BB 2683 n¼27
Swanworth Purbeck 2643 n¼28
Allison [28] Purbeck, U Jurassic 2592 A [29] n¼10
Dubelaar et al. [15] Bowers Saunders WB 2701 A (EN 1936) n¼4
Bowers Lynham WB 2707 n¼12
Bowers BB 2699 n¼4
Ingham [30] Coombefield WB 2621 A
BRE Stone List [13] Admiralty R 2704 A (EN 1936)
Bowers BB 2742
Bowers WB 2711
Fancy Beach BB 2711 Bowers Hard Blue 2687 Independent WB 2759
Perrycott 2710
Perryfield Shelly 2707 Coombefield WB 2704
Bowers Cap 2692
Stone Firms [31] Broadcroft WB 2698 A (EN 1936)
Perryfield BB 2703
Perryfield R 2700
Perryfield Shelly 2701
Perryfield WB 2703
Pugsley [7] 2709 A n¼2
BBbase bed, Rroach, WBwhitbed,AArchimedes method,ndenotes the number of specimens, where reported
and clay (2300 kg/m3), we calculate a composite mineral density in the range 2570 ± 30 kg/m3, as found. Similar results have been obtained by
Beck et al. [36] on tuffeau specimens of similar composition from Saint-Cyr-en-Bourg.
4 Recommendations for data checking
From our analysis, we suggest that it is valuable to apply two procedures to check porosity–density data obtained by the Archimedes method.
First, in all cases, the solid density qs should be calculated from the experimental data using Eq.3. This value should be checked for consistency with the composite mineral density. The CMD may be known from previous work on the same or similar materials, or may be calculated from mineralogical data on the specimen, for example by quantitative X-ray diffrac-tion analysis. In the event that theqs andqCM differ significantly, then errors of type (1) and (2) in the Archimedes tests may be suspected. These concern incomplete drying and incomplete saturation of the specimen. If the difference persists, then the possibil-ity of closed porospossibil-ity should be considered.
Second, wherever possible the bulk volume of the specimen should be calculated by measuring the specimen dimensions, and this value ofVbcompared with the Archimedes value obtained from Eq.5. If the values differ significantly, errors in the measurement of the quantitieswsatand/orwAmay have occurred. An error that arises in measuringwsat, the saturated weight in air, does not produce an error in the solid density calculated from Eq.2.
The solid density also provides a useful quality check when the porosity has been measured by a non-Archimedes method, such as mercury intrusion porosimetry or helium pyknometry. Provided that the bulk density has also been measured, then the solid density can be calculated from Eq.3, and this should be compatible with the known mineral composition.
5 Conclusions
1. For calcitic limestones as a group, the published data show that the porosity and bulk density generally lie close to Eq.7 with the constant Cclose to the crystallographic density of calcite. 2. The solid density can provide a check on the accuracy of the porosity measurement because it should generally be possible to reconcile it with
2600 2650 2700 2750
Solid density ρs (kg/m3)
1 2 3 4 5
2000 2200 2400 2600
0 0.05 0.1 0.15 0.2 0.25
Bulk density ρ
b (kg/m
3
)
Volume fraction porosity
f
Fig. 5 LeftBox plot of the solid density of Portland stones from sources listed in Table2. Theboxshows the interquartile range,
thecentral linemarking the median. Outliers (white circle) are:
1 Purbeck, U Jurassic [28], 2 Coombefield WB [30], 3
Swanworth Purbeck [26], 4 Bowers Base Bed [13], 5
Independent WB [13].RightPorosityfversus bulk densityqb:
data of Cole [26] for Swanworth (plus symbol), Perryfield WB
(blue circle) and Perryfield BB (times symbol) Portland stones,
and of Allison [28] (blue square) for Purbeck stone. The solid lineis the ideal calcite line
2000 2200 2400 2600 0
0.05 0.1 0.15 0.2 0.25
Bulk density ρb (kg/m3)
Volume fraction porosity
f
2000 2200 2400 2600 2620
2640 2660 2680 2700 2720 2740 2760 2780 2800
Bulk density ρb (kg/m3)
Solid density
ρs
(kg/m
3)
Calcite
1
Fig. 6 Left Porosity f versus bulk density qb for Portland
limestones,n¼38, plus symbol. The solid line is the ideal calcite line.RightSolid densityqsversus bulk densityqbfor the
[image:8.547.48.262.51.244.2] [image:8.547.49.260.381.542.2]information about composition, mineralogy and microstructure.
3. A quantitative mineral composition, for example by quantitative Rietveld XRD, is an invaluable item of support information. This allows the solid density (the composite mineral density) to be estimated and compared with the solid density calculated from the bulk density and porosity. 4. If the Archimedes solid density is not consistent
with the specimen mineralogy, then possible measurement errors should be considered. 5. Errors that arise from the drainage of saturating
liquid from the specimen before weighing in air do not reveal themselves in an incorrect solid density. They can however be detected by com-paring the Archimedes bulk volume with that measured directly from the specimen dimensions. 6. Any closed porosity is included in the solid matrix and contributes to the solid density. We do not see strong evidence for closed porosity in the calcitic limestones we analyze here, although of course it may be present in other stones, and in other construction materials such as fired-clay ceramics. 7. The solid density may also provide a useful test of data quality in measurements of porosity using other methods, such as helium pycnometry and mercury intrusion porosimetry.
These conclusions are supported here by our analysis of data on calcitic limestones, but the recommenda-tions stand with equal force for all porous construction materials tested by the Archimedes method.
Acknowledgments We are grateful to the following for information and advice: Wim Dubelaar, Rob van Hees, Rudolf Holzer, David Jefferson, Roman Koch, Tim Palmer, Maurice Rogers, and Tiziana Vanorio.
Open Access This article is distributed under the terms of the Creative Commons Attribution 4.0 International License (http://
creativecommons.org/licenses/by/4.0/), which permits
unrest-ricted use, distribution, and reproduction in any medium, pro-vided you give appropriate credit to the original author(s) and the source, provide a link to the Creative Commons license, and indicate if changes were made.
Appendix
We discuss here how measurement errors affect the calculated bulk density, solid density, and porosity.
1. Incomplete drying Here there is an error in the measured dry weight wd. If the relative error ewd¼ ðw
0
dwdÞ=wd, wherew0ddenotes the erro-neous dry weight andwd the true value, then it follows directly from Eq.1that the relative error in the bulk density is the same, that iseqb¼ewd. However, the relative errors in the porosity and solid density are more complicated in form. Thus, ef ¼ ewdðqs=qwÞð1fÞ=f. A positive relative error in the dry weight leads to a numerically larger negative relative error in the porosity. The relative error in the calculated solid densityeqs ¼
½ð1fÞeqbþfef=½1fðefþ1Þ ¼ ½ðqsqwÞ
ewd=½qwþqsewd. Since qs[qw, a positive rel-ative error in the dry weight leads to a negrel-ative (and somewhat larger) relative error in the solid density.
2. Incomplete saturationHere there is an error in the measured saturated weight wsat; however the quantity wsatwA is unaffected by this error. It follows from Eq.1 that the relative error in the bulk densityeqb is zero. However a relative error in the saturated weight ewsat ¼ ðw
0
satwsatÞ=wsat produces errors in the calculated porosity and the calculated solid density. Thus, ef ¼ ð1
fÞðqs=qwÞewsat=f. Since ewsat is necessarily nega-tive, ef is likewise negative, but numerically
larger. The relative error in the solid density eqs ¼qsewsat=ðqwqsewsatÞ. Sinceqwis generally much greater thanqsewsat, a negative relative error in the saturated weight leads to a negative, and numerically larger, relative error in the solid density.
3. Loss of water in a nominally saturated specimen Here there is an error in the measured saturated weightwsat; however there is no associated change in the Archimedes weight wA. In this case, it is obvious from Eq.2that the relative error in the solid density,eqs, is zero. However a relative error in the saturated weight ewsat produces a relative error in the bulk densityeqb¼ ewsat=½ewsat þqw=
positive, ef is negative and numerically larger
thaneqb.
References
1. Purdy RC, Moore JK (1907) Pyro-chemical and physical properties of clays. Trans Am Ceram Soc 9:204–318 2. Washburn EW (1921) Porosity: I. Purpose of the
investi-gation. II. Porosity and the mechanism of absorption. J Am Ceram Soc 4:916–922
3. Washburn EW, Footitt FF (1921) Porosity: III. Water as an absorption liquid. J Am Ceram Soc 4:527–537
4. Washburn EW, Bunting EN (1922) Porosity: V. Recom-mended procedures for determining porosity by methods of absorption. J Am Ceram Soc 5:48–56
5. Ross KD, Butlin RN (1989) Durability tests for building stone, Building Research Establishment report 141. BRE, Watford
6. RILEM (1984) CPC 11.3 Absorption of water by immersion under vacuum. Mater Struct 17:391–394
7. Hall C, Hamilton A (2015) Porosity-density relations in stone and brick materials. Mater Struct 48:1265–1271 8. European Standard EN 1936: 2006 Natural stone test
methods—determination of real density and apparent den-sity, and of total and open porosity
9. European Standard EN 772–4: 1998 Methods of test for masonry units—part 4: determination of real and bulk density and of total and open porosity for natural stone masonry units
10. ASTM C97 (2009) Standard test methods for absorption and bulk specific gravity of dimension stone
11. Hall C, Hoff WD (2012) Water transport in brick, stone and concrete, 2nd edn. Taylor and Francis, London/New York 12. Robie RA, Bethke PM, Beardsley KM (1967) Selected
X-ray crystallographic data, molar volumes, and densities of minerals and related substances. Geological Survey Bulletin 1248, US Government Printing Office, Washington
13.http://projects.bre.co.uk/ConDiv/stonelist/stonelist.html
14. Roels S (2000) Modelling unsaturated moisture transport in heterogeneous limestone. PhD thesis, Catholic University of Leuven
15. Dubelaar CW, Engering S, Van Hees RPJ, Koch R, Lorenz H-G (2003) Lithofacies and petrophysical properties of Portland base bed and Portland whit bed limestone in rela-tion to durability. HERON 48:221–229
16. Cnudde V, Dierick M, Vlassenbroeck J, Masschaele B, Lehmann E, Jacobs P, Van Hoorebeke L (2007) Determi-nation of the impregDetermi-nation depth of siloxanes and ethyl-silicates in porous material by neutron radiography. J Cult Herit 8:331–338
17. Vanorio T, Mavko G (2011) Laboratory measurements of the acoustic and transport properties of carbonate rocks and their link with the amount of microcrystalline matrix. Geophysics 76:E105–E115
18. Derluyn H (2012) Salt transport and crystallization in por-ous limestone: neutron-X-ray imaging and poromechanical modeling. PhD thesis, ETH Zurich
19. De Kock T, Dewanckele J, Boone M, De Schutter G, Jacobs P, Cnudde V (2014) Replacement stones for Lede stone in
Belgian historical monuments. In: Cassar J, Winter MG, Marker BR, Entwistle NRG, Bromhead EN, Smith JWN (eds) Stone in historical buildings: characterization and performance. Geological Society, London, pp 31–46 (Spe-cial Publication)
20. Va´zquez P, Alonso FJ, Carrizo L, Molina E, Cultrone G, Blanco M, Zamora I (2013) Evaluation of the petrophysical properties of sedimentary building stones in order to establish quality criteria. Constr Build Mater 41:868–878 21. Bednarik M, Moshammer B, Heinrich M, Holzer R, Laho
M, Rabeder J, Uhlir C, Unterwurzacher M (2014) Engi-neering geological properties of Leitha Limestone from historical quarries in Burgenland and Styria, Austria. Eng Geol 176:66–78
22. Smith MR (ed) (1999) Stone: building stone, rock fill and armour stone in construction. Geological Society, London, Engineering Geology Special Publications no 16, Appendix C
23. Mosch S, Siegesmund S (2007) Statistisches Verhalten petrophysikalischer und technischer Eigenschaften von Naturwerkstein. Zeitschrift der Deutschen Gesellschaft fu¨r Geowissenschaften 158:821–868
24. Mosch S (2008) Optimierung der Exploration, Material-charakterisierung von Naturwerkstein. PhD thesis, Go¨ttingen
25. Hughes T, Lott GK, Poultney MJ, Cooper BJ (2013) Port-land stone: a nomination for ‘‘Global Heritage Stone Resource’’ from the United Kingdom. Episodes 36:221–226 26. Cole DI (1971) Ultrasonic velocity measurements on limestones from the Portland group: correlation with porosity and other lithological factors. PhD thesis, Univer-sity of Southampton
27. Palmer TJ (2005) Limestone petrography and durability in English Jurassic freestones. In: Doyle P (ed) England’s heritage in stone. English Stone Forum, Folkestone, pp 66– 78
28. Allison RJ (1987) Non-destructive determination of Young’s modulus and its relationship with compressive strength, porosity and density. In: Jones ME, Preston RMF (eds) Deformation of sediments and sedimentary rocks. Geological Society, London, pp 63–69 (Special Publication) 29. Carter ME, Matthews AP (1977) The measurement of porosity of irregular vugular rock samples using a modified liquid saturation technique. Ge´otechnique 27:435–438 30. Ingham JP (2005) Predicting the frost resistance of building
stone. Q J Eng Geol Hydrogeol 38:387–399 31. Stone Firms Ltd, technical datasheets
32. Dubelaar CW, Dusar M, Dreesen R, Felder WM, Nijland TG (2006) Maastricht limestone: a regionally significant building stone in Belgium and The Netherlands. In: Fort R, Alvarez de Buergo M, Gomez-Heras M, Vazquez-Calvo C (eds) Heritage, weathering and conservation. Taylor & Francis, London, pp 9–14
33. Van Hees RPJ, Nijland TG (2009) Assessment of the state of conservation of a Middle Neolithic flint mine in Maastricht limestone. HERON 54:227–250
preservation of the past. Geological Society, London, pp 203–208 (Special Publication)
35. Robert R. (2004) Analytical characterization of porous geomaterials: reference assessment in some sedimentary rocks. PhD thesis, Humboldt University, Berlin

![Table 1 Mineral densities [7, 12]](https://thumb-us.123doks.com/thumbv2/123dok_us/1528090.105394/4.547.47.262.514.665/table-mineral-densities.webp)
![Fig. 4 LeftSolid density Porosity f versus bulk density qb for 23 Britishlimestones [22]](https://thumb-us.123doks.com/thumbv2/123dok_us/1528090.105394/6.547.48.261.460.623/fig-leftsolid-density-porosity-versus-bulk-density-britishlimestones.webp)