City, University of London Institutional Repository
Citation
:
Van Goethem, A., Meulemans, W., Speckmann, B. and Wood, J. (2014).
Exploring curved schematization. IEEE Pacific Visualization Symposium, pp. 1-8. doi:
10.1109/PacificVis.2014.11
This is the accepted version of the paper.
This version of the publication may differ from the final published
version.
Permanent repository link: http://openaccess.city.ac.uk/id/eprint/8221/
Link to published version
:
http://dx.doi.org/10.1109/PacificVis.2014.11
Copyright and reuse:
City Research Online aims to make research
outputs of City, University of London available to a wider audience.
Copyright and Moral Rights remain with the author(s) and/or copyright
holders. URLs from City Research Online may be freely distributed and
linked to.
City Research Online:
http://openaccess.city.ac.uk/
[email protected]
Exploring Curved Schematization
Arthur van Goethem∗
TU Eindhoven
Wouter Meulemans∗
TU Eindhoven
Bettina Speckmann∗
TU Eindhoven
Jo Wood†
City University London
ABSTRACT
Hand-drawn schematized maps traditionally make extensive use of curves. Nevertheless, there are few automated approaches for curved schematization, most previous work focusses on straight lines. We present a new algorithm for the area-preserving curved schematization of geographic outlines. Our algorithm converts a simple polygon into a schematic crossing-free representation using circular arcs. We use two basic operations to iteratively replace consecutive arcs until the desired complexity is reached. Our re-sults are not restricted to arcs ending at input vertices. The method can be steered towards different degrees of “curviness”: we can encourage or discourage the use of arcs with a large central angle via a single parameter. Our method creates visually pleasing results even for very low output complexities. We conducted an online user study investigating the effectiveness of the curved schematizations compared to straight-line schematizations of equivalent complexity. While the visual complexity of the curved shapes was judged higher than those using straight lines, users generally preferred curved schematizations. We observed that curves significantly improved the ability of users to match schematized shapes of moderate com-plexity to their unschematized equivalents.
Index Terms: H.4 [Information Systems Applications]:
Geo-graphic Information Systems; I.3.5 [Computer Graphics]: Compu-tational Geometry and Object Modeling
1 INTRODUCTION
Maps are one of the most efficient ways to communicate location-based information. They help people to make decisions in naviga-tion, spatial planning, or risk and disaster management. Maps also communicate geopolitical information, they give a spatial dimen-sion to rhetoric arguments, and generally aid the process of public opinion and consensus building. Effective maps immediately con-vey their message and hence are as simple as possible. Schematiza-tioncreates a simplified and compact representation of the original data and reduces the visual complexity of maps. Linear features, such as roads and rivers, and the boundaries of regions are often drawn using only a few straight line segments in few different di-rections, or they are approximated by a few simple curves. Schema-tization attempts to direct the user’s attention away from the exact shapes of geographic entities, focussing the attention on the relation between those entities instead. Alternatively, its purpose can also be to produce a striking and memorable design for maximum im-pact. Furthermore, schematized maps are often used asbase maps of thematic maps, to avoid the “illusion of accuracy” created by fully featured topographic base maps [14, 17].
Schematization can be considered as a specific form of carto-graphic simplification. However, simplification generally aims to maintain high geographic accuracy, whereas schematization prior-itizes the simplicity of a map. To create schematized maps geo-graphic outlines are typically captured by a set of simple
mathe-∗e-mail: [a.i.v.goethem|w.meulemans|b.speckmann]@tue.nl
†e-mail: [email protected]
matical shapes. Hand-drawn schematized maps traditionally make extensive use of curves. Curves can capture more complex shapes enabling them to represent information on a more abstract level. Curves also make it easier to interpret maps (see [23] for a recent study). Despite the conceptual advantages of curves, automated schematization has mostly focussed on straight lines.
Contributions.We present a quadratic-time algorithm for
schema-tization with circular arcs. Our algorithm allows new vertices to be introduced and as such is anon-vertex-restrictedmethod (see Sec-tion 2). Furthermore, it preserves the exact size of each region of the input and maintains topology. We iteratively replace consecutive arcs until the desired complexity is reached. This replacement is based on two operations. The first is vertex-restricted and replaces two consecutive arcs by a single arc connecting the endpoints. The second operation is non-vertex-restricted and replaces three con-secutive arcs by two concon-secutive arcs. This operation may place the vertex joining the two new arcs at a new location. Our algorithm can select operations according to different schemes. We use this to obtain results of varying degree of “curviness”—preferring arcs with a large or small central angle. Our method creates visually pleasing results even for very low output complexities and com-bines well with different rendering styles. Lastly, our algorithm can also deal with subdivisions (e.g. multiple countries).
We conducted a user study investigating the effectiveness of curved schematizations compared to straight-line schematizations of equivalent complexity. While the visual complexity of the curved shapes was judged higher than those using straight lines, users gen-erally preferred curved schematizations. Curves also significantly improved the ability of users to match schematized shapes of mod-erate complexity to their unschematized equivalents.
Organization. We first review related work and then introduce
some necessary terminology in Section 2. In Section 3 we describe our algorithm, showcase results, and discuss various extensions. We discuss the user study in Section 4 and close in Section 5 with a discussion of our work.
Related work. Simplification of shapes has received significant
attention (e.g. [2, 19, 28]). In contrast to simplification, schemati-zation is less focussed on geographic accuracy and more on visual presentation. Network schematization (e.g. metro maps) has been studied extensively (e.g. [8, 15, 18]). These algorithms are often not concerned with maintaining shape and most deal with straight-line representations only. An exception is the method of Finket al.[8], a force-directed method for drawing networks with B´ezier curves.
auto-mated schematization methods deal exclusively with straight lines, the use of curves is almost a given in manual cartography. Exam-ples include chorematic diagrams [20] and transit maps [22].
Smooth circular arcs have been used to represent inherently smooth polygons [12]. It is unclear whether such solutions are use-ful for schematization: in this context it is generally not desirable to assume that the original shape is relatively smooth. A non-smooth approach is given by Drysdaleet al.[6]. This method imposes re-strictions on “gates” which hinder a high complexity reduction. In the field of graph drawing, the use of curves has also received sig-nificant attention, e.g. [7, 9]. However, these papers typically do not preserve any measure of shape. K¨amperet al.[13] present a method for distorting a schematization into a circular-arc cartogram, but recognizability is not a primary concern; aesthetics and legibility remain untested. For computer-aided design, Burchardet al.[25] discuss fitting a curve given aesthetic requirements.
A wealth of research exists on perception, rendering, and their combination. For example, Bar and Neta [1] argue that curved ob-jects are preferred by observers since sharp bends are identified with threat. This supports the need for curved schematizations, though some sharp bends may be necessary. Vessel and Rubin [27] investi-gate the objectiveness of taste. They conclude that for natural, real-world images, people typically agree on aesthetics; however, on abstract images, individual taste plays a large role. While schema-tizations are typically rather abstract depictions, they stem from a reality and should up to some degree also correspond to this real-ity. Hence, we think that there is some consensus possible on what qualifies as a good schematization. Vande Moereet al.[26] evaluate the effect of visual style in the context of information visualization.
2 PRELIMINARIES
Algorithmic properties. Simplification and schematization
al-gorithms can be classified as vertex-restricted or non-vertex-restricted. For the former, each output vertex must also be an input vertex. For the latter, output vertices may be placed freely. Our algorithm is a non-vertex-restricted method.
A result istopologically correct if it has no intersections and each region maintains the same adjacencies. This property is crucial to shape schematization: incorrect topology greatly interferes with legibility and recognizability of a map.
When schematizing shapes we often prefer not to greatly dis-tort their sizes. Relative sizes, and in some cases absolute sizes, may influence the information portrayed in a map. We enforce area preservation as a strict way of maintaining relative sizes: each re-gion in the input has the exact same area in the output. A result is area equivalentto the input; the algorithm isarea preserving.
Circular arcs.A(circular) arcis a connected part of a circle. An
arc is given by its centerc, startpointsand endpointe, and its orien-tation (clockwise or counterclockwise). Thecentral angleαis the angle from segmentcstoce, either the clockwise or counterclock-wise angle depending on the orientation. Thecircular segmentis the region enclosed by the arc and line segmentse.
Signed area.We usesigned areato reason about area preservation.
Assume we are given an open curveC, starting atuand ending atv; in addition, assume there is a curveC0fromvtousuch that the con-catenation ofCandC0, as well as the concatenation of line segment uvandC0are non-selfintersecting counterclockwise closed curves. LetA(C)andA(uv)respectively denote the area enclosed by these closed curves. The signed area ofCis thenA(C)−A(uv), that is, it is the area it adds compared to its straight-line replacement. Note that any validC0results in the same signed area.
For a circular arc, the signed area is simply the size of its circular segment, computed as 12·r2·(α−sinα)for radiusrand central angleα. The signed area is positive for counterclockwise arcs and negative for clockwise arcs. Two points and a signed area uniquely determine a circular arc (Property 1).
Property 1. Given two points u and v and a (bounded) value A,
there is a unique arc from u to v with signed area A.
For a sequence of (at most 3) arcs, we sum the signed area of each arc and the signed area of the polyline formed by the vertices of the arcs. To this end, consider a polylineP=hu1, . . . ,ukiwith
k≤4. Ask≤4, there must exist a valid curveC0to define the signed area. It is computed as12(uk×u1+∑ik=−11ui×ui+1)where× denotes the 2-dimensional cross product.
3 SCHEMATIZATION ALGORITHM
We give an algorithm that schematizes a simple polygon using cir-cular arcs. The algorithm maintains a closed curveS=ha1, . . . ,ani
consisting of circular arcsai. ThecomplexityofSis its number of
arcs|S|=n. Every consecutive pair of arcs, sayai−1andai, meet
at a vertexvi. We consider an arcaito be oriented fromvitovi+1. We treat the sequence circularly, e.g. an+1=a1 andvn+1=v1. Line segments are considered to be arcs with an infinite radius. The input—a simple polygon—is therefore also a closed curve.
Our algorithm first generates a schematization by greatly reduc-ing the input complexity and usreduc-ing arcs for its representation. For this process, we design two operations that decrease the complex-ity of a shape (Section 3.1). An operation replaces a sequence of the arcs by a shorter sequence. As such, it can make only local modifications. By iteratively applying these operations we obtain a schematization (Section 3.2). In Section 3.3 we discuss some re-sults obtained with our algorithm. We describe two optional post-processing steps in Section 3.4.
3.1 Area-preserving operations
Here we describe the operations that are used by our algorithm. Each operation is executed on a low number of consecutive arcs. An operation does not modify the shape other than giving a replace-ment for the arcs it operates on. In particular, the vertices at which the sequence starts and ends must remain in their original position. We wish to ensure that the area encompassed by curveSremains the same. To this end, we enforce that a single operation is area pre-serving: the signed area of a replaced arc sequence must be equal to the signed area of the replacement. By extension, this means that any sequence of operations preserves the area as well.
The operations change the curvature of arcs, which is a desir-able property. Particularly, it implies that they can be used to turn straight-line shapes into curved shapes. No preprocessing is re-quired to ensure that non-degenerate arcs emerge.
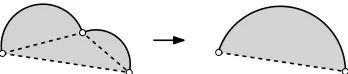
Vertex-restricted. The vertex-restricted operation replaces two
[image:3.612.351.525.548.585.2]consecutive arcs by a single arc. By measuring the signed area of this sequence, we obtain a desired signed area for the result (see Fig. 1). This uniquely determines the replacement arc (Property 1).
Figure 1: The vertex-restricted operation replaces two arcs by their unique area-equivalent arc.
Non-vertex-restricted. The non-vertex-restricted operation takes
∆1
(a)
∆2
(b)
p
∆2
∆1+∆2
(c) ai−1
ai
ai+1
Figure 2: (a-b) Symmetric difference∆1and∆2of the area-equivalent arc replacingai−1andai, andaiandai+1, respectively. (c) Pointpis located at fraction ∆2
∆1+∆2along the perimeter ofai.
infeasible and we instead apply the following heuristic. We define a lineLthrough the center ofaiand a pointponai. (Ifaiis a line
segment,Lis the perpendicular atp.). Vertexv0is placed onL. To defineL, we describe how to obtain pointp. We would like the point to be closer toai+1ifai−1andaiare alike. Similarly, it
should be closer toai−1ifaiandai+1are alike. To this end, we use thesymmetric differencethat measures similarity between shapes as the total area that is covered by one but not both of the shapes. We measure the symmetric difference∆1caused by replacingai−1 andaiby their (uniquely defined) area-equivalent arc. Similarly,
we obtain the symmetric difference∆2caused by replacingaiand
ai+1by their area-equivalent arc. We now use forpthe point that is a fraction of ∆2
∆1+∆2along the perimeter ofaias measured fromvi
(see Fig. 2). In particular, if∆1is zero, thenpisvi+1; if∆2is zero, thenpisvi. If both∆1and∆2are zero, we use a fraction of12.
Point palso defines the signed area ofa0anda00(see Fig. 3). The signed area fora0is the signed area betweenvi−1andv0caused byai−1,aiup to pointp, and the segment fromptov0. Similarly,
the signed area for arca00is defined by segmentpv0,aifromp, and
ai+1. This uniquely defines a solution for any pointv0(Property 1).
p
ai−1
ai+1 v0
a0
a00
[image:4.612.332.548.53.109.2]L ai
Figure 3: Solutionv0 lies on lineLthroughpSigned area fora0is given in gray. Non-optimal solution is used for illustration.
Forv0, we use the point onLthat minimizes the symmetric dif-ference for the resulting arcs. To this end, we assume that the sym-metric difference is unimodal onL(i.e. it has a unique minimum) and perform a golden search—a “binary search” for unimodal func-tions. However, this solution may contain intersections (i.e. it is not planar). We reject a non-planar solution if bothvi−1 andvi+2 on the same side ofL: it is unclear how to obtain a planar solution. However, ifvi−1andvi+2are on opposite sides of solution lineL, we can always move towards a planar solution.
Lemma 1. Assume vi−1and vi+2 lie on different sides of line L.
Then there exists a planar solution with v0on L.
Proof. As the problem is invariant under rotation and translation, we assume that both vi−1 and vi+2 lie on the x-axis (have y -coordinate zero), and we assume thatvi−1is left ofvi+2. Sincevi−1 andvi+2lie on different sides, solution lineLcannot be horizontal. Moving pointv0downward along lineLcauses the signed area of both arcs to decrease. Symmetrically, movingv0upward causes an
L
vi−1 vi+2
l1
l2
v0=l2
v0
l1
vi−1 vi+2 L
a0
a00
[image:4.612.60.292.53.145.2]a0 a00
Figure 4: A planar solution exists ifvi−1andvi+2lie on different sides ofL. Arcsa0anda00are a straight line atl1andl2respectively.
increase in signed area. Hence, in particular, there is a unique point l1onLwhere the first arc has signed area zero (and thus is a straight line). Analogously, there is a unique pointl2onLwhere the second arc has signed area zero. A solution higher thanl1onLcauses a positive signed area for the first arc (and thus a counterclockwise arc), any solution below causes a negative signed area (and thus a clockwise arc). Without loss of generality, we assume thatl1is higher thanl2. We consider two cases based onl1andl2.
Assume that l1 and l2 lie on different sides of the x-axis (Fig. 4 (left)). Consider the solution withv0 on thex-axis. Asl1 lies abovev0, the first arc is clockwise for this solution; similarly, the second arc is counterclockwise. Thus, they lie in the different half-planes of thex-axis and this solution cannot intersect itself.
For the second case, we assume thatl1 andl2 lie on the same side of thex-axis (see Fig. 4 (right)). Without loss of generality, we assume that they lie above. Consider the solution atl2. Here the second arc is a straight line and the first arc is a clockwise arc. As l2lies above thex-axis, the first and the second arc lie in different half-planes defined by linevi−1l2and cannot intersect.
As proven, we can determine one or more positions onLthat give planar solutions. If solutionv0is not planar, we select the position son lineLwith minimum distance|sv0|. We assume that there are at most two intervals onLwhich contain planar solutions. Ifsis in an interval adjacent to the optimal solutionv0, we use binary search to obtain the planar solution with the least symmetric difference in the interval[v0,s]. If this is not the case, we apply a binary search to obtain a better planar solution. However, this solution is not guaranteed to be the optimal planar solution in this interval. In our experiments, this occurred only in rather contrived cases.
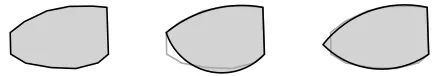
Fig. 5 illustrates the benefit of a non-vertex-restricted move: the middle and right result are generated respectively without and with the non-vertex-restricted operation.
Figure 5: A non-vertex-restricted solution (right) may more accurately reflect shape compared to vertex-restricted solutions (middle).
3.2 Iterative schematization
Here we describe an algorithm to perform the operations of the pre-vious section to reduce the complexity of a shape.
Initialization.The algorithm initializes by computing the result for
[image:4.612.109.242.434.491.2] [image:4.612.328.547.498.536.2]Algorithm 1Schematize(S,k)
Require: Sis a simple polygon
Ensure: Shas at mostkarcs orSadmits no operation
1: Initialize operations and their blocking numbers
2: while|S|>kandSadmits an operationdo
3: Find best admissible operationo
4: Discard operations involving any arcs part ofo 5: Decrease blocking numbers of other operations 6: Execute operationo
7: Increase blocking number of other operations 8: Create operations involving newly created arcs
Iteration. Each operation is scored based on the symmetric
dif-ference between the resulting arcs and the section of the original shape that it represents. Hence, we maintain for each arc in the current shape, the part in the original it represents. Initially, each line segment represents itself. When performing a vertex-restricted move, the new arc represents the union of the parts represented by the replaced arcs. When performing a non-vertex-restricted move, each new arc represents a fraction of the union of the parts that the old arcs represented. This fraction is based on the perimeter length of the new arcs. This does not necessarily give some optimal matching of arcs to the original shape.
The algorithm iteratively selects the admissible operationowith the lowest score. Before the operation is executed, other operations must be updated. If an operation involves an arc that is also in-volved ino, it is discarded. Otherwise, the blocking number of the operation is decreased by the number of arcs ofothat overlap its region. Operationois now executed, creating new arcs. We update the blocking numbers again, but now increase the values where re-quired. Finally, we construct new operations involving at least one of the newly created arcs and initialize their blocking numbers. The algorithm proceeds until either no operation is possible or a target complexity has been reached. Pseudocode is given by Algorithm 1. At most 5 arcs need to be checked for updating the blocking numbers. Moreover, only a constant number of operations is con-structed in each step, taking linear time per operation. Hence, the algorithm runs inO(|S|2)time.
Ideally we would prove that any planar shape has at least one ad-missible operation. Unfortunately, this is not the case. In theory our algorithm could terminate at an undesirably high complexity. How-ever, we did not observe this in practice with territorial outlines: they are typically quite sparse with well-separated boundaries.
Weighting. Since our algorithm selects operations based only on
their score, we can reweight operations to introduce a preference. We propose the weightαc, whereαdenotes the average central
an-gle of the new arcs created by an operation andcis a parameter. We multiply the score given above by this weight. The weight gives a preference based on central angles and yields a more curvy result (large central angles) or less curvy result (small central angles). By varying parameterc, we can aim for a certain style of schematiza-tion. For positivec, results with small central angles are prefered over results with large central angles. This results in aflat schema-tization style: arcs are relatively straight and have low curvature. Negativecobtains the exact opposite, resulting in acurvystyle with arcs that are far from straight. Forc=0, the weight is always one and no change occurs, no preference is given and the result could be either style or even a mix. We refer to this asregular schematiza-tion. This weighting scheme only steers the selection of operations and does not give a guarantee on the resulting shape. In particular, it does not behave monotonously inc: for example,c=2 does not necessarily yield a result that is less curvy thanc=1. However, in our experiments, we found that the preferred style clearly emerges when using acof either -1, 0, or 1; we use only these values.
Alternative termination.The algorithm stops when the shape has
complexitykor less (or no admissible operation exists). However, it may also be desirable to stop based on some measure of shape similarity instead. For each operation, we compute theFr´echet dis-tance(a similarity measure) of its result to its original part [24]. If this is larger than a given threshold, we disallow the operation.
Subdivisions. We described our algorithm for simple polygons.
However, it can also easily be applied to subdivisions (e.g. multiple countries): we allow only operations that (re)move vertices of de-gree two. Other vertices are fixed. An operation may still use such vertices as its endpoints. An example is given Fig. 11.
[image:5.612.106.507.558.692.2]3.3 Results
Fig. 6 illustrates results obtained on the outlines of China and Aus-tralia. For both outlines we have generated flat schematizations (c=1) and curvy schematizations (c=−1). The smoothing step presented in Section 3.4 was applied to the results shown. For the interested reader, more results have been made available online at
http://www.win.tue.nl/˜wmeulema/results.html.
3.4 Postprocessing
Smoothing. In our method we fit an arc without considering its
neighbors. This may cause very small or large angles between neighboring arcs. Small angles create shallow dents in the outline, causing an increase in complexity without adding to the shape. Very sharp angles can negatively affect perception of the schematization [1]. To avoid small angles, we use the following postprocessing.
We inspect each vertexv of the result and check whether the angle between tangents is less than a threshold (we use 20 degrees).
v
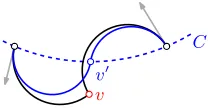
[image:6.612.344.534.52.169.2]C v0
Figure 7: Vertexvis to be smoothed (bend exaggerated). CircleC
[image:6.612.124.228.53.107.2]contains exactly the positions where the arcs meet smoothly.
Figure 8: Regular 13-arc schematization of France. Smoothing a nearly smooth bend may reduce visual complexity without compro-mising on shape. Tangents are indicated.
If this is the case, we move the vertex to a new position,v0, such that the bend becomes smooth. This should not change the tangents at the other endpoints of the involved arcs as it could cause a different bend to lose its smoothness. The solution space forv0is in fact a circleC[7]. We choose forv0 the nearest point onC; this fully determines the incident arcs (see Fig. 7).
This smoothing method is not area-preserving; such a solution need not exist given that tangents are maintained. Our proposed method does not heavily distort the area; this distortion may be ac-ceptable depending on the application. Fig. 8 illustrates the benefit of smoothing; the area distortion is less than 0.4%.
Rendering. Obtaining a schematization is only a first step in
de-veloping a map or visualization. The presentation of the resulting map also plays a crucial role. We present some results obtained by combining our schematizations with different rendering styles.
In Fig. 9 we combine the sketchy rendering by Woodet al.[29] with a flat 12-arc schematization of France. We believe the flat schematization style matches well with the hand-drawn style pro-vided by the renderer. A manual sketch would prevent using arcs with a large central angle as these are generally harder to draw. The implied imprecision of the sketch reinforces the geographic inaccu-racy of the schematization. In Fig. 10 we rendered a regular 12-arc schematization of Vietnam with a variable stroke thickness. This also yields a hand-drawn appearance. However, in contrast to the sketchy style, this style feels more controlled and thus more curvi-ness can be allowed. Inspired by Christopheet al.[4], we apply a pop-art rendering style to a curvy schematization of Italy (see Fig. 11). The high curviness of the drawing is unusual, but this matches the rather unusual coloring typically seen in pop art.
Figure 9: Sketchy rendering of a flat 12-arc France using the Handy library [29].
Figure 10: Stroked rendering of a regular 12-arc Vietnam.
Much of the pop-art movement (e.g. Lichtenstein) focussed on mimicking the automated, often cheap and crude, printing process with carefully crafted hand drawn paintings. The “unusual” col-ors used can be seen as a reflection of the simple, bold, three color printing processes. One could argue that the highly curved edges of the Italy example are reflecting and exaggerating that bold sim-plicity. In almost complete contrast, the sketchy work (and all non-photorealistic rendering) is mimicking hand-crafted drawing with an automated process. Here we are deliberately avoiding the bold exaggerated curves to emphasize that process.
These preliminary results look promising, but a more thorough study of the relation between rendering and schematization styles is necessary. This need not be limited to only curved schematization, but could also include the more traditional straight schematization.
Italy
Italy
Naples Milan
Turin
Genoa
Bari Venice
Rome Bologna
Florence
Naples Milan
Turin
Genoa
Bari Venice
Rome Bologna
[image:6.612.64.286.148.239.2]Florence
Figure 11: Pop-art rendering of a curvy Italy.
4 USER STUDY
To assess both the appeal and the utility of curved schematization we constructed a user study to evaluate three hypotheses.
1. People prefer the visual appeal of curved schematizations of shapes over their straight-line equivalents.
2. Curved schematization improves the recognizability of shapes for any given degree of simplification.
3. Curved schematization creates shapes that are judged to be simpler than their straight-line equivalents.
[image:6.612.364.514.364.516.2] [image:6.612.65.281.613.691.2]4.1 Generating schematizations
In our user study, we compared four styles of schematization.
Straight-line images.To minimize influences due to the type of
al-gorithm used, we chose to use the same alal-gorithm for straight-line schematizations as we did for the curved schematizations. With straight lines, it is not possible to construct an area-preserving op-eration that replaces two straight lines by one. That is, there is no direct equivalent with straight lines to our vertex-restricted opera-tion with arcs. The non-vertex-restricted operaopera-tion, however, does admit a straight-line variant with a uniquely defined optimal solu-tion. The solution space for the connecting vertexv0is a line par-allel to the line throughvi−1andvi+2. We determine the optimal position on this line using a golden search. Initial end positions for the search are determined using a binary search. We did not apply the smoothing step for straight-line results as “smoothing” a vertex would be equivalent to removing it.
Curved images.We generated curved schematizations with our
al-gorithm in the three styles: curvy (c=−1), flat (c=1), and regular (c=0). To all results, we applied the smoothing step.
4.2 Experimental protocol
We constructed trials using a range of shapes based on country out-lines with varying degrees of schematization and curviness param-eterizations. We recruited unpaid volunteers to take part in an unsu-pervised online survey, largely through social networks and email lists. The estimated completion time was about 15 minutes per per-son. We used a mixed-design varying shape and schematization style in three tasks. Before the main evaluation tasks, we asked for basic demographic and background information: age, gender, back-ground (“visual art/design”, “geography/cartography”, “computer science/IT” and “other”) and experience with geographic maps, schematized maps, and schematized representations. This allowed us to define the term “schematized” before it was used in subse-quent tasks. While there might be a risk of introducing some bias by asking these questions first, we considered the benefit in clarify-ing the terms used in the tasks as outweighclarify-ing this potential cost.
Task 1 involved selecting one of two presented shapes as the one they found more aesthetically appealing. Specifically users were asked to “Click on the image that you consider aesthetically more appealing. Do not overthink your answers and try to decide within a few seconds.” Each user was given 20 comparisons to make. The images were generated from 6 different country outlines in four different styles and two complexity levels (a 6- or 7-arc schemati-zation and a 11- or 12-arc schematischemati-zation). This yielded 48 basic images in total. The pair of images being compared were of the same country outline, but with varying combinations of schemati-zation styles. Thus, there were 288 different pairwise comparisons from which the sample of 20 was drawn without replacement (144 distinct pairs with randomized position).
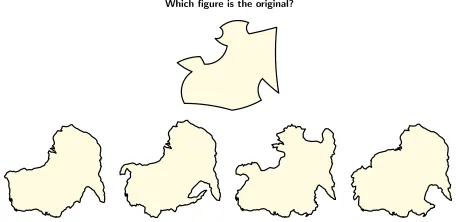
Task 2 involved matching a schematized shape with one of four unschematized possible originals. Specifically users were told “In this section, we show you a single schematic image. Below this image are four shapes. The schematic image represents one of these four shapes. Click on the shape that is represented by the schematic.” The four alternatives were displayed in a random order and represented different, but equivalently complex originals. They were constructed to resemble typical but fictitious country outlines (see Fig. 12). We had 6 sets of original outlines, each set consist-ing of four similar but different variants. For these 24 outlines, we generated 5-arc, 10-arc, and 15-arc schematizations in each of the four styles. The schematized stimulus outline was drawn from a random selection without replacement of 288 possibilities (6 “coun-tries”, 4 variants per “country”, 4 styles and 3 complexity levels) but were selected to ensure even distribution over the complexity lev-els. Each user was given 18 questions for Task 2. This task counter-balances for oversimplification (e.g. representing everything with a
[image:7.612.324.552.54.165.2]Which figure is the original?
Figure 12: Example from the online schematized shape matching task. Each user was presented with 18 such tasks where they must match the schematized shape to one of four possible alternatives.
perfect circle). We chose a high number of outlines to avoid biasing the outlines to a particular style.
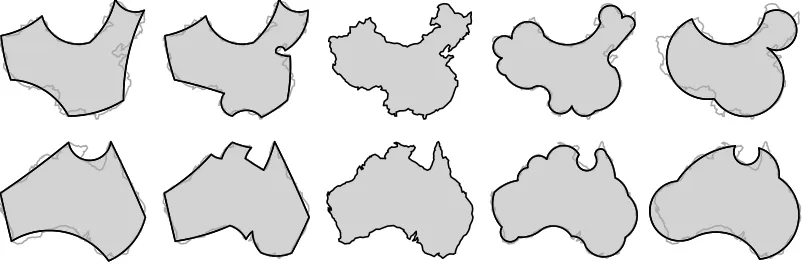
Task 3 involved identifying which of two possible alternative shapes they regarded as the “simpler”. Specifically users were asked to “Click on the image that you consider “simpler”. Do not overthink your answers or count elements. Give your intuitive an-swer and try to decide within a few seconds.” Random shapes were drawn from a pool of 72 (6 countries, 4 schematization styles, 3 levels of Fr´echet distance). The thresholds on the Fr´echet distance were 0.015, 0.03 and 0.06 times the diameter of the input, yield-ing “high”, “medium” and “low” levels of similarity (to the input) respectively. The same level of similarity and same basic country outline were used in any given pairwise comparison leading to a possible pool of 216 question combinations (108 distinct pairs with randomized position). Each user was given 20 comparisons that were selected without replacement. Fig. 13 illustrates the various styles and levels of similarity. We chose to use a consistent level of similarity instead of complexity. A single arc may be consid-ered more complex than a single line segment; however, arcs have a higher expressive power. Using a consistent complexity risks bias-ing judgements towards straight-line schematizations, though these sacrifice similarity (recognizability) to achieve this simplicity.
Figure 13: Sample of shapes (China outline) provided in user test. Columns show curvy, regular, flat, and straight schematization. Rows show low, medium and high level of similarity.
4.3 Results
[image:7.612.328.548.456.584.2]0 25 50 75 100 125
Age of respondents
Number of respondents
< 18 18 - 25 26 - 40 41 - 67 > 67 0 50 100 150
Art
Geog/cartography Computer Science Other Background experience
Number of responses
Female Male
0 50 100
Never Yearly Monthly Weekly Daily Experience using maps
Number of respondents
0 25 50 75
Never Yearly Monthly Weekly Daily Experience using schematized representations
[image:8.612.59.291.51.290.2]Number of respondents
Figure 14: Profiles of the 303 respondents who completed all tasks.
background as well as age and background (e.g. the majority of male participants are computer scientist). The group of 68 years and older had only 3 participants and was excluded from analysis.
To investigate hypothesis 1, we used loglinear Bradley-Terry (LLBT) modeling [11] of the 6060 pairwise aesthetic preference comparisons to produce ranked “worth” scores for each of the four schematization styles. The worth score allows the consistency of preference to be assessed in forming an overall ranking of the four classes. Fig. 15 shows the ranking of the four styles in terms of aesthetic preference, broken down by both gender and age. Con-sistently, the straight schematization was regarded as the least aes-thetically attractive. There was a significant influence of gender on the most preferred style with women preferring the curvy style over other curved styles and men preferring the slightly less exagger-ated regular and flat styles. This difference may in part also reflect the differing backgrounds of men and women in the study, but we conclude from this work that while there is strong evidence for a preference of curves over straight lines, there appears to be no uni-versal agreement over which style of curviness is preferred.
In contrast, there was much stronger agreement among respon-dents as to what style of schematization appears to be the “sim-plest”. All age groups regarded the (strongly curved) curvy schema-tization as being the least simple and the straight-line representation
w or th 0.18 0.20 0.22 0.24 0.26 0.28 0.30 Male Female w or th 0.20 0.25 0.30 0.35
< 18 18 25 26 40 41 67 Straight Straight Straight Straight Regular Regular Regular Regular Curvy Curvy Curvy Curvy Flat Flat Flat Flat Flat Regular Curvy Straight Straight Flat Regular Curvy
Figure 15: Style preference by gender and age.
w or th 0.15 0.20 0.25 0.30 0.35
< 18 18 25 26 40 41 67
Flat Straight Straight Straight Straight Flat Flat Flat Regular Regular Regular Regular
[image:8.612.366.514.51.167.2]Curvy Curvy Curvy Curvy
Figure 16: Simplicity judgement by age.
to be among the simplest (see Fig. 16). This suggests we can reject hypothesis 3 that curved schematization would be judged to ap-pear simpler than its straight-line equivalents. Future work might explore whether self-reported judgements of simplicity match the cognitive load required in interpreting such shapes.
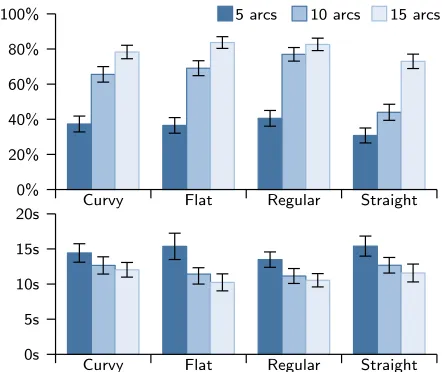
We analyzed the success of respondents in matching schema-tized to non-schemaschema-tized shapes (Task 2) to investigate the second hypothesis on recognizability. Answers with response time over 4 minutes were excluded. Fig. 17 shows accuracy and response time as the complexity and schematization style was varied. Chi-squared tests were applied to the schematization type, complexity, as well as both in combination. As expected, as the complexity increases, the ability to correctly match shapes decreases and the time taken to make a matching judgement rises (Chi-squaredp<0.01). For very highly schematized shapes (5 arcs) as well as those with the least schematization (15 arcs), the ability to match successfully is some-what independent of style of schematization. This is largely ex-pected since the matching task is either too challenging or too easy under these conditions. For 10-arc schematizations though, there was a significant difference in matching ability between schema-tization types (Chi-squared p<0.01) with all curved styles im-proving the ability to match shapes over their straight-line equiv-alent. This suggests that at the right complexity, curved schema-tization may significantly improve the recognizability compared to straight-line simplifications. However, this must be balanced against the perception that straight-line shapes appear simpler than curved shapes (as demonstrated via Task 3).
Curvy Flat Regular Straight 100% 80% 60% 40% 20% 0%
Curvy Flat Regular Straight 20s
15s
10s
5s
0s
5 arcs 10 arcs 15 arcs
[image:8.612.328.549.495.681.2] [image:8.612.66.288.584.702.2]5 CONCLUSIONS
We presented an algorithm for automated curved schematization using circular arcs. Our algorithm preserves area and topology and is able to introduce new vertices. Using a single parameter we can steer the algorithm to obtain “flat”, “regular” or “curvy” results. The schematization style can be reinforced by choosing an appro-priate rendering style. We illustrated this by combining three ren-dering styles with our schematizations. The results are pleasing and seem to imply that there is indeed an interaction between rendering and schematization style.
To investigate what level of curviness is preferred in a schema-tization we conducted a user study. Users were asked to determine preference and visual complexity of schematizations of different territorial outlines and curviness. We also tested the recognizability depending on the curviness and the degree of schematization.
The results seem to indicate that the use of curves is preferred in schematizations. Schematizations consisting of straight line seg-ments were consistently deemed the least aesthetically pleasing. There was, however, no concluding proof that a specific type of curviness was deemed more pleasing. Although curved schema-tizations were preferred aesthetically, straight-line schemaschema-tizations were deemed visually less complex. There appears to be a trade-off between visual complexity and aesthetically pleasing results.
The use of curves has a significant effect on the recognizability of schematized shapes. While recognizability was neither helped nor hindered by the use of curves at low and high complexities, for the mid-level schematizations the use of curves increased recogniz-ability. We conjecture that within a certain range of schematization, curves are better at characterizing shape. This would imply that the use of curves is not only aesthetically pleasing, but increases the information carrying capacity of a schematization.
Future work.In this paper, we have explored the concept of curved
schematization design and compared it to straight-line schematiza-tions. It would also be interesting to investigate how our algorithm compares to other schematization algorithms, e.g. [3, 5, 10].
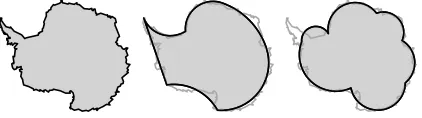
The quality of schematization may depend on the chosen style. Flat curved schematization works for most shapes, while the curvy style seems suitable only for some. For example, a curvy schema-tization of Antarctica (Fig. 18) does not capture its shape well. It is unclear how to determine which type of schematization is suitable for a given shape; we leave this to future work.
[image:9.612.70.281.554.613.2]Further research into the use of curves to represent shape is nec-essary, since so far most efforts have focused on straight-line rep-resentations. Our user study seems to imply that the use of curves might allow for a higher quality representation and as such pro-motes the use of curves in future research. However, not just circu-lar arcs, but also other types of curves (e.g. elliptical arcs, B´ezier curves) could prove interesting.
Figure 18: 6-arc Antarctica: regular (middle) and curvy style (right). Antarctica seems unsuitable for the curvy style.
REFERENCES
[1] M. Bar and M. Neta. Humans prefer curved visual objects. Psycho-logical science, 17(8):645–648, 2006.
[2] M. de Berg, M. van Kreveld, and S. Schirra. A new approach to subdi-vision simplification. InProc. 12th Int. Symp. on Computer-Assisted
Cartography, volume 4, pages 79–88, 1995.
[3] K. Buchin, W. Meulemans, and B. Speckmann. A new method for subdivision simplification with applications to urban-area generaliza-tion. InProc. 19th ACM SIGSPATIAL GIS, pages 261–270, 2011. [4] S. Christophe, C. Hoarau, A. Kasbarian, and A. Audusseau. A
frame-work for Pop Art maps design. InProc. GIScience 2012, 2012. [5] S. Cicerone and M. Cermignani. Fast and Simple Approach for
Poly-gon Schematization. InProc. 12th Int. Conf. on Comput. Science and Its Appl., LNCS 7333, pages 267–279, 2012.
[6] R. Drysdale, G. Rote, and A. Sturm. Approximation of an open polyg-onal curve with a minimum number of circular arcs and biarcs.CGTA, 41(1-2):31–47, 2008.
[7] C. Duncan, D. Eppstein, M. Goodrich, S. Kobourov, and M. L¨offler. Planar and Poly-arc Lombardi Drawings. InProc. 19th Graph Draw-ing, LNCS 7034, pages 308–319, 2012.
[8] M. Fink, H. Haverkort, M. N¨ollenburg, M. Roberts, J. Schuhmann, and A. Wolff. Drawing Metro Maps Using B´ezier Curves. InProc.
20th Graph Drawing, LNCS 7704, pages 463–474, 2013.
[9] B. Finkel and R. Tamassia. Curvilinear Graph Drawing Using the Force-Directed Method. InProc. 12th Graph Drawing, LNCS 3383, pages 448–453, 2004.
[10] A. van Goethem, W. Meulemans, A. Reimer, H. Haverkort, and B. Speckmann. Topologically Safe Curved Schematization.The Car-tographic J., 50(3):276–285, 2013.
[11] R. Hatzinger and R. Dittrich. prefmod: An R Package for Modeling Preferences Based on Paired Comparisons, Rankings, or Ratings. J. of Statistical Software, 48(10):31, 2011.
[12] M. Heimlich and M. Held. Biarc approximation, simplification and smoothing of polygonal curves by means of Voronoi-based tolerance bands.Int. J. of Comp. Geom. & Appl., 18(3):221–250, 2008. [13] J.-H. K¨amper, S. Kobourov, and M. N¨ollenburg. Circular-arc
car-tograms. InProc. 6th IEEE PacificVis, pages 1–8, 2013.
[14] A. MacEachren.How Maps Work: Representation, Visualization, and Design. Guilford Publishing, 1995.
[15] D. Merrick and J. Gudmundsson. Path simplification for metro map layout. InProc. 14th Graph Drawing, LNCS 4372, pages 258–269, 2006.
[16] X. Mi, D. DeCarlo, and M. Stone. Abstraction of 2D shapes in terms of parts. InProc. 7th Int. Symp. on Non-Photorealistic Animation and Rendering, pages 15–24, 2009.
[17] M. Monmonier.How to Lie with Maps. Univ. of Chicago Press, 1996. [18] M. N¨ollenburg and A. Wolff. A mixed-integer program for drawing high-quality metro maps. InProc. 13th Graph Drawing, LNCS 3843, pages 321–333, 2005.
[19] W. Park and K. Yu. Hybrid line simplification for cartographic gener-alization.Pattern Recognition Letters, 32(9):1267–1273, 2011. [20] A. Reimer. Understanding chorematic diagrams: towards a taxonomy.
The Cartographic J., 47(4):330–350, 2010.
[21] A. Reimer and W. Meulemans. Parallelity in chorematic territorial outlines. InProc. 14th W. on Gener. and Mult. Repr., 2011. [22] M. Roberts.Underground maps unravelled - Explorations in
informa-tion design. Self-published, 2012.
[23] M. Roberts, E. Newton, F. Lagattolla, S. Hughes, and M. Hasler. Ob-jective versus subOb-jective measures of paris metro map usability: In-vestigating traditional octolinear versus all-curves schematics. Int. J.
of Human-Computer Studies, 71(3):363–386, Mar. 2013.
[24] G. Rote. Computing the Fr´echet distance between piecewise smooth curves.CGTA, 37(3):162–174, 2007.
[25] N. Sapidis.Designing fair curves and surfaces: shape quality in
geo-metric modeling and computer-aided design. SIAM, 1987.
[26] A. Vande Moere, M. Tomitsch, C. Wimmer, B. Christoph, and T. Grechenig. Evaluating the Effect of Style in Information Visual-ization.IEEE TVCG, 18(12):2739–2748, 2012.
[27] E. Vessel and N. Rubin. Beauty and the beholder: Highly individual taste for abstract, but not real-world images.J. of Vision, 10(2)(18):1– 14, 2010.
[28] M. Visvalingam and J. Whyatt. Line generalisation by repeated elim-ination of points.The Cartographic J., 30(1):46–51, 1993.