Use of Ar pellet ablation rate to estimate initial runaway electron seed population in DIII-D rapid shutdown experiments
E.M. Hollmann1, N. Commaux2, R.A. Moyer1, P.B. Parks3, M.E. Austin4, I. Bykov1, C. Cooper3, N.W. Eidietis3, M. O’Mullane5, C. Paz-Soldan3, D.L. Rudakov1, D. Shiraki2
1 University of California – San Diego, 9500 Gilman Dr, La Jolla, CA 92093-0417 USA 2 Oak Ridge National Laboratory, PO Box 2008, Oak Ridge, TN 37831, USA
3 General Atomics, PO Box 85608, San Diego, CA 92186-5608, USA
4 Institute for Fusion Studies, University of Texas at Austin, 2100 San Jacinto Blvd, Austin, TX 78712-1047, USA
5 Department of Physics, University of Strathclyde, Glasgow GW ONG, UK
Abstract
Small (2-3 mm, 0.9 – 2 Pa-m3) argon pellets are used in the DIII-D tokamak to cause rapid shutdown (disruption) of discharges. The Ar pellet ablation is typically found to be much larger than expected from the thermal plasma electron temperature alone; the additional ablation is interpreted as being due to non-thermal runaway electrons (REs) formed during the pellet-induced temperature collapse. Simple estimates of the RE seed current using the enhanced ablation rate give values of order 1- 10 kA, roughly consistent with estimates based on avalanche theory. Analytic estimates of the RE seed current based on the Dreicer formula tend to significantly underestimate it, while estimates based on the hot tail model significantly overestimate it.
1. Background
Experimental determination of the disruption RE seed magnitude is extremely challenging because of the fast (~ 1 ms) time scale, large structural asymmetries of the TQ, and the small size of the RE seed compared with the background thermal plasma electrons. Observation of the RE “prompt loss” seeds lost to the wall at the end of the TQ/start of the CQ is possible via their hard x-ray (HXR) emission, but these HXR signals do not give reliable information on the remaining confined RE seeds of interest [16]. Non-thermal electron cyclotron emission (ECE) is frequently observed from REs at the end of the TQ; but quantitative interpretation of RE ECE emission is challenging even during semi-steady conditions [17] and has therefore not been attempted during the TQ. Presently, the RE seed in tokamak disruptions is typically estimated by assuming that avalanche theory is correct and then integrating backward from the RE plateau current at the start of the RE plateau (assuming total plasma current is dominated by RE current at that point) to arrive at a RE seed current at the start of the CQ [18]. However, the accuracy of avalanche theory during the CQ has never been validated. During the RE plateau, avalanche theory has been shown to be underestimate current dissipation by a factor of 10 or more [19]. During quiescent low density plasmas, avalanche theory also appears to underestimate RE current dissipation (by a factor 5 – 12) [20]. Thus, applying avalanche theory during the CQ is presently believed to, at best, give order-of-magnitude estimates for initial RE seed amplitudes.
Here, first attempts are made to experimentally estimate the size of the RE seed in rapid shutdown experiments using Ar pellet ablation rates. Normally, disruptions in DIII-D do not form significant RE populations [21]; however, disruptions initiated by Ar pellet injection typically form large (~100 kA) RE plateaus and have basic dynamics similar to “natural” disruptions in DIII-D [22] (~1 ms TQ duration and ~ 5 ms CQ duration), thus making them good experimental test cases for studying models of disruption RE formation and amplification. Comparison of the Ar pellet Ar-I emission with the electron temperature (Te) profiles indicates that the Ar pellet ablation can initially be explained by thermal electron ablation, but that non-thermal (RE) electron ablation tends to dominate later in the pellet trajectory. From the enhanced ablation due to REs, RE seed sizes of order 1 – 10 kA are estimated, roughly consistent with estimates from avalanche theory. The Dreicer formula applied to the shutdowns gives RE seed terms which tend to be significantly smaller than 1 – 10 kA, while the hot tail formula tends to give RE seeds terms which are significantly larger. This work therefore indicates that improved models of RE seed formation need to be developed for accurately estimating RE plateau currents resulting from tokamak disruptions.
2. Experimental setup
emission and an electron cyclotron emission (ECE) radiometer (x-mode, 2nd harmonic) to measure fast Te profiles. The fast camera has fixed gain, but exposure time was varied to avoid image saturation (linearity of gain with exposure time was verified during calibration). Circular inner wall limited, low density ne≈2×10¹⁹
m−3,
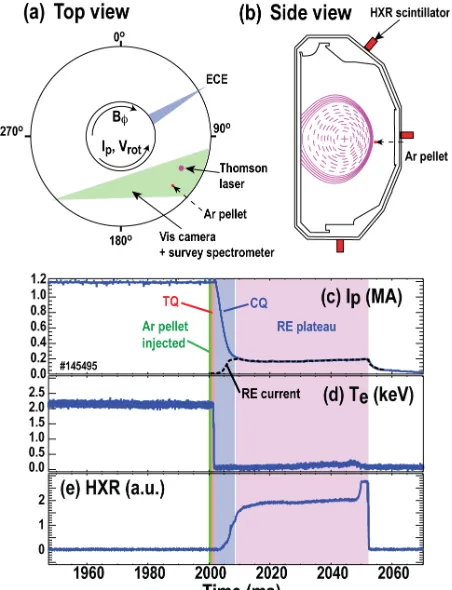
[image:3.612.90.316.274.569.2]electron cyclotron heated L-mode target plasmas were used. Quickly (within 1-2 ms) after Ar pellet injection, the TQ occurs (about 1 ms duration), followed by the CQ (about 5 ms duration), and the RE plateau (50 – 500 ms duration). RE current, illustrated only schematically in Fig. 1(c), is believed to originate in the TQ, amplify during the CQ, and then carry all of the plasma current during the RE plateau. During the CQ, the plasma control system does not work well; therefore, and open-loop outward push on the current channel (away from the center post) is used until control is re-established during the RE plateau [26].
Figure 1. Schematic of experiment showing (a) top view and (b) side view. Ar pellet trajectory and main diagnostics used here are shown. Also shown are time traces giving overview of typical experiment conditions showing (c) plasma current, (d) thermal electron temperature, and (e) hard x-ray emission. Vertical color bands serve only to illustrate different phases of disruption.
pellets correspond to 2.2×10²⁰ (4.8×10²⁰) Ar atoms, which are roughly comparable to the initial plasma electron number of order 3×10²⁰ electrons In 2011, the pellets were imaged with a visible fast framing camera filtered with a 696 nm bandpass filter with 5 nm bandwidth (FWHM) to isolate Ar-I 696.5 nm emission, while in 2013 and 2014, the pellets were imaged with either the same 696 nm filter or with a 810 nm filter with 10 nm FWHM to isolate Ar-I 810.4 nm plus Ar-I 811.5 nm. Of the many Ar pellet shutdowns in 2011 – 2014 (>200), only a small number (10) were analyzed here. Shots selected for the analysis had: (1) a whole unbroken Ar pellet entering the vacuum chamber (as indicated by a microwave cavity on the pellet guide tube immediately before the vacuum vessel); (2) good camera data with good associated spatial reference images and unsaturated Ar-I data (or weakly saturated data which could be corrected for); (3) complete Ar pellet burn up (Ar-I ablation plume forward velocity stops and emission disappears) before hitting the center post; (4) significant RE formation (50 kA minimum at start of the RE plateau); and (5) good ECE data with no signs of high density cutoff and no sign of nonthermal ECE emission from the vicinity of the RE pellet location. We cannot rule out some low level of weak nonthermal ECE emission at the pellet location, but strong ECE emission can clearly be seen in the data due to many adjacent channels (usually at low frequency/large major radius) suddenly spiking up strongly. Similarly, ECE cutoff (if it occurs) can be clearly observed as a whole series of channels suddenly dropping to essentially zero signal. Typically, however, ECE cutoff does not occur in these experiments during the TQ, as the ECE measurement is well separated from the pellet ablation plume toroidally and poloidally.
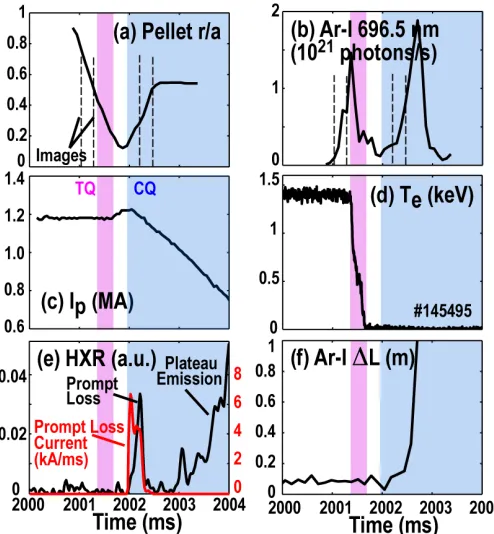
Figure 2 gives an overview of time traces on a fast (TQ) time scale for a typical fast pellet shutdown. The pellet location is shown in Fig. 2(a), while the total (integrated over the whole image) Ar-I brightness is shown in Fig. 2(b). Toroidal plasma current is shown in Fig. 2(c), while central electron temperature is shown in Fig. 2(d). Hard x-ray (HXR) emission is shown in Fig. 2(e). The approximate axial length of the ablation plume estimated from the Ar-I images is shown in Fig. 2(f). The vertical dashed lines in Fig. 2(a,b) correspond to times at which sample 696.5 nm Ar-I images are shown in Fig. 3.
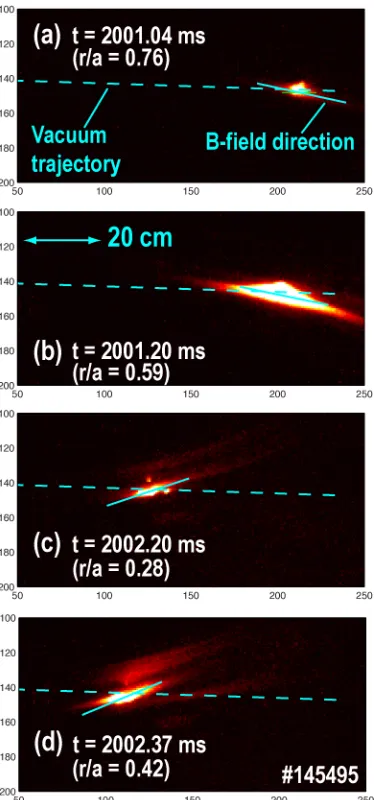
to follow the unperturbed magnetic field line direction reasonably well [solid cyan lines in Fig. 3(a-d)], as expected. In the shot of Fig. 2, the pellet forward velocity stops at around t = 2002.5 ms and the Ar-I emission drops to nearly 0 by about 2003 ms, Fig. 2(b). It is assumed that the pellet has been totally ablated at this point, i.e. that the solid Ar of the pellet has been converted to Ar ions of various charge states.
Figure 3. Sample Ar-I 696.5 nm images at times corresponding to vertical dashed lines in Fig. 2(a,b).
can be responsible for this observed enhanced ablation during the CQ for several reasons. First, although pellet breaking is indeed observed clearly in some shots either in the launch tube (seen by microwave cavity) or in the plasma during (seen by fast camera), there is no correlation between breaking and the anomalous CQ ablation and the shots chosen here did not have strong observed breaking in any case. Second, breaking is not expected to initiate from thermal plasma during the CQ, as the ablation pressure on the pellet during the CQ from thermal plasma is negligible and therefore there is not reason for the pellet to suddenly break apart during the CQ. Third, as will be discussed later, the observed enhanced ablation rate seen during the CQ is roughly 2 orders of magnitude larger than expected from thermal plasma ablation, while enhanced ablation from pellet breaking is not expected to be this high. For example, using the standard rpel
5/3 ablation rate scaling, a
pellet breaking into 4 pieces would be expected to have an ablation rate increase of 2.2×.
HXR emission, Fig. 2(e), is measured by scintillators outside of the vacuum vessel, requiring HXRs of 0.5 MeV energy or higher to give signal. There is a small early “prompt loss” spike near the start of the CQ which is thought to correspond to REs lost to the wall during start of the CQ, perhaps due to the CQ Ip “spike” radial current expansion. Toroidal asymmetries are seen in HXR signals at most stages of these experiments [16], but are not pursued further here; HXR signals are simply shown to demonstrate the existence of relativistic electrons in the plasma by the end of the TQ. No clear signature of HXR emission from REs interacting with the actual pellet is seen in these experiments. This is thought to be dominantly due to the small size of the pellet, resulting in very low energy deposition (most REs simply pass through the pellet even if they hit it). Additionally, the small pellet size makes for a very small HXR source region, making it harder to detect (especially as the HXRs will tend to be forward beamed).
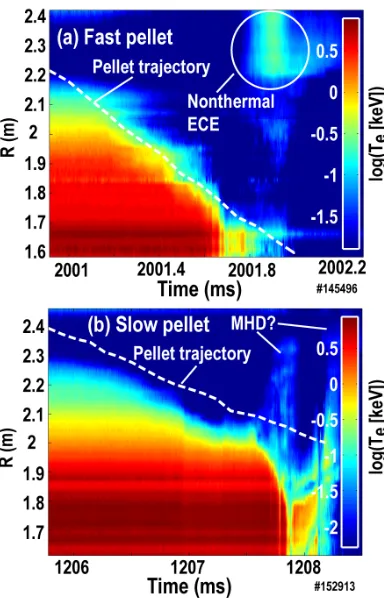
Figure 4. Examples of ECE contours vs major radius and time and pellet trajectories for (a) fast pellet and (b) slow pellet.
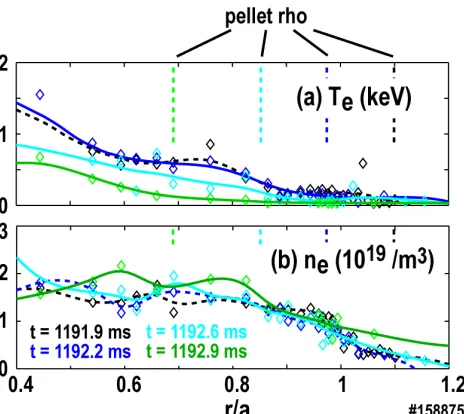
For the purposes of comparison with pellet ablation models, the electron density at infinity is estimated by using the initial Thomson scattering profile and assuming that ne at infinity (far away toroidally) is relatively unperturbed during the pellet trajectory. This is consistent with burst mode (fast pulsed) Thomson scattering ne profiles taken during the pellet trajectory; an example of this is shown in Fig. 5, where an electron temperature collapse but little electron density effect can be seen during the pellet trajectory through the plasma. The thermal plasma ablation rate is expected to scale like
n
e1/2, so the small changes in electron density seen in Fig. 5 can be ignored for the purposes of calculating thermal ablation. These small changes are probably due to toroidal and poloidal transport of some Ar ions into the Thomson viewing volume. ECE cutoff density is of order 8×10¹⁹Figure 5. Burst mode Thomson profiles of (a) electron temperature and (b) electron density during slow pellet trajectory showing little density perturbation far from pellet toroidally.
3. Experimental ablation rate
In these experiments, ablation rate is assumed to be proportional to Ar-I brightness, as will be justified in this section. Since shots are chosen where the pellet is intact initially and burns up completely before hitting the center post, the normalization for the ablation rate then is simply obtained by requiring that the integrated ablation rate equals the total number of Ar atoms initially in the pellet, i.e. we assume that ablation rate is given by where B is Ar-I brightness and S/XB (the “photon efficiency” or ionizations per photon) is assumed constant for each experiment. Integrating spatially over the Ar-I brightness in these experiments to estimate total emitted number of Ar-I photons/second is straightforward since Ar-I emission is observed to be far brighter in the vicinity of the pellet than elsewhere in the images. Use of an (S/XB) factor implies Ar-I emission from ionizing plasma. This is expected to be valid here, since electron temperatures in the TQ at the pellet location are 100 eV+. Even in the CQ, we estimate Te ~ 5 eV, which is still ionizing for Ar (ionization/recombination balance between Ar/Ar+ occurs between Te ~ 1.3 – 1.8 eV for ne = 1019 – 1021/m3).
Absolutely calibrated values of S/XB obtained in these experiments appear consistent with the assumption that S/XB is roughly constant over the pellet trajectory. S/XB for Ar-I emission varies with Te, so the approximation that ablation rate is proportional to Ar-I brightness is only valid to the extent that Te is pinned to a constant value in the Ar-I emission zone, and that the plasma is ionizing (i.e recombination of Ar+ can be neglected). Based on the relatively small (factor 2) scatter in the shot-shot calculated average S/XB and also on a comparison with absolutely-calibrated Ar-I 696.5 nm emission and theoretical Ar-I photon efficiencies, Te does appear to be pinned to a fairly narrow range in the Ar-I
!
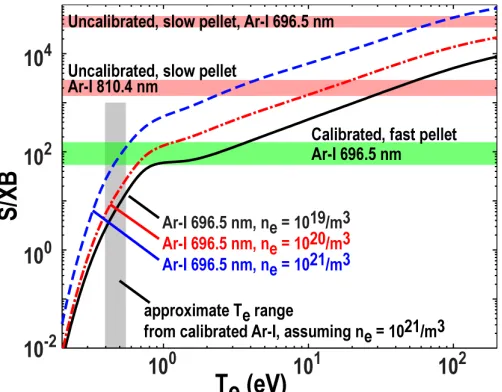
emission zone. Absolutely calibrated pellet Ar-I 696.5 nm brightness was obtained for the 2011 fast pellet experiments. During subsequent slow pellet experiments, the absolute Ar-I intensity was not well known due to unknown in-vacuum 225 degree mirror degradation over 2012 – 2014; however, this degradation is thought to be slow, so shot-shot comparison of relative signal levels on the same run day was still possible. Survey spectrometer data of pellet emission was obtained for slow pellets; this data indicates that Ar-I 696.5 nm imaging with a 5 nm bandpass typically includes a factor of about 2 due to continuum emission in the filter bandpass, as shown in Fig. 6; this factor of 2 is divided out of the measured camera signal. Dα emission vs time is also shown in Fig. 6(c) for curiosity sake – it can be seen that Dα has a quite different time dependence than Ar-I; this is not understood at present though. For the 810 nm filter, the survey spectrometer data indicates that the measured emission is typically ~80% dominated by Ar-I 810.4 nm and 811.5 nm lines. From the 2011 experiments, a measured photon efficiency varying over the range 60 – 160 ionizations/photon was estimated for different shots. Counts are binned from the entire image, which is dominated by the Ar ablation plume structure, i.e. reflections and edge Ar-I emission are negligible. The S/XB range of 60 - 160 is shown in Fig. 7 as a horizontal green band. Predicted S/XB as a function of Te is also shown in Fig. 7. This uses Breit-Pauli, pseudo-Rmatrix (BP-RMPS) level excitation rate calculations for neutral argon [27] input into the ADAS collisional-radiative model [28]. The electron density in the Ar-I emission zone is not known but is believed from Saha equilibrium estimates to be fairly high (ne≥10
21
m−3). It can be seen that the measured average S/XB values correspond to fairly low electron temperatures, Te ~ 0.5 – 1 eV. This indicates that Ar-I excitation is dominantly due to cold secondary electrons in the ablation plume (not 100 eV+ primary electrons or MeV REs) and is consistent with Ar-I emission coming from the Ar-I to Ar-II transition zone in Saha equilibrium at high density. Ar-I emission B [photons/s] can then be roughly converted to the instantaneous ablation rate N! ,
!
Figure 6. Survey spectrometer data of slow Ar pellet emission showing: (a) a sample spectrum in the vicinity of Ar-I 696.5 nm, (b) a sample spectrum in the vicinity of Ar-I 810.4 nm, (c) time traces of Ar-I 696.5 nm and Dα 656.2 nm, and (d) time traces of Ar-I 810.4 nm and Ar-II 611.5 nm.
Figure 7. Curves of theoretical photon efficiency S/XB for Ar-I 696.5 nm vs Te and range of S/XB seen in fast pellet experiments. Absolute (scale) for uncalibrated data is arbitrary; data is shown to illustrate low shot-shot scatter in S/XB.
Assuming that Ar-I emission is proportional to pellet ablation rate in each experiment and assuming that S/XB is some constant for that experiment then gives curves of N! as a function of time, which can be compared with theory. Typical
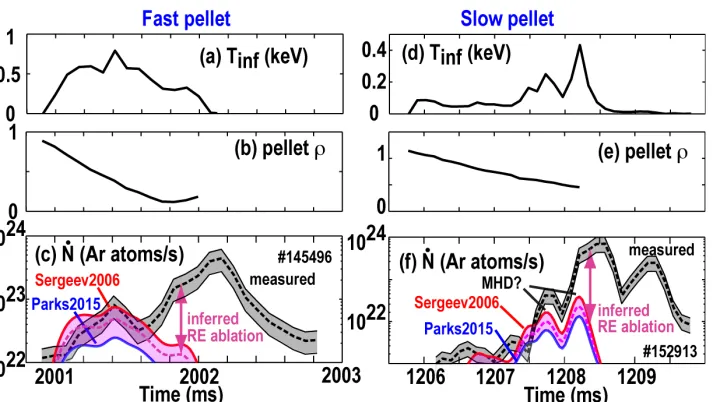
[image:11.612.93.344.369.565.2](dominated by RE ablation). Slow pellets tend to have multiple ablation spikes, all on the low field side; this is suspected to be due to REs (and thermal electron heat) transporting out radially from the core and hitting the pellet during TQ MHD activity; these spikes can be seen in both the ablation rate, Fig. 8(f), as well as the Te contours for the same shot, Fig. 4(b). Two ablation models are shown: Parks2015 and Sergeev2006. Parks2015 uses a neutral gas shielding model [29] recently improved to have an effective ionization energy which remains valid at lower electron temperatures (this model will be presented in detail in a future dedicated publication). Sergeev2006 also uses a neutral gas shielding model but invokes ion cross-field transport to remove electrostatic shielding of electron heat flux in order to better match observations in previous experiments [30]. It can be seen in Fig. 8 that predicted ablation rates agree with the data within a factor of 2-5× initially. As the pellets move into the plasma, however, agreement becomes worse and worse, eventually falling to where predicted ablation rates are more than 100× too small to explain the data. This is consistent with REs doing the bulk of the final pellet ablation in both fast and slow pellet cases. Even though the final pellet ablation is being performed by REs, it is expected that the Ar-I emission is still dominated by cold electrons in the ablation plume. This is not a contradiction: ablation is dominated by fast electrons which can penetrate through the neutral atom and electrostatic potential barriers of the ablation plume and therefore increases with electron temperature (~ Te
1.6), while Ar-I line emission requires an electron energy
[image:12.612.97.453.411.612.2]of order only 10 eV, so excitation will roll over for high Te and will be dominated by colder, higher density electrons.
Figure 8. Comparison between measured and predicted Ar ablation rate for fast pellet (left side) and slow pellet (right side). Data shows time traces of (from top to bottom) T∞ (Te toroidally far from pellet), pellet position (normalized minor radius), and measured and modeled ablation rate.
As seen in Fig. 8, the measured Ar pellet ablation rate is larger over much of the pellet trajectory than predicted by theory for thermal electrons. We assume that this additional ablation is due to RE seed electrons, giving a RE ablation rate N!RE (we take the average of the Parks2015 and Sergeev2006 models to estimate thermal electron ablation). Assuming for simplicity RE seed electrons with zero pitch angle, can be used to estimate the local RE seed current density jRE=enREvRE seen by
the Ar pellet:
jRE ≈ eN!REΔHAr ρArVPLe
, (1)
where ΔHAr ≈0.07 eV is the sublimation energy of solid Ar, ρAr is the solid Ar
density, Vp is the pellet volume, and Le≈2×10
5
eV-m2
/kgis the approximate total stopping power of Ar on fast electrons in the 0.1 – 10 MeV energy range.
Converting the local RE current density jRE into a total RE seed current is challenging because the RE seed radial profile evolves as the Ar pellet crosses the plasma profile. For simplicity, we estimate the RE seed current using two limits: a no radial transport limit, and a rapid radial transport limit. For fast Ar pellets, we use the no radial transport approximation: it is assumed that the RE seeds are fixed in space and the pellet samples a fixed background profile of REs. Data from the high field side and low field side (which are actually usually strongly asymmetric) are simply averaged into a single curve of RE density vs minor radius nRE
( )
ρ tointegrate radially to obtain a total RE seed current. For slow Ar pellets, whose ablation appears clearly affected by radial heat transport, we use a fast radial transport approximation: it is assumed that RE seeds are formed ahead of the pellet; and then during the TQ the pellet touches the outer edge of the RE profile and is destroyed. The RE seed current is then estimated just assuming a top hat density profile of REs out to minor radius ρend, where ρend is the minor radius at which the pellet is destroyed. The assumption that the outer edge of the RE profile can destroy the pellet is very strong, but not inconsistent with previous measurements of small plastic pellet injection into the RE plateau, where pellet vaporization was observed far outside the main plasma column where RE density was still quite low [31].
In both fast and slow pellet cases, the unknown fraction of “prompt loss” REs lost to the wall during the TQ is assumed to be small and is neglected. This is not necessarily a contradiction with the slow pellet model, where RE radial transport is assumed to be fast compared with the pellet motion and radial loss to the wall might therefore be assumed to be large. The slow pellet model assumes that the RE radial profile moves out and destroys the pellet, but this does not automatically require that the profile moves all the way to the wall and gives significant RE seed loss. For example, transport of REs could be fast across ergodic regions of island overlap but then slow across other regions. Conclusively demonstrating that RE prompt loss is small compared with confined RE seeds is challenging. 2.5D resistive MHD simulations (NIMROD) indicate RE prompt loss in DIII-D limited discharges due to
!
TQ MHD should be of order ~10% assuming a uniform initial RE seed distribution [32]. Rough estimates of prompt RE loss currents can be made from HXR signals, typically giving values of order 1 kA, so perhaps 10× smaller than confined RE seeds. An example of prompt loss HXR signals converted to prompt loss current is shown in Fig. 2(e); this conversion assumed that the RE energy was given by the maximum possible value (derived from the predicted time evolution of the toroidal electric field) and that the pitch angle of REs striking the carbon divertor corresponded to 5 degrees (a typical expected divertor field line pitch angle), giving a total prompt loss RE current of 1.3 kA.
5. Estimating RE seed current from analytical theories
As mentioned in the introduction, RE seed formation has been treated analytically in the steady-state (Dreicer [11]) and rapid (Hot tail) limits [15]; both models depend on the toroidal electric fieldEφ, which is not measured. Here, we estimate Eφ using the standard approach of a 1D current diffusion calculation [33]. The initial current profile j r
( )
is taken from an EFIT reconstruction from 100 ms before the pellet arrival and is then evolved forward in time during shutdown using:∂j
∂t =
1
µ0r
∂ ∂r r
∂
( )
ηj∂r
"
#
$ %
&
' . (2)
The electric field is then given by Eφ =ηj. The RE current is neglected here, i.e. RE seeds are assumed to be a small perturbation on the ohmic current during the TQ (this is supported subsequently by the result of 1 – 10 kA RE seed current). A zero current boundary condition is assumed at the wall; this is expected to be reasonable during the TQ, which is fast (~ 1 ms) compared with the DIII-D wall time of 7 – 10 ms. Similarly, interactions with external coils can generally be ignored in DIII-D on the TQ timescale. Also, we ignore MHD, so we do not capture the Ip “spike” which occurs at the start of the CQ, e.g. Fig. 2(c), t = 2002 ms. The plasma resistivity η is calculated using standard Spitzer resistivity at each time step and assuming that Ar ablated from the pellet is instantly spread uniformly over the radial shell containing the pellet and ionized up to its equilibrium charge state at the background electron temperature of that shell, T∞. This is clearly an approximation, especially at the pellet location; however, due to the small size of the pellet relative to the plasma minor radius, it is expected that the precise details of the plasma resistivity in the shell containing the pellet are not crucial for the global current density profile evolution. Overall, the error in total current from integrating Eq. (2) when compared with the measured Ip is only about 1% by the end of the TQ, but grows thereafter, to about 10% by the middle of the CQ (dominantly due to neglect of finite wall resistivity).
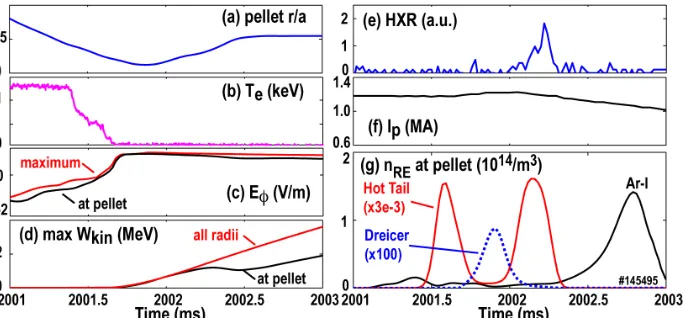
the pellet and over the whole profile (from integrating Eφ over time), and Fig. 9(e) shows HXR signals, (f) shows toroidal plasma current, and (g) shows RE density. The motivation for showing Wkin is to give a rough estimate of RE energy, showing MeV-level REs interacting with the pellet during its trajectory, consistent with the use of the 0.1 – 10 MeV range for the stopping power in Eq. (1) and consistent with the first appearance of HXR signal, Fig. 9(e). Of course, collisions will cause a distribution of RE energies extending down from the maximum allowable energy, but this is ignored here. The Dreicer seed is calculated using the Z-dependent version of the Dreicer formula [14]. The hot tail density resulting from the temperature collapse at each radius is calculated by integrating Eq. (4) in Ref. [15] numerically using the suggested distribution function Eq. (9) for very rapid temperature decay. The black curve in Fig. 9 shows RE density nRE from measured
Ar-I brightness. The Dreicer seed term is of order 100× below the measured nRE and
[image:15.612.99.441.325.484.2]has a centrally peaked radial profile, in contrast with the hollow profile obtained experimentally (in this fast pellet shot). The hot tail nRE has a hollow radial profile, but with a magnitude which is more than 100× too large.
Figure 9. Time traces for fast pellet of (a) pellet location, (b) central electron temperature, (c) Toroidal electric field at pellet (and maximum across whole profile), (d) maximum RE kinetic energy at pellet (and across whole profile), (e) HXR signals, (f) toroidal plasma current, and (e) RE density at pellet location.
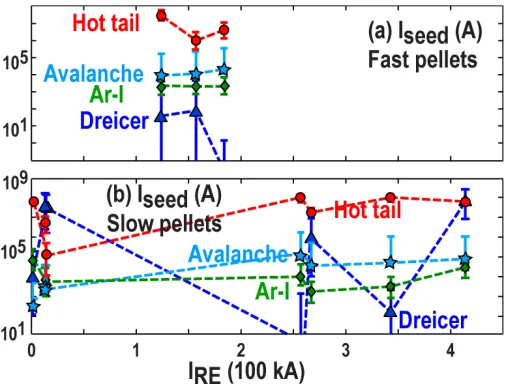
Figure 10 shows the total RE seed current at the end of the TQ estimated from the pellet ablation (labeled “Ar-I”), as well as the hot tail and Dreicer-estimated RE seed currents and also the RE seed current estimated by integrating avalanche theory backward. For applying avalanche theory, the simulated 1D profile from Eq. (2) is used initially. Moving into the CQ, however, the model of Eq. (2) becomes less and less accurate, as discussed above. Additionally, ECE measurements of Te become invalid early in the CQ. Thus, we transition to assuming a uniform Te profile, with Te ~ 5 eV estimated from the measured L/R current decay time and Spitzer resistivity. The electric field is estimated from the measured current decay rate and assuming a parabolic current density profile. The plasma electron density during the CQ is estimated from line-integrated interferometer measurements and the Ar impurity
fraction from the pellet mass. The integration is carried out for 7 ms starting at the beginning of the CQ. To assist in evaluating the validity of the comparisons of Fig. 10, an attempt is made to estimate characteristic errors. For the Ar-I brightness method, the uncertainty in the data is estimated to be roughly a factor 8 for fast pellets and a factor 12 for slow pellets. This is arrived at assuming a factor two uncertainty in Ar-I S/XB (from the shot-shot scatter of factor 2), a factor two uncertainty from ignoring the RE energy distribution and pitch angle, and a factor of 2 (3 for slow pellets) uncertainty from the radial integration of RE density (estimated by swapping the two methods used in each shot and observing the typical variation in resulting RE current calculated). For the avalanche method of estimating RE seeds, we assume that the actual RE seed could be up to a factor of 10 higher than estimated (using the factor of up to 10 reduced effective avalanche rate measured in the RE plateau), and add an additional factor of 2 higher assuming that up to ½ the initial RE seed at the end of the TQ could be lost at the start of the CQ during the prompt loss event. For the Dreicer and hot tail calculations, we assume that the dominant source of error is the electric field calculation. This error is simulated by running the current diffusion calculation with plasma resistivity increased (or decreased) by a scale factor 1.25 (or .75); this results in quite large error bars, especially on the estimated Dreicer seed (several orders of magnitude). Even with the large uncertainties in this data/theory comparison, it can be seen in Fig. 10 that the ablation (Ar-I brightness) method is reasonably close (10× or better) to the avalanche method, roughly within expected uncertainties. However, the hot tail and Dreicer analytic estimates typically differ by more than 10-100× from the ablation measurement and usually fall outside of expected uncertainties.
Figure 10. RE seed current at end of TQ estimated for (a) fast pellets and (b) slow pellets as a function of initial RE plateau current.
disruptions of these target plasmas, the initial non-thermal population is thought to be small and is ignored here.
6. Summary
Overall, these experiments suggest a fairly complex picture for RE seed formation and resulting pellet ablation in these experiments: Argon is ablated away from the pellet as it moves into the plasma, causing a “cold front” of Ar ions mixing into the plasma. At this cold front, electron temperature drops very rapidly due to line radiation, leading to RE seed formation. Behind the cold front, highly resistive plasma leads to current channel shrinking and eventual destabilization of MHD modes, which can cause increased heat and particle mixing (at least over their island widths). Different typical dynamics are seen for fast pellet versus slow pellet shutdowns. In the case of fast pellet shutdowns, the pellet tends to move with the cold front. REs are created at or behind the pellet but spread quickly around flux surfaces poloidally. Because of this, when the pellet reaches the high field side, REs that were created earlier behind the pellet (on the low field side) are there waiting and destroy the pellet. In the case of slow pellet shutdowns, the cold front moves ahead of the pellet and causes RE formation ahead of the pellet. The lower pellet velocity gives the current channel more time to shrink and the effect of MHD becomes more pronounced. Destabilized modes dump RE seeds out of the core radially; these REs hit the pellet and destroy it.
Despite these complex dynamics, rough estimates of the RE seed term were made here by making simplifying assumptions about RE radial transport. Within the large uncertainties in the models and data analysis, the resulting RE seed currents of 1 – 10 kA are reasonably consistent with estimates using avalanche theory applied over the CQ. Best results are obtained with fast Ar pellet data neglecting radial transport of REs; for slow Ar pellets, radial transport of REs (possibly due to TQ MHD) becomes important, making analysis more difficult and uncertainties larger. Compared with the experiments, hot tail RE seed estimates are typically found to be 100× too large, while Dreicer RE seed estimates are typically found to be 10-100× too small. These results are not unreasonable, since the Dreicer formula assumes steady state (clearly not the case here); while the hot tail formula assumes a temperature decay which is fast compared to the electron temperature equilibration time, but these experiments are in an intermediate regime where the local temperature decay time (~ 0.3 ms) is comparable to the initial electron temperature equilibration time (~0.1 – 0.3 ms). This work therefore suggests that improved methods for calculating the disruption RE seed term need to be developed; either with fast, robust numerical methods (Fokker-Planck solvers) or with improved analytical formulas.
Acknowledgements
Lasnier, M. Makowski, E. Unterberg, M. van Zeeland, and Y. Zhu is gratefully acknowledged. This work was supported in part by the U.S. Department of Energy under FG02-07ER54917, FC02-04ER54698, AC05-00OR22725, DE-AC52-07NA27344, and DE-AC05-06OR23100. The originating developer of ADAS is the JET Joint Undertaking.
References
[1] Hender T.C. et al 2007 Progress in the ITER physics basis: chapter 3. MHD stability, operational limits and disruptions Nucl. Fusion 47 S128-202.
[2] Rosenbluth M.N. et al 1997 Nucl. Fusion 37 1355. [3] Eriksson L.G. et al 2004 Phys. Rev. Lett. 92 205004. [4] Hollmann E.M. et al 2011 Nucl. Fusion 51 103026. [5] Hollmann E.M. et al 2015 Phys. Plasmas 22 021802. [6] Harvey R.W. et al 2000 Phys. Plasmas 11 4590. [7] Eriksson L.G. et al 2003 Comp. Phys. Comm. 154 175. [8] Landreman M. et al. 2014 Comp. Phys. Comm. 185 847.
[9] Smith H.M. et al 2009 Plasma Phys. Contro. Fusion 51 124008. [10] Feher T. et al 2011 Plasma Phys. Control. Fusion 53 035014. [11] Dreicer H. 1960 Phys. Rev. 117 329.
[12] Gurevich A.V. 1961 Sov. Phys. JETP 12 904. [13] Kulsrud R.M. et al 1973 Phys. Rev. Lett. 31 690. [14] Connor J.W. et al 1975 Nucl. Fusion 15 415. [15] Smith H.M. et al 2008 Phys. Plasmas 15 072502. [16] James A.N. et al 2012 Nucl. Fusion 52 013007. [17] Knoepfel H. et al 1979 Nucl. Fusion 19 785.
[18] Hollmann E.M. et al 2010 Phys. Plasmas 17 056117. [19] Hollmann E.M. et al 2015 Phys. Plasmas 22 056108. [20] Granetz R.S. et al 2014 Phys. Plasmas 21 072506. [21] Hollmann E.M. et al 2011 J. Nucl. Mater. 415 S27. [22] Hollmann E.M. et al 2003, Phys. Plasmas 10 2863. [23] Luxon J.L. 2002 Nucl. Fusion 42 614.
[24] Taylor P.L. et al 1999 Phys. Plasmas 6 1872. [25] Pautasso G. et al 1996 Nucl. Fusion 36 1291. [26] Eidietis N. et al 2012 Phys. Plasmas 19 056109.
[27] Balance C.P. and Griffin D.C. 2008, J. Phys. B 41 065201.
[28] Summers H.P. et al 2006 Plasma Phys. Control. Fusion 48 263.
[29] Parks P.B. and Rosenbluth M.N. 1998 Phys. Plasmas 5 1380; Parks P.B. et al 2012 Phys. Plasmas 19 109901.