ScienceDirect
Available online at Available online at www.sciencedirect.comwww.sciencedirect.com
ScienceDirect
Energy Procedia 00 (2017) 000–000
www.elsevier.com/locate/procedia
1876-6102 © 2017 The Authors. Published by Elsevier Ltd.
Peer-review under responsibility of the Scientific Committee of The 15th International Symposium on District Heating and Cooling.
The 15th International Symposium on District Heating and Cooling
Assessing the feasibility of using the heat demand-outdoor
temperature function for a long-term district heat demand forecast
I. Andrić
a,b,c*, A. Pina
a, P. Ferrão
a, J. Fournier
b., B. Lacarrière
c, O. Le Corre
c aIN+ Center for Innovation, Technology and Policy Research - Instituto Superior Técnico, Av. Rovisco Pais 1, 1049-001 Lisbon, PortugalbVeolia Recherche & Innovation, 291 Avenue Dreyfous Daniel, 78520 Limay, France
cDépartement Systèmes Énergétiques et Environnement - IMT Atlantique, 4 rue Alfred Kastler, 44300 Nantes, France
Abstract
District heating networks are commonly addressed in the literature as one of the most effective solutions for decreasing the greenhouse gas emissions from the building sector. These systems require high investments which are returned through the heat sales. Due to the changed climate conditions and building renovation policies, heat demand in the future could decrease, prolonging the investment return period.
The main scope of this paper is to assess the feasibility of using the heat demand – outdoor temperature function for heat demand forecast. The district of Alvalade, located in Lisbon (Portugal), was used as a case study. The district is consisted of 665 buildings that vary in both construction period and typology. Three weather scenarios (low, medium, high) and three district renovation scenarios were developed (shallow, intermediate, deep). To estimate the error, obtained heat demand values were compared with results from a dynamic heat demand model, previously developed and validated by the authors.
The results showed that when only weather change is considered, the margin of error could be acceptable for some applications (the error in annual demand was lower than 20% for all weather scenarios considered). However, after introducing renovation scenarios, the error value increased up to 59.5% (depending on the weather and renovation scenarios combination considered). The value of slope coefficient increased on average within the range of 3.8% up to 8% per decade, that corresponds to the decrease in the number of heating hours of 22-139h during the heating season (depending on the combination of weather and renovation scenarios considered). On the other hand, function intercept increased for 7.8-12.7% per decade (depending on the coupled scenarios). The values suggested could be used to modify the function parameters for the scenarios considered, and improve the accuracy of heat demand estimations.
© 2017 The Authors. Published by Elsevier Ltd.
Peer-review under responsibility of the Scientific Committee of The 15th International Symposium on District Heating and Cooling.
Keywords:Heat demand; Forecast; Climate change
Energy Procedia 142 (2017) 2189–2194
1876-6102 © 2017 The Authors. Published by Elsevier Ltd.
Peer-review under responsibility of the scientific committee of the 9th International Conference on Applied Energy . 10.1016/j.egypro.2017.12.587
10.1016/j.egypro.2017.12.587 1876-6102
ScienceDirect
Energy Procedia 00 (2017) 000–000www.elsevier.com/locate/procedia
1876-6102 © 2017 The Authors. Published by Elsevier Ltd.
Peer-review under responsibility of the scientific committee of the 9th International Conference on Applied Energy.
9th International Conference on Applied Energy, ICAE2017, 21-24 August 2017, Cardiff, UK
Neutral thermal sensation or dynamic thermal comfort?
Numerical and field test analysis of a thermal chair
Sally Shahzad
a*, John Kaiser Calautit
b, Angelo I. Aquino
c, Diana SNM Nasir
c, Ben
Richard Hughes
caDepartment of Mechanical Engineering and the Built Environment, University of Derby, Derby, DE22 3AW, UK bFaculty of Engineering, University of Nottingham, NG7 2RD, UK
cDepartment of Mechanical Engineering, University of Sheffield, S10 2TN, UK
Abstract
Neutral thermal sensation is considered as the measure of thermal comfort in research, as when participants report feeling neutral regarding the thermal environment, they are considered as thermally comfortable. This is taken for granted, and although a few researchers have criticised the matter, still researchers use thermal sensation and the neutral point to assess the thermal conditions in their studies. This study questions the application of thermal neutrality and consequently poses a question on the findings of all the studies that only rely on it. Field studies of thermal comfort were applied in an open plan office in the UK in the winter of 2014. Participants were provided with a thermal chair and before and after using the chair, their views of comfort were recorded, including the ASHRAE seven point scale of thermal sensation, thermal preference, comfort, and satisfaction. The thermal environment was measured and compared against the ASHRAE Standard 55-2013. In addition, numerical modelling was also conducted to investigated the airflow and thermal distribution around the proposed thermal chair with a seated occupant. The results indicated that overall, 72% of the respondents, who did not feel neutral (thermal sensation) before or after using the thermal chair reported to feel comfortable and 65% reported to be satisfied. The results indicated that a neutral thermal sensation does not guarantee thermal comfort of the occupants and that thermal comfort is dynamic and other thermal sensations need to be considered. This study recommends the use of multiple methods (e.g. thermal, preference, decision, comfort, and satisfaction) to assess thermal comfort more accurately. Also, it questions the findings of any research that solely relies on thermal sensation and particularly on the neutral thermal sensation to assess thermal comfort of the occupants. The results also emphasised the importance of the application of numerical modelling in evaluating the thermal performance of the chair.
© 2017 The Authors. Published by Elsevier Ltd.
Peer-review under responsibility of the scientific committee of the 9th International Conference on Applied Energy.
Keywords: Thermal comfort; thermal control; neutral thermal sensation, thermal chair; workplace
1.Introduction
[image:2.544.28.498.227.340.2]Thermal comfort studies are mainly based on the ‘neutral thermal sensation’ [1,2], which is considered the measure of thermal comfort [3]. Currently, the widely used measure of thermal comfort of occupants is ASHRAE seven-point scale of thermal sensation (Table 1) [4], and the neutral sensation is considered as the comfort status of the occupant regarding the thermal environment. In many studies and research contexts, ‘thermal neutrality’ has been used instead of thermal comfort, such as the ASHRAE Handbook [4], the work of McCartney and Nicol [5] and the definition of thermal comfort [6-7]. Although the application of the neutral thermal sensation as the measure of thermal comfort has been criticized [8,9], still the main stream of thermal comfort research assesses thermal comfort just according to this measure, such as the work of [10-13]. Therefore, their findings are dependent on assumption that neutral thermal sensation means thermal comfort of the occupant. In other words, occupants feel comfortable regarding the thermal environment only when they feel neutral, meaning neither cold, nor hot [6].
Table 1: The ASHRAE seven point scales [4]
Seven-point thermal sensation scale:
Cold Cool Slightly cool Neutral Slightly warm Warm Hot
-3 -2 -1 0 1 2 3
Seven-point thermal preference scale:
Much cooler Cooler Slightly cooler No change Slightly warmer Warmer Much warmer
-3 -2 -1 0 1 2 3
Seven-point comfort scale:
Very uncomfortable Uncomfortable Slightly uncomfortable Neutral Slightly comf. Comfortable Very comfortable
-3 -2 -1 0 1 2 3
Seven-point satisfaction scale:
Very dissatisfied Dissatisfied Slightly dissatisfied Neutral Slightly satisfied Satisfied Very satisfied
-3 -2 -1 0 1 2 3
Shahzad uses thermal decision, which is a combination of thermal sensation and thermal preference [8]. Thermal decision shows that in case a respondent felt neutral (thermal sensation) but wanted a change in the thermal environment to slightly warmer (thermal preference), their thermal decision is the combination of the two, which is slightly warm. Therefore, although the respondent had a neutral thermal sensation, because they wanted to feel slightly warmer, overall they want to feel slightly warm (thermal decision) [8]. Thermal decision was used in this research as well as thermal sensation, thermal preference, comfort and, satisfaction. This study examined the accuracy of the application of neutral thermal sensation in thermal comfort research. Occupants’ views of thermal comfort were investigated in the context of an open plan office when a thermal chair was provided. The separate temperature controls on the back and the seat of the chair allowed respondents to adjust the temperature according to their requirements to find their own comfort condition. The study investigated whether this comfort condition is in agreement with thermal neutrality or not.
2.Previous related work
Studies show that thermal control increases user thermal comfort [14]. Thermal chair has been studied in several studies, mainly as a ventilated or cooled chair [15-17], as demonstrated in Figure 1. The ventilation was either designed in the armrests of the chair [15], back or seat [16,17]. Watanabe et al provided separate control systems for the seat and the back [15]. Zhao et al combined the back and seat fans with heating elements on the back and the seat of the chair for the use in both the cold and warm season [17], as illustrated in section c in Figure 1.
Figure 1. Thermal chairs studied by a. Kogawa et al [15] b. Watanabe et al [16] c. Zhao et al [17]
However, most researchers focus on the cooling effect of the office chair rather than the heating aspect of it. In the car industry, cooled or warm chair has been used [18] and in some studies a water tubes were used for both cooling and heating purposes [19]. The studies found that the heating application of the chair is more effective than cooling [20]. In all these studies, mainly experiments in the in the climate chambers were carried out rather than the real context of the workplace. The experimental chambers have been criticised for the lack of context, which holds valuable information that influences occupants’ comfort [21]. Also, the findings of experimental chambers may not apply to the context of real life [22].
3. Research methods
This study investigated the accuracy of neutral thermal sensation as the measure of thermal comfort through the application of a thermal chair. The prototype of an office chair equipped with heat pads on the seat and the back of the chair with separate temperature controls was designed [23], as illustrated in Figure 2. The application of this thermal chair was examined through field studies of thermal comfort in an open plan office in the University of Leeds in the winter of 2014, where 44 occupants with mainly sedentary activities participated in the research. This was the real context of the office and participants continued with their normal everyday activities during the study. Respondents were mainly in their twenties and thirties and they included 15 females and 19 males. Their views of comfort, satisfaction and thermal comfort (presented in Table 1) were recorded before and after an hour of using the thermal chair, as presented in Figure 2. As explained separate manual control systems were provided for the seat and the back of the chair and occupants were briefed on using them. The temperature settings of the chair for every participant were recorded and the satisfaction of the respondents regarding the use of the thermal chair was investigated. A good practice example of the workplace with a good quality of thermal environment was selected for this study to limit the impact of the thermal environment on occupants’ thermal decision. For this reason, the thermal environment was measured (dry bulb temperature, humidity and mean radiant temperature). Accordingly, the PMV was calculated and it was compared against the ASHRAE Standard 55-2013, which was satisfactory.
Figure 2. Thermal Chair, designed for this study
This research will also use the Computational Fluid Dynamic (CFD) tool ANSYS FLUENT to assess the airflow and thermal distribution around a thermal chair with a seated manikin. The basic assumptions for the numerical simulation include a three-dimensional, fully turbulent, and incompressible flow. The CFD code was used with the Finite Volume Method (FVM) approach and the Semi-Implicit Method for Pressure-Linked Equations (SIMPLE) velocity-pressure coupling algorithm with the second order upwind discretisation. The k-epsilon transport model was employed for the air turbulence due to its well-documented performance in predicting indoor airflows. The general
governing equations include the continuity, momentum and energy balance for each individual phase. Figure 3a shows the computational domain created around the thermal chair with a seated manikin. The computational domain
consisted of an inlet (set at 0.1 m/s and 23˚C) on one side of the domain, and an outlet on the opposing boundary
wall with the thermal chair located centrally. Two configurations were simulated; (a) an office chair with heated seat (heat flux: 40 W/m2) and back rest (heat flux: 40 W/m2) and (b) a standard non-heated office chair and 250mm
[image:2.544.136.411.572.668.2]1.Introduction
Thermal comfort studies are mainly based on the ‘neutral thermal sensation’ [1,2], which is considered the measure of thermal comfort [3]. Currently, the widely used measure of thermal comfort of occupants is ASHRAE seven-point scale of thermal sensation (Table 1) [4], and the neutral sensation is considered as the comfort status of the occupant regarding the thermal environment. In many studies and research contexts, ‘thermal neutrality’ has been used instead of thermal comfort, such as the ASHRAE Handbook [4], the work of McCartney and Nicol [5] and the definition of thermal comfort [6-7]. Although the application of the neutral thermal sensation as the measure of thermal comfort has been criticized [8,9], still the main stream of thermal comfort research assesses thermal comfort just according to this measure, such as the work of [10-13]. Therefore, their findings are dependent on assumption that neutral thermal sensation means thermal comfort of the occupant. In other words, occupants feel comfortable regarding the thermal environment only when they feel neutral, meaning neither cold, nor hot [6].
Table 1: The ASHRAE seven point scales [4]
Seven-point thermal sensation scale:
Cold Cool Slightly cool Neutral Slightly warm Warm Hot
-3 -2 -1 0 1 2 3
Seven-point thermal preference scale:
Much cooler Cooler Slightly cooler No change Slightly warmer Warmer Much warmer
-3 -2 -1 0 1 2 3
Seven-point comfort scale:
Very uncomfortable Uncomfortable Slightly uncomfortable Neutral Slightly comf. Comfortable Very comfortable
-3 -2 -1 0 1 2 3
Seven-point satisfaction scale:
Very dissatisfied Dissatisfied Slightly dissatisfied Neutral Slightly satisfied Satisfied Very satisfied
-3 -2 -1 0 1 2 3
Shahzad uses thermal decision, which is a combination of thermal sensation and thermal preference [8]. Thermal decision shows that in case a respondent felt neutral (thermal sensation) but wanted a change in the thermal environment to slightly warmer (thermal preference), their thermal decision is the combination of the two, which is slightly warm. Therefore, although the respondent had a neutral thermal sensation, because they wanted to feel slightly warmer, overall they want to feel slightly warm (thermal decision) [8]. Thermal decision was used in this research as well as thermal sensation, thermal preference, comfort and, satisfaction. This study examined the accuracy of the application of neutral thermal sensation in thermal comfort research. Occupants’ views of thermal comfort were investigated in the context of an open plan office when a thermal chair was provided. The separate temperature controls on the back and the seat of the chair allowed respondents to adjust the temperature according to their requirements to find their own comfort condition. The study investigated whether this comfort condition is in agreement with thermal neutrality or not.
2.Previous related work
Studies show that thermal control increases user thermal comfort [14]. Thermal chair has been studied in several studies, mainly as a ventilated or cooled chair [15-17], as demonstrated in Figure 1. The ventilation was either designed in the armrests of the chair [15], back or seat [16,17]. Watanabe et al provided separate control systems for the seat and the back [15]. Zhao et al combined the back and seat fans with heating elements on the back and the seat of the chair for the use in both the cold and warm season [17], as illustrated in section c in Figure 1.
Figure 1. Thermal chairs studied by a. Kogawa et al [15] b. Watanabe et al [16] c. Zhao et al [17]
However, most researchers focus on the cooling effect of the office chair rather than the heating aspect of it. In the car industry, cooled or warm chair has been used [18] and in some studies a water tubes were used for both cooling and heating purposes [19]. The studies found that the heating application of the chair is more effective than cooling [20]. In all these studies, mainly experiments in the in the climate chambers were carried out rather than the real context of the workplace. The experimental chambers have been criticised for the lack of context, which holds valuable information that influences occupants’ comfort [21]. Also, the findings of experimental chambers may not apply to the context of real life [22].
3. Research methods
[image:3.544.110.437.358.479.2]This study investigated the accuracy of neutral thermal sensation as the measure of thermal comfort through the application of a thermal chair. The prototype of an office chair equipped with heat pads on the seat and the back of the chair with separate temperature controls was designed [23], as illustrated in Figure 2. The application of this thermal chair was examined through field studies of thermal comfort in an open plan office in the University of Leeds in the winter of 2014, where 44 occupants with mainly sedentary activities participated in the research. This was the real context of the office and participants continued with their normal everyday activities during the study. Respondents were mainly in their twenties and thirties and they included 15 females and 19 males. Their views of comfort, satisfaction and thermal comfort (presented in Table 1) were recorded before and after an hour of using the thermal chair, as presented in Figure 2. As explained separate manual control systems were provided for the seat and the back of the chair and occupants were briefed on using them. The temperature settings of the chair for every participant were recorded and the satisfaction of the respondents regarding the use of the thermal chair was investigated. A good practice example of the workplace with a good quality of thermal environment was selected for this study to limit the impact of the thermal environment on occupants’ thermal decision. For this reason, the thermal environment was measured (dry bulb temperature, humidity and mean radiant temperature). Accordingly, the PMV was calculated and it was compared against the ASHRAE Standard 55-2013, which was satisfactory.
Figure 2. Thermal Chair, designed for this study
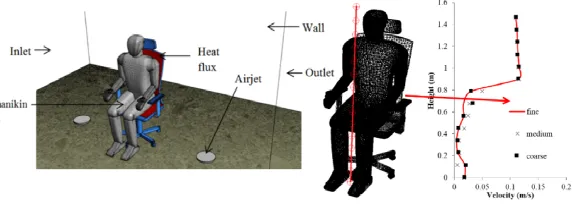
This research will also use the Computational Fluid Dynamic (CFD) tool ANSYS FLUENT to assess the airflow and thermal distribution around a thermal chair with a seated manikin. The basic assumptions for the numerical simulation include a three-dimensional, fully turbulent, and incompressible flow. The CFD code was used with the Finite Volume Method (FVM) approach and the Semi-Implicit Method for Pressure-Linked Equations (SIMPLE) velocity-pressure coupling algorithm with the second order upwind discretisation. The k-epsilon transport model was employed for the air turbulence due to its well-documented performance in predicting indoor airflows. The general
governing equations include the continuity, momentum and energy balance for each individual phase. Figure 3a shows the computational domain created around the thermal chair with a seated manikin. The computational domain
consisted of an inlet (set at 0.1 m/s and 23˚C) on one side of the domain, and an outlet on the opposing boundary
wall with the thermal chair located centrally. Two configurations were simulated; (a) an office chair with heated seat (heat flux: 40 W/m2) and back rest (heat flux: 40 W/m2) and (b) a standard non-heated office chair and 250mm
Figure 3. (a) CFD mesh and boundary conditions (b) grid sensitivity analysis
4. Results and Analysis
[image:4.544.130.417.75.177.2]Figure 4 compares the predicted temperature contours of a side view cross-sectional plane inside the computational domain representing the thermal distribution around the manikin with heated office chair and normal chair. As observed, the thermal chair (Figure 4a) heated the seat and back rest areas between 28-36˚C. While for the case of the space heated with underfloor air jets, the temperature around the manikin range between 24-28˚C as observed in Figure 4b. For both cases, lower temperature near the face area was observed due to higher airflow movement while a higher temperature can be observed near the seat area and thigh region due to lower air movement and constrained space. From the results it was evident that depending on the position of the user (in this case a manikin), the seat and back rest regions had different temperature levels. The results indicated the necessity of separate control systems for the seat and the back which was implemented in the design of the thermal chair.
Figure 4. Temperature distribution around a manikin with (a) the thermal chair (b) a standard non-heated office chair and underfloor air jets
Thermal decision was used in this study (Figure 5), which is a combination of thermal sensation and thermal preference [8]. Overall, 15 respondents had a neutral thermal sensation before using the thermal chair. However, after considering their thermal preference, only 9 people wanted no change in the temperature. Therefore, their thermal decision was “neutral”. The other 6 participants wanted slightly warmer to much warmer thermal conditions. Thus, their thermal decision was not neutral. Overall, the thermal decision of 20 out of 44 respondents (i.e. 45%) was neutral. 5 participants felt slightly cool and wanted to feel slightly warmer, while one participant felt cool and wanted to feel warm. 5 respondents felt slightly warm and wanted to feel slightly cool. After using the chair the number of respondents, who had a neutral thermal sensation dropped to 4, out of which three wanted no change and one respondent wanted to feel slightly cooler. Overall, only 7 out of 44 respondents (i.e. 16%) wanted to feel neutral (thermal decision). One person was feeling slightly cool and wanted to feel slightly warmer. Two respondents felt slightly warm and wanted to feel slightly cooler; and one respondent felt warm and wanted to feel cool. Overall, only 5 out of 44 respondents (i.e. 11%) had a consistent desire to feel neutral (thermal decision), which are highlighted with a cross on Figure 5. 89% of the participants did not want to feel neutral after using the chair, among which 16 respondents (i.e. 36%) did not want any change in the temperature and felt between slightly warm to warm and one person felt hot. 22 out of 44 respondents (i.e. 50%) had no desire to feel neutral neither before nor after using the thermal chair. Overall, 39 out of 44 participants (i.e. 89%) wanted to feel other than neutral at some point during the study (either both before and after using the chair or at one of those two recordings).
Figure 5. Thermal decision of the respondents before and after using the chair: do they want to feel neutral?
Figure 6 demonstrates comfort and satisfaction status of the occupants before and after using the thermal chair. 26 out of 44 respondents (59%) felt comfortable (i.e. voted either comfortable or very comfortable) before using the chair. Out of this number, thermal decision of 16 respondents (62%) was other than neutral, mainly slightly warm. 6 out of 15 participants (14% of the overall numbers) with a neutral thermal sensation and 10 out of 20 respondents (23% of the overall numbers) with a neutral thermal decision were feeling uncomfortable to slightly comfortable. 20 out of 44 participants (44%) felt satisfied (i.e. voted either satisfied or very satisfied) before using the thermal chair. Out of this number, thermal decision of 11 respondents (55%) was other than neutral, mainly slightly warm. 9 participants (20%) with a neutral thermal sensation and 11 respondents (25%) with a neutral thermal decision were feeling dissatisfied to slightly satisfied. After using the thermal chair, the number of comfortable respondents raised to 34 (77%), which is 18% higher than before the application of the thermal chair. Out of the 34 respondents, thermal decision of only 2 respondents (6%) was neutral, the rest (94%) had a thermal decision other than neutral, mainly slightly warm to very hot. 2 out of 4 participants (5% of the overall numbers) with a neutral thermal sensation and 4 out of 7 respondents (9% of the overall numbers) with a neutral thermal decision were feeling uncomfortable to slightly comfortable. 35 out of 44 participants (80%) felt satisfied (i.e. voted either satisfied or very satisfied) after using the thermal chair. The satisfaction level was increased by 34% comparing before to after utilising the thermal chair. Out of this number, thermal decision of 30 respondents (88%) was other than neutral, mainly slightly warm. No participant with a neutral thermal sensation and 3 respondents (7%) with a neutral thermal decision were feeling dissatisfied to slightly satisfied.
Figure 6. Comfort and satisfaction of the participants before and after using the chair
4. Discussion and conclusion
[image:4.544.125.420.337.439.2]Figure 3. (a) CFD mesh and boundary conditions (b) grid sensitivity analysis
4. Results and Analysis
[image:5.544.120.426.75.201.2]Figure 4 compares the predicted temperature contours of a side view cross-sectional plane inside the computational domain representing the thermal distribution around the manikin with heated office chair and normal chair. As observed, the thermal chair (Figure 4a) heated the seat and back rest areas between 28-36˚C. While for the case of the space heated with underfloor air jets, the temperature around the manikin range between 24-28˚C as observed in Figure 4b. For both cases, lower temperature near the face area was observed due to higher airflow movement while a higher temperature can be observed near the seat area and thigh region due to lower air movement and constrained space. From the results it was evident that depending on the position of the user (in this case a manikin), the seat and back rest regions had different temperature levels. The results indicated the necessity of separate control systems for the seat and the back which was implemented in the design of the thermal chair.
Figure 4. Temperature distribution around a manikin with (a) the thermal chair (b) a standard non-heated office chair and underfloor air jets
Thermal decision was used in this study (Figure 5), which is a combination of thermal sensation and thermal preference [8]. Overall, 15 respondents had a neutral thermal sensation before using the thermal chair. However, after considering their thermal preference, only 9 people wanted no change in the temperature. Therefore, their thermal decision was “neutral”. The other 6 participants wanted slightly warmer to much warmer thermal conditions. Thus, their thermal decision was not neutral. Overall, the thermal decision of 20 out of 44 respondents (i.e. 45%) was neutral. 5 participants felt slightly cool and wanted to feel slightly warmer, while one participant felt cool and wanted to feel warm. 5 respondents felt slightly warm and wanted to feel slightly cool. After using the chair the number of respondents, who had a neutral thermal sensation dropped to 4, out of which three wanted no change and one respondent wanted to feel slightly cooler. Overall, only 7 out of 44 respondents (i.e. 16%) wanted to feel neutral (thermal decision). One person was feeling slightly cool and wanted to feel slightly warmer. Two respondents felt slightly warm and wanted to feel slightly cooler; and one respondent felt warm and wanted to feel cool. Overall, only 5 out of 44 respondents (i.e. 11%) had a consistent desire to feel neutral (thermal decision), which are highlighted with a cross on Figure 5. 89% of the participants did not want to feel neutral after using the chair, among which 16 respondents (i.e. 36%) did not want any change in the temperature and felt between slightly warm to warm and one person felt hot. 22 out of 44 respondents (i.e. 50%) had no desire to feel neutral neither before nor after using the thermal chair. Overall, 39 out of 44 participants (i.e. 89%) wanted to feel other than neutral at some point during the study (either both before and after using the chair or at one of those two recordings).
Figure 5. Thermal decision of the respondents before and after using the chair: do they want to feel neutral?
Figure 6 demonstrates comfort and satisfaction status of the occupants before and after using the thermal chair. 26 out of 44 respondents (59%) felt comfortable (i.e. voted either comfortable or very comfortable) before using the chair. Out of this number, thermal decision of 16 respondents (62%) was other than neutral, mainly slightly warm. 6 out of 15 participants (14% of the overall numbers) with a neutral thermal sensation and 10 out of 20 respondents (23% of the overall numbers) with a neutral thermal decision were feeling uncomfortable to slightly comfortable. 20 out of 44 participants (44%) felt satisfied (i.e. voted either satisfied or very satisfied) before using the thermal chair. Out of this number, thermal decision of 11 respondents (55%) was other than neutral, mainly slightly warm. 9 participants (20%) with a neutral thermal sensation and 11 respondents (25%) with a neutral thermal decision were feeling dissatisfied to slightly satisfied. After using the thermal chair, the number of comfortable respondents raised to 34 (77%), which is 18% higher than before the application of the thermal chair. Out of the 34 respondents, thermal decision of only 2 respondents (6%) was neutral, the rest (94%) had a thermal decision other than neutral, mainly slightly warm to very hot. 2 out of 4 participants (5% of the overall numbers) with a neutral thermal sensation and 4 out of 7 respondents (9% of the overall numbers) with a neutral thermal decision were feeling uncomfortable to slightly comfortable. 35 out of 44 participants (80%) felt satisfied (i.e. voted either satisfied or very satisfied) after using the thermal chair. The satisfaction level was increased by 34% comparing before to after utilising the thermal chair. Out of this number, thermal decision of 30 respondents (88%) was other than neutral, mainly slightly warm. No participant with a neutral thermal sensation and 3 respondents (7%) with a neutral thermal decision were feeling dissatisfied to slightly satisfied.
Figure 6. Comfort and satisfaction of the participants before and after using the chair
4. Discussion and conclusion
[image:5.544.128.417.450.582.2]temperature (thermal preference). When they were offered with a thermal chair, 13 of them (87%) used the heating on the back and 14 of them (93%) used the temperature settings of the seat. Also, after using the thermal chair 13 of them (87%) ended up with a thermal sensation warmer than neutral and 11 of them (73%) did not want to feel neutral (thermal decision) after using the chair. 12 of them (80%) felt comfortable and 11 of them (73%) were satisfied with the overall thermal environment. In case the neutral thermal sensation would be the ideal feeling, it would be expected that either they don’t use the thermal chair and leave the temperature control off, and in case they applied temperature control, their comfort and satisfaction levels to drop. However, they reported 20% higher comfort and 33% higher satisfaction levels. Overall, 42% of the respondents, who felt neutral (thermal sensation) before or after using the thermal chair reported to feel between uncomfortable to slightly comfortable and 47% of them reported to feel dissatisfied to slightly satisfied with the overall thermal condition. In addition, 72% of the respondents, who did not feel neutral (thermal sensation) before or after using the thermal chair reported to feel comfortable and 65% reported to be satisfied with the overall thermal condition. The results indicated that a neutral thermal sensation does not guarantee thermal comfort. This finding is in agreement with the findings of Shahzad [8] and Humphreys and Hancock [9]. This study suggests that thermal comfort is dynamic and other thermal sensations than neutral need to be considered as the state of thermal comfort. The use of multi methods to assess thermal comfort is recommended. For instance, the use of thermal preference, thermal decision, comfort and satisfaction of the thermal environment is a more accurate approach to assess thermal comfort. This study questions the findings of any research that solely relies on thermal sensation and particularly on the neutral thermal sensation to assess thermal comfort of the occupants. Finally, the results emphasised the importance of the application of numerical modelling in evaluating the thermal performance of the chair.
Acknowledgements
The authors gratefully acknowledge the contribution of the occupants of the case study building. References
[1] Zhang H, Arens E, Pasut W. Air temperature thresholds for indoor comfort and perceived air quality. Build Res Inf. 2011 Apr 1;39(2):134-44. [2] Kwong QJ, Adam NM, Sahari BB. Thermal comfort assessment and potential for energy efficiency enhancement in modern tropical
buildings: A review. Energy and Buildings. 2014 Jan 31;68:547-57.
[3] Voelcker A. The selective environment-An approach to environmentally responsive architecture. [4] Handbook AS. ASHRAE handbook–fundamentals. Atlanta, GA. 2009.
[5] McCartney KJ, Nicol JF. Developing an adaptive control algorithm for Europe. Energy and buildings. 2002 Jul 31;34(6):623-35. [6] Hawkes, D. The Selective Environment; An approach to environmentally responsive architecture, London, Spon Press. 2002.
[7] Brengelmann, G.L. and Savage, M.V., (1997). Temperature regulation in the neutral zone. New York Academy of Sciences, 813(1), pp.39-50. [8] Shahzad SS. Individual thermal control in the workplace: cellular vs open plan offices: Norwegian and British case studies. 2014. University
of Edinburgh.
[9] Humphreys MA, Hancock M. Do people like to feel ‘neutral’?: Exploring the variation of the desired thermal sensation on the ASHRAE scale. Energy and Buildings. 2007 Jul 31;39(7):867-74.
[10] Liu, J., Yao, R., Wang, J. & Li, B. 2012. Occupants' Behavioural Adaptation in Workplaces with Non-Central Heating and Cooling Systems. Applied Thermal Engineering, 35, 40-54.
[11] Cigler, J., Privara, S., Vana, Z., Zacekova, E. & Ferkl, L. 2012. Optimization of Predicted Mean Vote Index within Model Predictive Control Framework: Computationally Tractable Solution. Energy and Building, 52, 39-49.
[12] Van Marken Lightenbelt, W. and Kingma, B. R. 2013. Building and Occupant Energetics. Architectural Science Review, 56, 48-53. [13] Schellen, L., Loonans, M., DE Wit, M. & Van Marken Lightenbelt, W. 2013. The Influence of Different Cooling Techniques and Gender on
Thermal Perception. Building Research and Information, 41, 330-341.
[14] Shahzad, S., Brennan, J., Theodossopoulos, D., Hughes, B. and Calautit, J.K., 2017. Energy and comfort in contemporary open plan and traditional personal offices. Applied Energy, 185, pp.1542-1555.
[15] Kogawa, Y., Nobe, T. and Onga, A., 2007. Practical investigation of cool chair in warm offices. Proceedings of Clima’07.
[16] Watanabe, S., Shimomura, T. and Miyazaki, H., 2009. Thermal evaluation of a chair with fans as an individually controlled system. Building and Environment, 44(7), pp.1392-1398.
[17] Zhao, P., Peffer, T., Narayanamurthy, R., Fierro, G., Raftery, P., Kaam, S. and Kim, J., 2016. Getting into the zone: how the internet of things can improve energy efficiency and demand response in a commercial building.
[18] Parkhurst, G., Parnaby, R. 2008. Growth in Mobile Air-Conditioning. BRI-36.
[19] Zhang YF, Wyon DP, Fang L, Melikov AK. 2007. The influence of heated or cooled seats. Ergonomics, 50:586-600.
[20] Ning Mao, Dongmei Pan, Zhao Li, Yingjie Xu, Mengjie Song, Shiming Deng, A numerical study on influences of building envelope heat gain on operating performances of a bed-based task/ambient air conditioning (TAC) system, Applied Energy, Volume 192, 15 April 2017. [21] Nicol, J. F. & Humphreys, M. A. 1973. Thermal comfort as part of a self-regulating system. Builiding Research & Information, 1, 174-179. [22] de Dear, R. 1994. Outdoor Climatic Influences on Indoor Thermal Comfort Requirements. In: OSELAND, N. A. & HUMPHREYS, M. A. (eds.)
Thermal Comfort: Past, Present and Future. Watford: Building Research Establishment.
![Table 1: The ASHRAE seven point scales [4]](https://thumb-us.123doks.com/thumbv2/123dok_us/1489152.101586/2.544.136.411.572.668/table-ashrae-seven-point-scales.webp)