1
2
Wells Turbine for Wave Energy Conversion:
A Review
Ahmed S. Shehata, Qing Xiao, Khalid M. Saqr, Day Alexander
1
Wells Turbine for Wave Energy Conversion: A Review
12
Ahmed S. Shehata1, 2*, Qing Xiao 1, Khalid M. Saqr3, Day Alexander 1
3
1) Department of Naval Architecture, Ocean and Marine Engineering, University of Strathclyde, Glasgow 4
G4 0LZ, UK 5
2) Marine Engineering Department, College of Engineering and Technology, Arab Academy for Science 6
Technology and Maritime Transport, P.O. 1029, AbuQir, Alexandria, Egypt 7
3) Mechanical Engineering Department, College of Engineering and Technology, Arab Academy for 8
Science Technology and Maritime Transport, P.O. 1029, AbuQir, Alexandria, Egypt 9
SUMMARY
10
In the past twenty years, the use of wave energy systems has significantly increased, generally
11
depending on the oscillating water column (OWC) concept. Wells turbine is one of the most
12
efficient OWC technologies. This article provides an updated and a comprehensive account of
13
the state of the art research on Wells turbine. Hence, it draws a roadmap for the contemporary
14
challenges which may hinder future reliance on such systems in the renewable energy sector. In
15
particular, the article is concerned with the research directions and methodologies which aim at
16
enhancing the performance and efficiency of Wells turbine. The article also provides a thorough
17
discussion of the use of computational fluid dynamics (CFD) for performance modeling and
18
design optimization of Wells turbine. It is found that a numerical model using the CFD code can
19
be employed successfully to calculate the performance characteristics of W-T as well as other
20
experimental and analytical methods. The increase of research papers about CFD, especially in
21
the last five years, indicates that there is a trend that considerably depends on the CFD method.
22 23
Keywords: Wells turbine; CFD; Wave energy; Oscillating water column.
24 25
*Corresponding Author:Ahmed S. Shehata
26
E-mail address: ahmed.mohamed-ahmed-shehata@strath.ac.uk 27
2
Nomenclature
A The total blade area = (z c b), m2
𝑅𝑚 Mean rotor radius =𝑅𝑡+𝑅ℎ
2 , m
𝐴𝑟 Rotor area =π 𝑅𝑚2 , m2 𝑅
𝑟 Rotor radius , m a Margin distance for the endplate , m 𝑅𝑡 Rotor radius at tip , m b Blade Span , m T Time period =1
𝑓 ⁄ , sec
c Blade chord , m t Rotor blade thickness , m
𝐶𝐷 Drag force coefficient =1 𝐷 2𝜌(𝑉𝑟)2𝐴
𝑇𝐿 Loading torque N m
𝐶𝐿 Lift force coefficient =1 𝐿 2 𝜌(𝑉𝑟)2 𝐴
TSR Tip speed ratio =𝜔𝑅𝑚
𝑉𝐴𝑚
CP Power coefficient 𝑉
𝐴 Axial velocity = 𝑉𝐴𝑚sin (2𝜋𝑡𝑇 ) , m/s
𝐶𝑇 Torque coefficient 𝑉𝐴𝑚 Maximum value of axial velocity, m/s
D Drag Force ,N 𝑉𝑟 Resultant air velocity = √𝑉
𝐴2(𝑡) + 𝜔2(𝑡)𝑅𝑚2 , m/s
𝐷𝑟 Rotor diameter , m 𝑊∗ Output power coefficient
𝑓 Wave frequency , Hz 𝑋𝑖 Inertia coefficient
FA Axial Force = 12𝜌𝑉𝑟2 𝐴 𝐶𝐴 , N 𝑋𝐿 Loading torque coefficient =𝜌𝜋𝑅𝑇𝐿
𝑚 3𝑉
𝐴𝑚2
Ft Tangential Force = 12𝜌𝑉𝑟2 𝐴 𝐶𝑡, N Z Number of blades
g Leading edge offsetting of a blade from an
a axis , m
α Angle of attack- the angle between the chord line and the direction of the fluid velocity ,degree I Moment of inertia , kg m2 η Mean turbine efficiency
K Non-dimensional period 𝝆 Air specific density , kg/m3
L lift Force , N σ Turbine solidity = Z C 2 π Rm
Δp Pressure difference across
the turbine = FA
Area,N/m2
𝝓 Flow coefficient = 𝑉𝐴𝑚
𝜔𝑎𝑣𝑟∗𝑅𝑚
Q Flow rate through the rotor area ,m3/sec 𝜔 Rotor angular speed , rad/sec
𝑅ℎ Rotor radius at hub , m 𝜔̅∗ Non-dimensional angular velocity under irregular flow condition
List of Abbreviations
AOP An Optimized Profile
3 CFD Computational Fluid Dynamics
NACA National Advisory Committee for Aeronautics
OWC Oscillating Water Column
TC Tip Clearance W-T Wells Turbine
1
1. Introduction
2Generating renewable energy has been increasing considerably in the past decade,
3
achieving almost 22% of the global energy production in 2013, compared to 14% in 2005 [1].
4
The ocean is a potential goldmine for renewable energy generation for several reasons, most
5
important of which is that, unlike wind and solar power, power from ocean waves continues to
6
be produced around the clock [2]. In addition, wave energy varies with the square of wave
7
height, whereas wind energy varies with the cube of air speed. This results in a much higher
8
average power production from waves per unit of time [3]. Moreover, marine waves travel great
9
distances without significant energy losses, so they act as a renewable and an efficient energy
10
transport mechanism across thousands of kilometers. Such renewable energy can be produced
11
through different devices, which produce sufficient work to drive electrical generators that
12
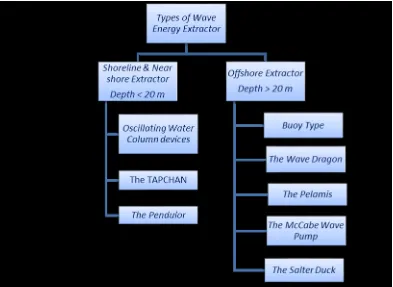
convert such work into electricity.Wave energy extractors can be classified according to the
13
water depth at which they operate. This classification is presented in Figure 1. Another
14
classification based mostly on working principle is presented in Table 1.
4 1
Figure 1 Types of wave energy extractors with respect to water depth
2
Most of fixed-structure OWC systems are located on the shoreline or near the shore.
3
Shoreline devices are characterized by relatively easier maintenance and installation, and they do
4
not require deep water moorings and long underwater electrical cables. The floating OWC
5
devices are slack-moored to the sea bed and so are largely free to oscillate, enhancing the wave
6
energy absorption if the device is properly designed for that purpose [4].
7
Offshore devices are basically oscillating bodies, either floating or fully submerged. They
8
take advantage of the most powerful wave systems available in deep water. Offshore wave
9
energy converters are in general more complex compared to fixed-structure OWC. This, together
10
with additional problems related to mooring and access for maintenance and the need of long
11
underwater electrical cables, has hindered the converters’ development, and only recently have
12
some systems reached, or come close to, the full-scale demonstration stage [5].
13
Overtopping systems are a different way of converting wave energy to capture the water
14
that is close to the wave crest and introduce it, by over spilling, into a reservoir where it is stored
15
at a level higher than the average free-surface level of the surrounding sea [6, 7]. The potential
16
energy of the stored water is converted into useful energy through more or less conventional low
17
head hydraulic turbines. The hydrodynamics of overtopping devices is strongly nonlinear, and,
5
unlike the cases of oscillating body and OWC wave energy converters, cannot be interpreted by
1
linear water wave theory.
2
Table 1 Types of wave energy extractorsbased on working principle [6].
3
System Energy extractor Structure types Example Remarks
Oscillating
water column Air turbine
Fixed structure
Pico
Isolated LIMPET
Sakata
Breakwater Mutriku
Floating
Mighty Whale
--- Sperboy
Oceanlinx
Oscillating bodies
Hydraulic motor, hydraulic turbine and
linear electrical generator
Floating
AquaBuoy
Essentially translation IPS Buoy
FO3 Wavebob PowerBuoy
Pelamis
Essentially rotation PS Frog
SEAREV
Submerged
AWS Essentially translation WaveRoller Rotation with bottom
hinged Oyster
Overtopping Low head hydraulic turbine Fixed structure
TAPCHAN Shoreline
SSG Breakwater
Floating Wave Dragon --- 4
OWC energy converters operate much like a wind turbine via the principle of wave
5
induced air pressurization [8-10]. A containment housing (air chamber) is placed above the
6
water, allowing the passage of waves to change the water level. The frequently rising and falling
7
water level increases and decreases the air pressure respectively within the housing. With regard
6
to this notion, a turbine could be placed on top of the housing through which air may pass. Air
1
would flow into the housing during a wave trough and out of the housing during a wave crest.
2
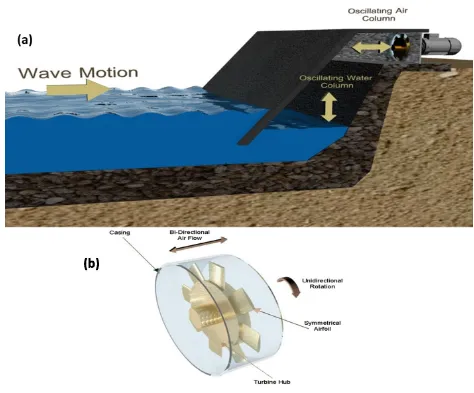
Such operation principle is illustrated in Figure 2 (a). Because of this bidirectional air flow, the
3
turbine must be designed to rotate only in one direction, regardless of the air flow direction [6, 7,
4
11].
5
Finding an efficient and an economical means of converting oscillating flow energy to
6
unidirectional rotary motion for driving electrical generators is the major challenge facing OWC
7
systems. A novel solution for such a challenge is the W-T [12-16], a version of the axial-flow
8
turbine. W-T is named after Professor Alan Wells of the Queen’s University of Belfast in the
9
80’s. It is unique as it contains a rotor with untwisted airfoil blades of symmetrical cross section,
10
usually belonging to the symmetrical NACA four digit series[17-20], see Figure 2 (b). A typical
11
W-T consists of a rotor with about eight airfoil sectioned blades, installed on the hub with their
12
chord lines lying in the plane of rotation. Once the blades have attained design speed, the turbine
13
produces with a fair efficiency a time-averaged positive power output from the oscillating air
14
flow [4, 21].
15
The W-T is one of the simplest and probably the most economical turbines for wave
16
energy conversion. It does not require rectifying air valves and can extract power at a low
17
airflow rate, when other turbines would be inefficient. Therefore, it has been extensively
18
researched and developed in many countries. Most self-rectifying air turbines for wave energy
19
conversion proposed and tested so far are axial-flow machines of two basic types: the W-T and
20
the impulse turbine. The impulse turbine was patented by I. A. Babintsev in 1975 [22]. Its rotor
21
is basically identical to the rotor of a conventional single-stage steam turbine of axial-flow
22
impulse type. Since the turbine is required to be self-rectifying, there are two rows of guide
23
vanes, placed symmetrically on both sides of the rotor, instead of a single row. These two rows
24
of guide vanes are the reflection of each other, with respect to a plane through the rotor disc
[23-25
25]. Therefore, it is more complex and more costly than W-T. The efficiency of W-T is higher
26
than that of the impulse turbine when the flow coefficient is less than the stall point. But after the
27
stall point of W-T, the efficiency of impulse turbine is considerably higher than that of W-T.
28
However, the peak efficiencies are almost the same [26].
29
It is worth mentioning that the W-T (with or without guide vanes) and the contra-rotating
30
W-T are approximately a linear turbine (i.e., the pressure drop is approximately proportional to
7
the flow rate at constant rotational speed). Other turbines behave quite differently (like impulse
1
turbines) [18].The principle of W-T is explained in details later in this section.
2
[image:8.612.67.541.114.507.2]3
Figure 2 OWC energy converters (a) An illustration of the principle of operation of OWC system, where the
4
wave motion is used to drive a turbine through the oscillation of air column[27] (b) Typical structure of W-T
5
rotor[27].
6 7
1.1. Objective, methodology and scope
8 9
The main objective of this review is to provide an updated account, as comprehensive as
10
possible, of the state of the art research on W-T. This article also intends to provide a
self-11
contained reference for the broadest readership possible within the renewable energy community.
12
The authors have studied all the available research publications related to W-T and conducted a
13
thorough categorization exercise to establish a roadmap for the research directions in the topic.
8
This roadmap is based on the W-T system components on the one hand, and on the research
1
approach and methodology of each reference work on the other hand. Therefore, section 1 is
2
dedicated to explain the operation principle, cycle and energy analysis of W-T. A review of
3
existing W-T projects is presented in section 2. Sections 3 and 4 review and discuss the design
4
parameters of W-T and the works done to improve their performance through the optimization
5
and modification of such parameters. Since a significant percentage of research utilized CFD to
6
simulate W-T, section 5 is dedicated to review and discuss these efforts. In section 5, CFD
7
research works are categorized according to model complexity and physical assumptions. Such
8
categorization, accompanied by a critical discussion of modelling approaches, is intended to
9
highlight the state of the art knowledge for the multidimensional modelling of W-T. Section 6
10
provides a critical discussion and draws a research roadmap in conclusion of the article.
11
1.2. Operation principle of W-T
12
The characteristic feature of W-T is that oscillating air flow produces a single direction
13
rotation of the rotor without the use of a rectifying valve. It is usually characterized by four digit
14
double zero NACA profiles [28-30], where the shape of the NACA four Digit profiles is
15
determined by three parameters: the camber (first digit), the position of the camber (second digit)
16
and the thickness in percent of the chord (last two digits). Hence, profiles without a camber are
17
symmetrical (NACA 00XX). According to the classical airfoil theory, an airfoil set at in a fluid
18
flow generates L, normal to the free stream. The airfoil also experiences D, in the direction of the
19
free stream, see Figure 3 (a) and (b). For real fluids, Lift and Drag increase with the increase in,
20
however only up to a certain value of beyond which the flow around the airfoil separates. The
21
angle of incidence at which the flow separates from the surface of the airfoil is known as the stall
22
angle [31], see Figure 3 (c). Further increase in beyond the stall angle results in a decrease in
23
lift and a significant increase in drag [16, 21, 29]. Because the flow between adjacent blades in
24
cylindrical or liner series of blades (cascade) can be quite different to that over isolated airfoils,
25
the cascade lift and drag are different to those of isolated airfoil due to the interference that each
26
blade has on the flow field around its neighbors[32-34].
9 1
Figure 3 Aerodynamic forces (a) compression stages (b) suction stages (c) Lift and drag coefficient variation
2
with angle of attack [29].
3 4
1.3. Operation cycle
5
The operation cycle of W-T is classified into two stages according to the action of the
6
OWC. First, the Compression Stage, in which the water level rises inside the housing, see Figure
7
3 (a). The resultant aerodynamic force 𝐹𝑅 due to lift and drag forces is given by 8
𝐹𝑅 = √𝐿2+ 𝐷2 (1)
This force can be decomposed in two components into axial and tangential directions in terms of
9
lift and drag components as:
10
𝐹𝐴 = 𝐿 𝑐𝑜𝑠 + 𝐷 𝑠𝑖𝑛 (2)
and
1
𝐹𝑡 = 𝐿 𝑠𝑖𝑛 − 𝐷 cos 𝛼 (3)
where FA and Ft are the axial and tangential forces, respectively. 2
Second, the Suction Stage, in which the water level drops, sucking air into the duct, and a
3
similar velocity and force analysis can be described as shown in Figure 3 (b). A comparison
4
between Figures 3(a) and 3(b) shows that the tangential force maintains the same direction
5
during the two stages, while the axial force reverses its direction. For a symmetrical airfoil
6
section, the direction of tangential force 𝐹𝑡 remains the same for both positive and negative
7
values of. Such airfoil blades are set around an axis of rotation. The rotor rotates in the
8
direction of 𝐹𝑡 or upward and downward strokes, regardless of the direction of airflow.
9
The vast majority of researchers assume that the force analysis resulting from the flow
10
through the rotor can be reduced to a two-dimensional analysis. This assumption is based on the
11
radial equilibrium theory [35, 36] where the force resulting from the radial velocity component is
12
assumed to be negligible everywhere in the flow field except within the blade rows [16].
13
Nevertheless, there have been some studies citing the relevance of the radial force components.
14
In such studies, it was assumed that the force resulting from the radial velocity component was
15
far from being negligible [37-39]. Also, Falcao et al. reported that a fully three-dimensional
16
force analysis should be performed, or at least corrections to two-dimensional flow results should
17
be introduced. In addition, it could be assumed that the radial force component is negligible, if
18
the rotor blade work per unit mass is constant along the span or, equivalently, if the velocity
19
circulation about the blades does not vary along the radial coordinate. However, such
20
conditions, although very common, are not generally satisfied in self-rectifying turbines for
21
OWC applications [18].
22
From the electrical power engineering point of view, the W-T system can be seen as an
23
AC/AC converter, which converts a mechanical power signal with variable force and frequency
24
into an electrical power signal with constant voltage and frequency [40]. W-T converts the
bi-25
directional airflow into mechanical energy in the form of unidirectional shaft power, which is in
26
turn used to move the wound rotor induction machine. The wound rotor machine controlled by
27
rotor resistance has several advantages, such as high line power factor, absence of line current
28
harmonics and smooth and wide range of speed control. As the external resistance is increased,
11
the torque/slip curve becomes flatter, giving less speed, until the speed becomes zero at high
1
resistance [41].
2
The squirrel cage induction generator is normally preferred since it is cheap, small,
3
rugged, maintenance-free, and does not require separate excitation and synchronization to the
4
grid. It works as a motor when running below synchronous speed, and as a generator above
5
synchronous speed. However, the use of double-fed induction generator has a huge potential in
6
the development of distributed renewable energy sources. The double-fed induction generator is
7
essentially an asynchronous machine, but instead of the rotor windings being shorted (as in a
8
squirrel-cage induction machine), it is arranged to allow an AC current to be injected into the
9
rotor, via the power converter. By varying the phase and frequency of the rotor excitation, it is
10
possible to optimize the energy conversion. The frequency converter only has to process the
11
generator’s slip power fraction, which is generally no more than 30% of the generator rated
12
power. This reduced rating for the frequency converter implies an important cost saving,
13
compared to a fully rated converter [41, 42].
14
1.4. Evaluation of techno-economic aspects
15
The utilization of the sea wave was rarely considered on a practical scale prior to 1973.
16
However, a great deal of research has been conducted since 1973, the year of the so-called oil
17
crisis [43]. In recent years, interest has revived, particularly in Japan, Britain and Scandinavia, so
18
the research and small-scale development have progressed to the stage of commercial
19
construction for power extraction. As with all renewable energy supplies, the scale of operation
20
has to be determined, and present trends support moderate power generation levels at about 1
21
MW from modular devices about 50 m wide across the wave front. Such devices should be
22
economic to replace diesel-generated electricity, especially on islands [7].
23
The predicted costs of wave power, in particular, have been falling against those of fossil
24
fuels. The World Energy Council estimates that electricity from “arrays of mature devices
25
located in promising wave energy sites” could cost from 5 cents to 10 cents per kilowatt-hour
26
(kWh). In fact, the Limpet, an on-shore oscillating water column device, began commercially
27
generating electricity in Scotland in late 2000. At the time, the expected cost of Limpet’s
28
electricity was 7 cents to 8 cents per kWh [44]. And according to the Electric Power Research
12
Institute (EPRI), the cost of ocean electricity production will drop significantly as the volume of
1
production increases, as usually happens in the development and commercialization of any new
2
technology. The electricity price produced from wave energy is still high but is forecasted to
3
decrease with the development of the technology. This can be speeded up with initial financial
4
and market support as it has been done in the past for preceding technologies such as wind,
5
nuclear energy and oil.
6
Energy production costs are a major drive for the development of wave power – the
7
lower they are, the faster the market grows. There are several levers to bring down costs of
8
energy production systematically [45-48], including, in order:
9
1- Reliability of the equipment: The degree of reliability of a wave power concept largely drives
10
project risk and thus the rate at which an investor expects a new investment to earn. Therefore,
11
reliability is an important key for the customer.
12
2- Efficiency of the machine: Costs per kWh are, in simple terms, discounted cash-outflows for
13
capital investments, operations and maintenance, divided by discounted number of kWhs
14
produced. Hence, an increase of energy output works on the total investment – not only the
15
turbine – and can bring costs down considerably.
16
3- Reduction of capital investment costs: The largest cost item on an OWC plant is the collector.
17
Bringing this cost down has a significant influence on energy production costs. Apart from
18
creative engineering, the best idea is to avoid spending large sums on the collector by sharing it
19
with other applications. This is how the idea of the active breakwater application was born.
20
For coastal protection, large concrete structures are built in order to protect harbours from
21
waves. If these structures are modified so that OWCs can be included in the front wall, costs can
22
be shared and, according to laboratory measurements, loads on the walls can be significantly
23
reduced. For a caisson type breakwater, an empty concrete structure with a rectangular structure
24
of concrete enforcement walls is cast. In this state, the structures are floating and can be towed
25
into position by a ship. The empty chambers are then filled with stones or sand so that the
26
structure can sink and sit rigidly on the seabed. If the front chambers of the wall are only partly
27
filled and openings under water are included, an OWC chamber can be formed [49, 50]. The
W-28
T is placed into the airflow. In this configuration, the breakwater is converted into an active
13
breakwater, which not only protects the coast but also produces energy. Harbours usually require
1
a high level of electrical energy and therefore offer good opportunities for grid connection. In
2
effect, a fully integrated engineering development approach would appropriately design a
3
shoreline OWC in order to find the best compromise between cost and performance. Following
4
this path would lead to differences between a W-T configuration, notably in terms of the OWC
5
design and choice of location [51]. However, compared to W-T, other types of wave energy
6
converters are more expensive and have more complex designs.
7 8
2. Existing W-T stations
9Since the 1970s, there have been a number of wave energy projects based on W-T. Table
10
2 provides a summary of all reported W-T projects. The LIMPET [52-57] and Pico projects
[58-11
63] are shoreline mounted systems. The OSPREY [64] is an example of near shore W-T projects
12
with the Trivandrum [47, 48] and Sakata projects [45, 46] are examples of breakwater devices. In
13
addition, the Mighty Whale is an offshore floating type [65]. These projects are necessary to the
14
current understanding and improvement of W-T technology and in many cases serve as test beds
15
and data collection tools.
[image:14.612.30.585.441.711.2]16
Table 2 Summary of the existing W-T projects
17
Devices Location building Output No. of
turbines Diameter Type of turbine
Sanze shoreline gully Gully ,Japan 1984 40 kW 2 -NA- -NA-
Kvaerner-Brug, Norwegian OWC Toftestallen, Norway 1985 500 kW 1 -NA- -NA-
Sakata, Japan Sakata, Japan 1989 60 kW 1 1.337 m Monoplane with
guide vanes
Prototype OWC device[66] Islay,Scotland 1991 75 kW 2 1.2 m Biplane
Vizhinjam OWC Trivandrum, India 1991 150 kW 1 2 m Monoplane
OSPREY Dounreay, Scotland 1995 2 MW 4 3 m Contra-rotating
Mighty Whale Japan 1998 120 kW 1 1.7 m Monoplane with
guide vanes
The Pico Power Plant Azores, Portugal 1999 400 kW 1 2.3 m Monoplane with
guide vanes
14
kW
Shanwei, Guangdong, China Shanwei, Guangdong, China 2001 100 kW -NA- -NA- -NA-
Mutriku Wave Energy Plant[49, 50] Basque Country, Spain 2009 296 kW 16 1.25 m Biplane
Several studies have investigated the overall performance of W-T in existing shoreline
1
installations with the aim of improving its efficiency. For example, the W-T prototype installed
2
in Islay, Scotland is investigated in [67, 68]. The Vizhinjam OWC was installed in Trivandrum,
3
India in 1991 and is investigated in [69]. Numerical simulation of [69] shows an increase of
4
turbine output power for a numerical module with control mechanism (by varying the rotor
5
resistance of the induction machine) as compared to an uncontrolled one, for the same variation
6
of differential pressure (aerodynamic input, N/m2). The performance of the contra-rotating W-T
7
installed in the LIMPET is compared to the predicted performance from theoretical analysis and
8
model tests in [70]. It is found that a contra-rotating W-T has a lower efficiency than a biplane or
9
monoplane W-T with guide vanes. In addition, a contra-rotating W-T requires an additional
10
generator, or a gearbox.
11
3. Performance parameters of W-T
12There are several factors that influence the design, hence performance, of W-T [6, 16,
13
71]. The optimization and improvement of such parameters aim mainly at overcoming the
14
existing disadvantages of the system. Typical W-T systems show several well-known drawbacks:
15
low tangential force, leading to low power output from the turbine; high undesired axial force; a
16
relatively low aerodynamic efficiency; and a limited range of operation due to stall. This section
17
of the article aims at reviewing the efforts done to overcome such disadvantages and improve the
18
performance by controlling the design parameters.
19 20
3.1. Guide vane
21
In a number of previous studies, it was concluded that the delay of stall onset
22
contributes to improving W-T performance. This delay can be achieved by setting guide
23
vanes on the rotor’s hub as illustrated in Figure 4.
15 1
Figure 4 Illustration of guide vanes installed with W-T rotor
2
The variables that affect the aerodynamic performance of a W-T are discussed in [16, 71],
3
and it was found that the swirl losses at the turbine exit can be reduced by the use of guide vanes.
4
Also, a multi-plane turbine without guide vanes was less efficient (approximately 20%) than the
5
one with guide vanes. By testing a W-T model under steady flow conditions, and using the
6
computer simulation (quasi-steady analysis), a comparison between W-Ts having 2D guide
7
vanes and 3D guide vanes is conducted [72, 73]. It showed that the 3D case has superior
8
characteristics in the running and starting conditions. The results of mathematical simulations
9
considering several aerodynamic designs of the W-T are shown in Table 3 [74]. Different guide
10
vanes designs were compared and investigated analytically [75], taking into account the turbine
11
starting characteristics and efficiency in irregular wave conditions. Table 4 shows the best two
12
designs, but for the total performance, R7N08N65 G15N11S40 is recommended. R7N08N65 has
13
rectangular blades, a solidity of 0.7, normal blades, 8 blades, and a TC (the gap between the
14
casing and blade tip) of 0.65mm. The G15N11S40 has 1.5 solidity, 11 blades, and the axial
15
spacing between rotor and guide vane =40mm.
16
Table 3 A summary of the performance data for the different turbines, [74]
17
NACA0015 HSIM 15-262123-1576 [76]
Max. Efficiency Without guide vanes with guide vanes Without guide vanes with guide vanes
[image:16.612.100.547.668.720.2]16 1
Table 4 Maximum efficiency with minimum torque and starting torque coefficients [75]
2
Turbine Profile Maximum efficiency minimum torque coefficient
starting torque coefficient
R7N08N65 G15N11S40 44.8% 0.41 0.49
R7N08F65 G15N21S31 47.4% 0.08 0.33
3
3.2. Hysteretic behavior
4
As shown in Figure 5, due to the reciprocating flow, the performance of the W-T
5
has a hysteretic loop in which the values of 𝐶𝐴 and 𝐶𝑇 in the accelerating flow are
6
smaller than those in the decelerating flow. Hysteresis characteristics are produced by the
7
pressure difference induced by the different behavior of wakes between an accelerating
8
flow and a decelerating flow in the same angle of attack, as illustrated in Figure 5.
9
A considerable number of parametric studies, using experimental and numerical
10
approaches, are presented in [16]. It is found that the hysteresis effects are caused by
11
asymmetry in the boundary-layer development on the blade surface and oscillating
12
motion of the wake, the extent of which can be appreciable at low Reynolds numbers.
13
Hysteresis effects are found to be directly proportional to the turbine solidity [16] and
14
blade thickness [77] and insensitive to blade AR and surface roughness [77]. These
15
effects can be smaller on large-scale turbines where the boundary layer on the blades is
16
turbulent and relatively thin. A CFD model of W-T is used to investigate the hysteretic
17
behavior in [78]. The blade angle of attack is also found to be directly proportional to the
18
hysteretic effects. In order to investigate the mechanism of the hysteretic behavior of
W-19
T and also the effect of solidity, setting angles and blade thickness on the hysteretic
20
behavior of W-T (where the setting angle is defined as an angle between the blade chord
21
line and the rotational direction of rotor, 𝜔 𝑅𝑚), CFD simulations are conducted for the 22
flow field around a blade of a W-T by [79, 80]. It is found that the mechanism to change
23
the vortex intensity in the wake can be explained according to the vortex theorem. The
24
vortex is intensified by the clockwise trailing shed vortices in the accelerating flow
25
process, while it is suppressed by the counterclockwise vortices in the decelerating flow
17
process. The hysteretic characteristics in sinusoidal flow are experimentally assessed in
1
four kinds of turbines (NACA0020; NACA0015; CA9; and HSIM 15-262123-1576) in
2
[81, 82]. It is found that all turbines have similar hysteretic loops; however, the hysteresis
3
characteristics of the W-T are less sensitive to the blade profile than to solidity, setting
4
angles and blade thickness.
5 6 7
[image:18.612.89.511.213.448.2]8
Figure 5 Typical Hysteresis loop obtained in the W-T for one-half cycle of the sinusoidal flow in the unstalled
9
condition. Graph reproduced after [4]
10
11
Numerical simulations are conducted for the hysteretic behavior of monoplane
12
and biplane W-Ts in [83-85]. It is found that for the monoplane W-T, the hysteretic loop
13
is opposite to the well-known dynamic stall [86-91] of an airfoil. The hysteretic behavior
14
is associated with a stream wise vertical flow appearing near the suction surface. For the
15
biplane W-T, the hysteretic behavior is similar to that of the monoplane at lower attack
16
angles. However, the hysteretic loop similar to the dynamic stall is observed at higher
17
attack angles, which is attributed to unsteady flow separation near the hub and the trailing
18
edge of the suction surface of the upstream blade. The magnitude of hysteretic loop is
19
further decreased in the biplane turbine with staggered blades than the one without
20
stagger.
18
The effects of blade profile and rotor solidity on hysteretic behavior of W-T
1
operating under bi-directional airflow have been experimentally studied in [92, 93]. It is
2
shown that the size of hysteretic loop of pressure coefficient greatly decreases with the
3
reduction in rotor solidity. Such characteristics are less sensitive to blade profile, as
4
shown in [81, 82]. However, the effects of the TC region cause a reduction of the
5
maximum torque coefficient and a decrease of the hysteretic behavior[94]. The effects of
6
unsteady flow conditions on the performance of a monoplane W-T without guide vanes
7
during a field experiment on a OWC device are described in [95, 96]. The torque
8
coefficient shows a hysteretic mechanism characterized by a counter-clock-wise loop that
9
appears with high frequency oscillations. A dynamic stall phenomenon appears with
10
oscillations of very large amplitude, independently from the frequency.
11 12
3.3. Multi plane W-T
13
For W-T systems that operate at high pressure values, a multi plane (usually tow
14
stage) turbine configuration can be used. Such a concept avoids the use of guide vanes,
15
and therefore the turbine would require less maintenance and repairs[16]. The biplane
W-16
T, see Figure 6 (a) and the contra-rotating W-T see, Figure 6 (b) are investigated to
17
achieve this purpose.
19 1
Figure 6Multi plane W-T (a) bi-planes W-T (b) contra-rotating W-T
2 3
The performance of a biplane W-T is dependent on the gap between the planes, as
4
shown in [16]. A gap-to-chord ratio between the planes of 1.0 is recommended for the
5
design of biplane W-T in order to achieve high efficiency in a limited space. A
multi-6
plane turbine without guide vanes is less efficient than that with guide vanes but is
20
relatively simple to design. A high solidity mono plane or a biplane W-T is a simple
1
configuration but has large kinetic energy losses due to swirl at the exit. Experimental
2
results in [97] show that the use of two twin rotors rotating in the opposite direction to
3
each other is an efficient means of recovering the swirl kinetic energy without the use of
4
guide vanes.
5
The overall performance of several types of W-T design has been studied in [98]
6
and by using a semi-empirical method for predicting the performance in [99]. Similar
7
comparisons are undertaken using experimental measurement in [100]. Monoplane,
8
biplane, monoplane with guide vane and contra-rotating turbines viscous losses on the
9
turbine rotors constitute the largest part of the losses. Therefore, the recovery methods
10
have specific operational ranges. The contra-rotating turbine has an operational range that
11
is similar to that of the monoplane turbine with guide vanes and achieves similar peak
12
efficiency. However, the flow performs better than later in the post-stall region. The value
13
of peak efficiency of contra-rotating turbine is higher than that of monoplane turbine
14
without guide vane by 12% and by 9% for biplane turbine. It is also evident in [100] that
15
the swirl component determines which rotor of a multi-plane turbine will stall first. On
16
quite the contrary, investigated in [70] are use theoretical analysis and model tests to the
17
predicted performance of the contra-rotating W-T installed in the LIMPET, and it is
18
found that a contra-rotating W-T has a lower efficiency than that of a biplane or
19
monoplane W-T with guide vanes. In addition, a contra-rotating W-T requires an
20
additional generator, or a gearbox, to reverse the direction of rotation of one rotor.
21
Two-stage W-Ts with symmetric and non-symmetric airfoils have been
22
investigated in [101]. Numerical optimization procedure has been carried out to optimize
23
the performance of the turbine as a function of the non-dimensional gap between the two
24
rotors. It leads to an optimal value of the non-dimensional gap near 0.85 when
25
simultaneously considering the request of maximum tangential force coefficient, of
26
maximum efficiency for the prescribed operating range (angle of incidence = 8 to 14
27
degree) and the needed size of the system.
28
Detailed numerical analysis of biplane W-T performance has been performed in
29
[102]. The downstream rotor curbs the turbine during start up and therefore delays its
30
start up. Also, it produces 10–30% of the total turbine torque and 40% of the total
21
pressure drop during normal operation. The downstream rotor has an efficiency of 20–
1
60% of the upstream rotor efficiency during normal operation. Exergy analysis is also
2
performed using the numerical simulation for steady state biplane W-Ts. The upstream
3
rotor has a design second law efficiency of 82.3%, although compared to the downstream
4
rotor second law efficiency of 60.7%.
5 6
3.4.
Flow through W-T
7
It is important to design a turbine that has as high operating aerodynamic efficiency
8
as possible and is matched with the OWC system for pressure drop and flow rate over a
9
wide range of sea conditions. For this purpose, many studies have investigated the flow
10
through the turbine, see (Figure 7).
11
[image:22.612.127.491.307.467.2]12
Figure 7 flow over turbine parts and operating condition parameter
13 14
The basic principles and procedures for designing a W-T for a wave energy power
15
station are described in [71]. The aerodynamic efficiency increases with flow ratioup to a
16
certain critical value, after which it decreases. In order to avoid transonic effects, the
17
maximum Mach number on the blades should be less than the critical Mach number.
18
However, the critical Mach number decreases with an increase in incidence or solidity.
19
Finally, the turbine maximum efficiency increases with an increase in Reynolds number.
20
The prediction methods and the variables that affect the aerodynamic performance
21
of a W-T are reviewed in [16]. It shows that W-T is less sensitive to inlet turbulence
22
compared to conventional turbo-machines. The performance of a turbine in sinusoidal
23
flow is better than that in a random air flow.
22
The use of CFD method to investigate the performance of a W-T is described in
1
[103]. It is found that stalling of the flow does not occur first at the blade root and spread
2
outward. It appears rather to be associated with the TC vortex and to spread inboard from
3
the near-tip region.
4
A computational model has been used in [104] to study the performance and
5
aerodynamics of the turbine, quantitatively and qualitatively. In addition, it is used to
6
study the flow coefficient, turbine stalls and the appropriate inlet velocity profile. It is
7
found from the computed results that the wakes behind the turbine blades (NACA0021)
8
merge rigorously in the portion of Radius ratio =0.45:1.0, which leads the turbine to stall.
9
The TC leakage flow is considerably higher in the trailing edge portion. However, as the
10
flow coefficient increases, leakage flow region advances towards the leading edge,
11
causing a large mass flow of air to leak through the gap.
12
The flow-field through a high solidity (σ = 0.6366) W-T using blades with constant
13
chord NACA0015 profiles is described in details in [38]. Separation at the outer radii has
14
been detected for high values of the flow rate, which turns out to be induced by a radical
15
shift of the mass flow through the turbine, mainly due to the cascade effect [30].
16
Numerical simulations have been performed to examine the flow-field through the
17
turbine blades at different flow-rates in [37]. It is found that the flow separation at the tip
18
is detectable by the presence of the pressure plateau along the suction side at coefficient
19
=0.238 and, more importantly, at coefficient=0.257.
20
An analysis, based on the actuator disk theory [105-107], is presented, and results
21
are compared with corresponding CFD simulations in [39]. It is illustrated that for low
22
values of flow coefficient, flow separation occurs near the rotor hub rather than at the
23
blade tip, consequently improving the global turbine performance.
24
Numerical simulations are performed in [108] to indicate that pressure and torque
25
coefficients increase when the flow rate coefficient increases. Highest calculated
26
efficiency of the W-T in [108] is calculated to be around 60% for non-dimensional flow
27
coefficient = 0.155. Operation of one OWC plant would produce 1850 kWh of energy per
28
year for the assumed average sea regime data in the Adriatic Sea[109].
29
Experimental characterization of W-T with NACA0015 profiles submitted to a
bi-30
directional flow is carried out, and the results are presented and analyzed in [110]. For
23
several test conditions, the maximum efficiency (approximately from 0.3 to 0.43 for
1
different test) of the turbine is always obtained for values of the flow coefficient between
2
0.19 and 0.21.
3
The entropy generation, due to viscous dissipation, around W-T has been recently
4
examined by the authors in [27, 111]. NACA0015 gives a less global entropy generation
5
rate and a higher efficiency rate compared with other airfoils. From the study of the
6
behavior of four different airfoils, NACA0015 is not the best airfoil in all conditions. For
7
example, at maximum Reynolds number, NACA0012 gives a less global entropy
8
generation rate, and NACA0020 creates the minimum value, so it is a good concept to
9
create an optimum design airfoil that gives better results than NACA0015. This study
10
suggests possible existence of critical Reynolds number at which a viscous irreversibility
11
takes minimum values.
12 13
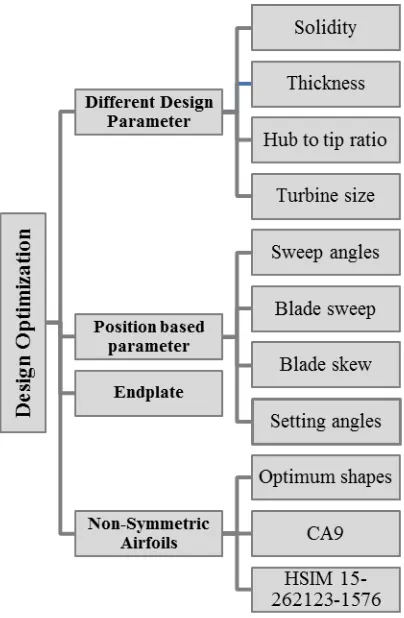
3.5. Design optimization
14
This subsection reviews different methods to optimize the design of W-T in order
15
to improve its overall performance: by changing in blade dimension or position, by
16
adding plate on the blade or finally by creating a new blade shape, see (Figure 8).
24 1
Figure 8 design optimization parameter and sub parameter
2 3
3.5.1. Different design parameter for turbine
4
Various wind tunnel tests on NACA four-digit airfoils in a tandem cascade with the
5
angles of incidence ranging from 0 to 90 degree are described in [30]. The increase in the
6
blade thickness results in larger negative values of torque coefficient and has a favorable
7
effect on starting.
8
The prediction methods and the variables that affect the aerodynamic performance
9
of a W-T are discussed in [16, 71]. A large solidity is needed for the turbine to be
self-10
starting. It is advisable to choose a thicker profile for small-scale turbines and a thinner
11
profile for a large-scale turbine. Values of hub-to-tip ratio approximately equal to 0.6 are
12
recommended for design.
13
The ability of a 3-D CFD method to predict the effect of solidity on the
14
performance of a monoplane W-T has been tested by [112]. Calculations of the effect of
15
solidity on turbine performance are predicted both qualitatively and quantitatively, and
16
the effect of clearance is qualitatively correct.
25
The operational matching of the performance of the turbine is used as the premise
1
in achieving an optimal design configuration and sizing. The range and frequency of
2
power bands presented to the turbine over long periods of time are in [113], which results
3
in a 5% improvement in power output with the optimal size of the turbine required to be
4
slightly larger than the average pneumatic power rating would suggest.
5
3.5.2. Position based parameter
6
The change in the position of blade according to the hub centerline through
7
different parameters (sweep angle, blade sweep, blade skew and setting angles) has
8
a direct effect on the performance of turbine.
9
3.5.2.1. Sweep angle, blade sweep and blade skew
10
An experimental work is presented to investigate and compare the
11
aerodynamic performance of the backward swept, see Figure 9 (a), and unswept
12
angle blades for different rotor solidities (0.64 and 0.32) for 0 degree and 20 degree
13
setting pitch angles in [114]. Results for the 0 degree setting pitch angles have 14
shown that the swept back angle blade produces a more positive value of efficiency
15
and torque than that of the standard unswept blades but at the expense of peak
16
efficiency. The experimental results show that this sweeping back angle has to be
17
minimized in order to reduce its detrimental effect on the overall turbine efficiency.
18
The calculations of the blade sweeps for the W-T, see Figure 9 (b), with a
19
numerical code by [115] and experimentally with quasi-steady analysis in [82]. As
20
a result, it is found that the performance of the W-Ts is influenced by the blade
21
sweep, and a suitable choice for the sweep ratio is 35%.
26 1
Figure 9 Position based parameter (a) backward Sweep angle (b) Blade Sweep Ratio (c) Blade Skew: left:
2
backward skewed blade; middle: straight blade; right: forward skewed blade [116]
3 4
The effect of blade skew, see Figure 9 (c), on the aerodynamic
5
performance and associated aerodynamic noise is assessed in [116] by using both
6
numerical simulations and experiments to develop an analytical blade design tool
7
for W-Ts, incorporating blade skew. Inception of stall inevitably causes an increase
8
of specific sound power level by up to 20 db. The backward/forward blade skew
9
delays the onset of stall and extends the turbine’s range of stall-free operation by
10
106% of the baseline. The flow generated sound in unstalled operation was
11
decreased up to 3 db by optimal backward / forward blade skew.
27
3.5.2.2. Setting pitch angles for blade.
1
Setting the blades at their optimum pitch angle during compression and suction is
2
expected to substantially improve W-T efficiency [117-124]. This is achieved by the
3
turbine manufacturer in such a way to allow the turbine blades to rotate around their axis
4
with an angle that equals ± optimum blade setting pitch angle.
5
The performance of W-T using self-pitch-controlled blades taking real air flows to
6
the turbine into account is clarified by [125]. Experimental investigations and computer
7
simulations using a quasi-steady analysis are performed on the optimum setting angle
8
during suction, and it is found to be 6 degrees while the one during compression is found
9
to be 10 degrees.
10
A modified W-T with setting angle has been investigated by model testing and
11
numerical simulation in [126]. It is found that the new turbine using rotor blades with a
12
fixed setting angle is superior to the conventional W-T, and that the optimum setting
13
angle was 2 degree for compression velocity amplitude to suction velocity ratios 0.8 and
14
0.6, in both with guide vanes and without guide vanes configurations.
15
A 400 kw variable-pitch W-T is built to be tested in the Pico plant, Azores,
16
Portugal alongside a fixed pitch W-T of a similar rating [127]. It is hoped that the
17
variable-pitch W-T will demonstrate increased net energy productivity. Therefore, the
18
variable-pitch turbine should be able to demonstrate increased energy productivity
19
compared to that of fixed-pitch machines. Moreover, the eddy-current pitch actuation
20
system should provide responsive and energy efficient pitching, but it was never
21
installed. The relatively modest efficiency of the W-T, especially when operating in the
22
compressor mode, severely limits the gains from reactive control.
23
A numerical optimization algorithm based on CFD simulation is implemented in
24
order to optimize the blade pitch angle in [128]. The standard NACA 0021 and AOP are
25
numerically investigated. The present CFD optimization results show that the optimum
26
blade pitch angle for NACA 0021 is +0.3 degree while that of the AOP equals +0.6
27
degree. The present airfoils with the optimized pitch angle show an average efficiency
28
improvement of 3.4% for standard NACA 0021 and 4.3% for the AOP.
29
A numerical optimization algorithm is implemented in this work [129]. The present
30
CFD optimization results show that the optimum blade pitch angle for NACA 0021 is 0.3
28
degree while that of the optimized blade equals 0.6 degree. Up to 2.3% improvement in
1
NACA 0021 turbine efficiency and 6.2% improvement in AOP efficiency are achieved.
2
3.5.3. Endplate
3
In order to improve the performance of the W-T, the effect of end plate,
4
see Figure 10, on the turbine characteristics has been examined in [130, 131]. Using
5
an experimental model and CFD method shows that the optimum plate position was
6
a forward type. Also, the peak efficiency increases approximately 4%as compared
7
to the W-T without an endplate.
8
9
[image:29.612.64.513.240.568.2]10
Figure 10 Rotor blade with end plate a) backward type; ; b) forward type c) middle type
11
3.5.4. Non-Symmetric airfoils
12
A methodology for numerical simulation of a CA9 rotor W-T is presented
13
in [132]. Researchers have stressed the use of traditional symmetrical NACA series
14
blades until they developed an optimized profiles: CA9, which has the same
15
thickness as NACA0015 and is optimized in terms of the leading edge radius,
16
maximum thickness position and trailing edge slope [133, 134]. It shows
29
superiority over a standard NACA0015. A maximum efficiency of 70% is obtained,
1
and the overall computed performance related to reasonable qualitative agreement
2
with experimental one.
3
The calculations of the blade sweeps for the W-T with the NACA0020 and
4
the CA9 blades are carried out to clarify the performance with a numerical code by
5
[115]. The overall performances for the NACA0020 blade are better than those for
6
the CA9 blade. Generally, the blade thickness is thinner on NACA four digit series,
7
while the maximum efficiency is higher and the stall margin deteriorates. However,
8
both the maximum efficiency and the stall margin for the NACA0020 blade in this
9
calculation are better related to those for the CA9 blade.
10 11
Four kinds of blade profile are selected with regard to the blade profile of the
W-12
T in [81, 82, 135]. The types of blade profiles are as follows: NACA0020,
13
NACA0015, CA9, and HSIM 15-262123-1576. The experimental investigations
14
have been performed for two solidities (0.48 and 0.64) by experimental testing
15
(steady flow conditions) and numerical simulation using a quasi-steady analysis
16
(running and starting characteristics under sinusoidal flow). As a conclusion,
17
NACA0020 is superior to other turbines (NACA0020; NACA0015; CA9; and
18
HSIM 15-262123-1576) in the small—scale model testing. For a large-scale W-T
19
operated at high Reynolds number, a suitable choice is the blade profile of
20
NACA0015. However, the experimental investigations operating under sinusoidal
21
and real sea conditions in [92, 93] conclude that the preferred rotor geometry is
22
CA9 blade profile, with rotor solidity 0.64.
23 24
Two-stage W-Ts with symmetric and non-symmetric airfoils have been
25
investigated in [101], and the numerical algorithms are used to estimate the
26
optimum shape with an increase of efficiency (by 2.1%) and of tangential force
27
coefficient (by 6%), compared to the standard NACA 2421. An optimization
28
process is employed in order to increase the tangential force induced by a
29
monoplane W-T in [136]. A relative increase of the tangential force coefficient
30
exceeding 8.8% (as a mean, 11.3%) is obtained for the full operating range. At the
30
same time, the efficiency improves also by at least 0.2% and up to 3.2% (as a mean,
1
1%) compared to the standard NACA 0021.
2
A comparison of total entropy generation, due to viscous dissipation, between a
3
suggested design (variable chord) and a constant chord W-T is presented in [137].
4
The detailed results demonstrate an increase in static pressure difference around
5
new blade and a 26.02 % average decrease in total entropy generation throughout
6
the full operating range.
7
3.6. Tip clearance
8
The gap between the casing and blade tip is a very effective parameter on the
9
turbine behavior. The effect of the flow around the tip is more significant in the process
10
of turbine stall than that around the hub [138-140].
11
The prediction methods and the variables that affect the aerodynamic performance
12
of a W-T are discussed in [16, 71]. The W-T is very sensitive to TC when compared to
13
conventional turbines. Therefore, values of a TC ratio less than 0.02 are recommended for
14
design.
15
The ability of a 3-D CFD method to predict the effect of TC on the performance of
16
a monoplane W-T has been tested in [112]. It is shown that as the TC increases, the
17
performance of the turbine drops.
18
In order to examine the effect of the extent of the TC on the steady performance of
19
the turbine, the results of numerical computations performed with different TC (1%, 5%
20
and 10% of the chord length) and different flow conditions (0.15, 0.225, and 0.275) are
21
illustrated in [38]. The stagnation pressure drop coefficient decreases when increasing the
22
TC. On the other hand, the torque coefficient decreases when increasing the TC. In fact,
23
the gap must be neither too small in order to avoid flow separation already existing at low
24
values of the flow coefficient nor too large in order to avoid too small performance
25
caused by small pressure drop through the turbine and large tip leakage flow.
26
A comparison between numerical and experimental investigations is conducted in
27
[141] for studying uniform TC ratio. Regarding turbine efficiency, it is found that the
28
peak efficiency of the turbine decreases and shifts towards a higher flow coefficient as the
29
TC to chord length ratio increases, while the stall margin becomes wider.
31
The performance of a W-T with various non-uniform TC is examined using CFD
1
by [142]. The performance of turbines with uniform and non-uniform TC is compared. It
2
is shown that the turbine with non-uniform TC seems to have a preferable overall
3
performance.
4
CFD models based on the LIMPET OWC turbo generation section are studied in
5
[143] to investigate how airflow impingement created by a rotating turbine directly
6
upstream increases the heat transfer away from an electrical generator, and also how this
7
could be increased by adjusting the clearance between the turbine tips and shroud. As the
8
clearance between the turbine tip and shroud is reduced, the performance of the turbine in
9
terms of torque and efficiency rises as does the heat transfer from the generator.
10 11
3.7. Other variables’ effect on overall performance
12
In order to enhance the overall performance of W-T systems, different parameters
13
such as turbine material, mechanics of materials, oscillating chamber and the electricity
14
generation in the system are also investigated.
15
3.7.1.
Materials and mechanics of materials16
The selection of materials for airfoil blades component is one of the most important
17
issues in the optimum design of W-T employed in an OWC wave power generator as
18
shown in [144]. The selection of materials using Cambridge materials selector [145] and
19
simple tabulation has separated and ranked 5 candidates out of 167 materials class,
20
consisting of Titanium alloys class, GFRP class, and CFRP class. Further evaluation has
21
specified two prime candidates: Fiber Reinforced Composites (Carbon Fiber/Epoxy
22
Resin) and Titanium Alloys (Ti6Al4V).
23 24
The authors in [146] describe the methods developed during the design and
25
development phase of its W-T suitable for installation into active renewable energy
26
breakwater schemes. Due to the bespoke nature of the systems involved, a finite element
27
analysis is implemented to stress critical components. This piece of information is fed
28
into fatigue analysis routines for component life estimation. The loading, geometry and
29
material models are combined to create a fatigue life prediction. The stresses are then
32
added together to give a total stress. The total annual contribution to fatigue from the
1
wave loading is found. This fatigue damage is combined with the damage created from
2
the start-stop cycles to give an overall fatigue life prediction of 44 years.
3 4
3.7.2.
Oscillating chamber5
With an additional vertical duct at the wave-beaten side in the of house OWC
6
system, it is expected to give some better performances in [147]. It can be concluded that
7
a U-OWC can give performances better than those of a conventional OWC both with
8
swells and large wind waves. Furthermore, a U-OWC can give performances better than
9
those of a conventional OWC also with small wind waves. In heavy sea states, the
10
conventional OWC is expected to suck air through the opening in the wave-beaten wall,
11
for some short span of time; not so the U-OWC. Under the same weight, a breakwater
12
embodying the U-OWC has a safety factor slightly greater than the safety factor of a
13
breakwater embodying the conventional OWC.
14
The effects of duct area ratio and duct angle are examined in order to optimize W-T
15
performance in [148]. The turbine performance is numerically investigated by CFD
16
models. The duct area ratio = 1.5 is considered the optimum area ratio for the investigated
17
turbine as a maximum value of 10% increase of the turbine power is achieved. Increasing
18
the duct angle to an optimum value of 7degrees at this optimum duct area ratio ensures
19
separation free flow in the downstream diffuser and up to 14% improvement in turbine
20
power and up to 9% increase of the turbine efficiency.
21
3.7.3.
Electricity generation22
Two control strategies of an OWC- W-T generator module are proposed and
23
compared in order to study the stalling behavior in the W-T by [42]. In the first one, a
24
rotational speed control system is employed to appropriately adapt the speed of the
25
double-fed induction generator coupling to the turbine, according to the pressure drop
26
entry. In the second control strategy, an airflow control regulates the power generated by
27
the turbine generator module by means of the modulation valve avoiding the stalling
28
behavior. The experiments suggest that the air control valve is more adequate to regulate
29
the generated power according to the demand of the grid. Therefore, the obtained results


![Table 3 A summary of the performance data for the different turbines, [74]](https://thumb-us.123doks.com/thumbv2/123dok_us/1557675.108369/16.612.190.420.69.330/table-summary-performance-data-different-turbines.webp)
![Table 4 Maximum efficiency with minimum torque and starting torque coefficients [75]](https://thumb-us.123doks.com/thumbv2/123dok_us/1557675.108369/17.612.65.548.112.194/table-maximum-efficiency-minimum-torque-starting-torque-coefficients.webp)