R E S E A R C H
Open Access
Influence of a strict glucose protocol on
serum potassium and glucose concentrations
and their association with mortality in
intensive care patients
Esther V. Uijtendaal
1*, Jeannette E.F. Zwart-van Rijkom
1,2, Dylan W. de Lange
3, Arief Lalmohamed
1,2,
Wouter W. van Solinge
2,4and Toine C.G. Egberts
1,2Abstract
Introduction:Tight glucose control therapy (TGC) has been implemented to control hyperglycemia in ICU patients. TGC may also influence serum potassium concentrations. We therefore investigated the influence of TGC on both serum glucose and serum potassium concentrations and associated mortality.
Method:We performed a retrospective analysis including all patients admitted to the ICU of a tertiary hospital for 24 hours or more and with at least three serum glucose and serum potassium concentrations between 1999–2001 (conventional period), 2002–2006 (implementation period) or 2007–2009 (TGC period). Segmented regression analysis was used to estimate changes in outcomes that occurred after the intervention controlling for pre-intervention trends. Means and standard deviations (SDs) of serum glucose and serum potassium concentrations, and rate of severe hypoglycemia (≤2.2 mmol/L) and hypokalemia (≤3 mmol/L), were compared between the TGC and conventional period.
Results: Although mean serum glucose concentrations dropped 2.1 mmol/L (95 % CI =−1.8 to −2.3 mmol/L, p<0.002), mean serum potassium concentrations did not change (absolute increase 0.02 mmol/L; 95 % CI =−0.06 to 0.09 mmol/L, p=0.64). The rate of severe hypoglycemia increased with 5.9 % (95 % CI=−3.0 to−8.9, p<0.002), but the rate of hypokalemia remained equal (absolute reduction 4.8 %; 95 % CI =−11.1 % to 1.5 %, p=0.13). The SD of serum glucose concentrations within a patient did not change, while the SD of serum potassium concentrations even decreased 0.04 mmol/L (95 % CI =−0.01 to−0.07, p=0.01). ICU mortality decreased but this decrease was not significant (absolute difference−3.63 %; 95 % CI =−9.33 to 2.09, p=0.20).
Mean serum glucose concentrations, mean serum potassium concentrations and SDs of both serum glucose and serum potassium concentrations were all independently associated with ICU mortality. Highest mortality rates were seen at both the lowest and highest mean values (U/J-shaped association) and mortality rates increased with increasing variability (SDs) for both serum glucose and serum potassium concentrations.
Conclusion:Our study shows that a TGC was not associated with an increased risk of serum potassium related events. Low and high mean values and high variability of both serum glucose and serum potassium concentrations are predictors for high ICU mortality.
* Correspondence:[email protected]
1
Department of Clinical Pharmacy, University Medical Centre Utrecht, PO box 855003508GA, Utrecht, The Netherlands
Full list of author information is available at the end of the article
Introduction
Hyperglycemia in response to critical illness has been associated with increased morbidity and mortality [1]. The mechanism suggested for this increased risk is that elevated glucose concentrations increase the con-centration of several toxic intracellular derivatives that are generated as by-products of the glycolytic pathway [2, 3]. Especially during severe illness, the expression of insulin-independent glucose transporters on the mem-branes of several cell types is upregulated, which may allow high circulating glucose concentrations to overload and damage these cells [4–7]. Based upon this line of reasoning, Van den Berghe et al. investigated whether a tight glycaemic control (TGC) protocol (target serum glucose concentration 4.4−6.1 mmol/L (80–110 mg/dL)) would reduce mortality in ICU patients [8]. In this land-mark clinical trial absolute mortality was reduced by 3.4 %. This led to the implementation of TGC protocols in many ICUs worldwide.
Subsequent studies performed in medical ICU patients, however, failed to reproduce the reduction in mortality [9–11]. The NICE-sugar investigators even reported in-creased mortality when TGC was compared to conven-tional treatment [12]. Since then, TGC has become a major area of debate among medical specialties involved in the care of acutely ill patients. Several hypotheses have been postulated to explain the contradictory results.
First, the characteristics of study populations differed between the different clinical trials that were carried out. TGC seems to benefit surgical ICU patients more than medical ICU patients [13]. In the setting where hyperglycemia is triggered by surgery, the delay between onset of hyperglycemia and the start of glycemic control is short. Medical ICU patients may have suffered from chronic diseases and hyperglycemia before ICU admission and time from the onset of symptoms to the start of TGC may be longer. As such the TGC protocol may be more beneficial in surgical ICU patients. The most recent meta-analysis, however, showed that there is no significant benefit of TGC in either medical or surgical patients [14]. Second, a TGC protocol can be expected to increase the incidence of severe hypoglycemia, which in itself raises the risk of mortality. Increased incidence of severe hypoglycemia (≤2.2 mmol/L (40 mg/dL) serum glucose concentration) was seen in all studies that applied a TGC protocol [15]. The highest rates of severe hypoglycemia were generally found in studies that applied the lowest serum glucose targets, varying, however, with the complexity of the TGC protocols [16]. An increased rate of severe hypoglycemia may also reflect a large fluctuation of serum glucose concentrations implying that these vulnerable patients may also be exposed to high glucose concentrations, although mean serum glu-cose concentrations are relatively low [17]. In vitro studies
showed that a large variability in glucose concentrations may enhance cell apoptosis [18, 19] and some clinical studies confirmed an independent association between large variations in serum glucose concentrations and mor-tality [20–23]. Third, in addition to serum glucose, serum potassium may also be a significant factor influencing patients’outcomes. It is well known that insulin induces a shift of potassium from the extracellular to the intracellu-lar compartment. As a result, the implementation of a TGC protocol may also induce larger variations in serum potassium concentrations and more frequently hypokal-emia and associated complications such as arrhythmia. In the NICE-sugar study there was an increased risk of cardiovascular deaths in the TGC-group, but its cause remained unclear [12]. It was suggested that a missed episode of arrhythmogenic hypokalemia may have contributed to the excess of cardiovascular deaths [24], although, arrhythmias caused only 83 out of 1,580 deaths and there was no difference in the risk of death from arrhythmia in the two groups (relative risk (RR) for inten-sive versus conventional control of 1.1; 95 % CI 0.7, 1.7, p= 0.6 [25, 26]. There are studies that have reported increased incidence of hypokalemia, and emphasized the necessity for combined glucose and potassium monitoring to prevent hypokalemia-induced arrhythmia [24, 27]. Other studies did not mention the measurement of serum potas-sium concentrations as a part of the TGC protocol.
Because of the ongoing discussion, we investigated in our own academic ICU what the influence was of the implementation of a TGC protocol on the rate of severe hypoglycemia and hypokalemia and the variation in serum glucose and potassium concentrations. Furthermore, the association between mortality and both serum glucose and potassium concentrations and variability was studied during the TGC period.
Methods
Setting and study population
This retrospective observational study was carried out at the 32-bed ICU of the University Medical Centre Utrecht (UMCU), which is a tertiary care teaching hospital in the Netherlands. Surgical, internal, neuro-logical and cardiothoracic ICU patients are treated on this ICU. A TGC policy was consecutively implemented on all specialties of the ICU during the years 2002–2006. These years were defined at the implementation period. The years before implementation, 1999–2001, were defined as the conventional period and the years 2007–2009 were defined as the TGC period.
and that serum glucose concentrations were main-tained at 10–11 mmol/L (180–200 mg/dL). During the TGC period, a TGC protocol was followed, aiming to maintain serum glucose concentrations at 4.4–6.1 mmol/L (80–110 mg/dL). Details of this TGC protocol can be found in Additional file 1. In the conventional period, the policy was to start potassium supplementation if serum potassium was <4 mmol/L; this policy did not change in the TGC period. After 2009, target glucose concentrations were gradually increased to <8 mmol/L; this period is not included in the analysis. Guidance on glucose and potassium concentrations was paper based, not computer assisted.
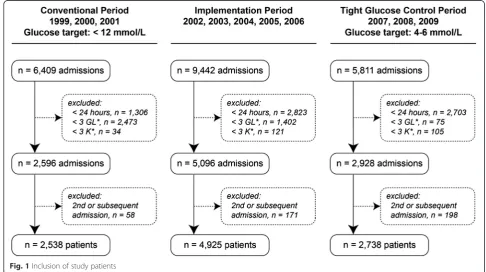
Adult patients (≥18 years) who were admitted to the ICU for more than 24 hours in the years 1999–2009 were eligible for inclusion. To be able to calculate serum glucose and potassium variability, patients with fewer than three valid serum glucose or fewer than three valid serum potassium measurements during ICU admission were excluded. Moreover, if a patient was admitted to the ICU more than once, only the first admission was included (Fig. 1).
Multiple machines, including point of care meters for blood glucose, were used to measure glucose and potassium concentrations throughout the study. Point of care meters for blood glucose did not provide potassium readings. The machines were all calibrated to each other. For research purposes all laboratory values are routinely exported to the Utrecht Patient Oriented Database (UPOD). UPOD is an
infrastructure of relational databases comprising data on patient demographics, hospital discharge diagnoses, medical procedures, medication orders and laboratory tests for all patients treated at the UMCU, and has been described in detail elsewhere [28]. The anonymized data analysis in this study was performed in accordance with the guidelines and Dutch legislation and it was approved by the medical ethical committee of our institution (Medical Ethical Review Committee University Medical Centre Utrecht, MERC WAG/om/14/013125). As only routinely documented patient data were used in this study, the ethical board of the University Medical Centre Utrecht waived the need for informed consent.
Outcomes
Four outcome parameters were determined for each individual patient:
1) mean serum glucose and potassium concentrations: means of serum glucose and serum potassium concentrations were calculated for each patient during ICU stay
2) severe hypoglycemia and hypokalemia: proportion of patients with at least one severe hypoglycemic episode and proportion of patients with at least one hypokalemic episode. Severe hypoglycemia was defined as a serum glucose measurement
≤2.2 mmol/L and hypokalemia was defined as a serum potassium measurement≤3.0 mmol/L
[image:3.595.53.540.458.730.2]3) variability of serum glucose and serum potassium concentrations: mean SD of individually calculated SDs of serum glucose and serum potassium. 4) ICU mortality.
Data analysis
First, interrupted time series analysis was performed to compare the TGC period with the conventional period. Patient characteristics were compared using the t test (mean values), the chi-square test (proportions) and Mann–Whitney U test (median values). Segmented regression analysis was used to estimate changes in outcomes that occurred after the intervention controlling for pre-intervention trends [29]. The intervention was the implementation of a TGC protocol between January 2002 and January 2007. Outcome values during the implementa-tion period were modelled as a separate segment. Each time point in the time series data represents a 3-month period resulting in the recommended minimum of 12 time points before and 12 time points after the intervention [29]. The following linear regression model was used:
Yt¼β0þβ1 time1þβ2 time2þβ3 time3 ð1Þ
where Yt= mean serum glucose concentration at time = t;
β0 = intercept = mean serum glucose concentration at
time = 0; β1= baseline trend = change in serum glucose
concentration during the conventional period; time1= time
after start of the conventional period (Jan 1, 1999);
β2 = trend change during the implementation period,
adjusted for the baseline trend; time2= time after start of
the implementation period (Jan 1, 2002); β3 = trend
change during the TGC period, adjusted for the baseline trend and trend change during the implementation period; time3= time after start of the TGC Period (Jan 1, 2007).
The change in mean serum glucose values between the end of the control period and the start of the TGC period are calculated from:
Change ¼ β1þβ2 duration of implementation
ð2Þ
The same regression model was used for the proportion of patients with severe hypoglycemia, the mean SDs for serum glucose concentrations, mean serum potassium concentrations, proportion of patients with hypokalemia, mean SDs for serum potassium concentrations and ICU mortality.
Second, the relationship between mean serum glucose concentrations, mean serum potassium concentrations and ICU mortality was studied. This relationship was also studied for the SD of serum glucose, SD of serum potas-sium concentrations and mortality. For this analysis, only patients who either survived or who died on the ICU during the TGC period were included. Logistic regression
analysis was performed to determine the association between mean glucose concentrations and risk of ICU mortality. Adjustments were made for mean serum potassium concentrations, age and gender. As adjustment for length of stay may be influenced by the TGC therapy, it is left out of the adjustment [26]. A similar procedure was performed to determine the association between mean serum potassium concentrations (with adjustments for mean serum glucose concentrations, age and gender), SD of serum glucose concentrations and SD of serum potassium concentrations and ICU mortality. Moreover, to study the relationship between the combined mean serum glucose and mean serum potassium concentrations on ICU mortality, patients were divided into eight equal subgroups for their mean serum glucose and eight equal subgroups for their mean serum potassium values. This resulted in 64 possible mean glucose-mean potassium subgroup-combinations. ICU mortality was calculated for each combination.
Time series analysis was performed using SAS 9.2, SAS Institute Inc, Cary, NC, USA using the PROC REG procedure. All other data analyses were per-formed using SPSS release 20 (SPSS release 20 (SPSS, Inc., Chicago, IL, USA).
Results
During the study period 21,662 admissions were available for selection. After application of the inclusion criteria, 2,538 patients were eligible for inclusion in the conven-tional period, 4,925 in the implementation period and 2,730 in the TGC period (Fig. 1). Baseline characteristics of the patients are shown per period in Table 1. Compared to patients included in the conventional period, patients in the TGC period were older (59.6 vs 57.6 years), mean serum creatinine concentrations were lower (112 vs 121 mmol/L), the length of ICU and hospital stay was shorter (3.1 vs 4.5 and 16 vs 18 days respectively) and the number of patients admitted due to an emergency was lower (45 vs 54 %). ICU mortality was also lower in the TGC period (14.4 vs 18.6 %). The median number of serum glucose measurements per patient per ICU day increased approximately 4.7 times (p<0.002) after imple-mentation of the TGC protocol. The median number of serum potassium measurements per patient per ICU day, increased from 2.3 measurements to 2.8 (p<0.002).
Comparison of the TGC period with the conventional period
(95 % CI = −1.8,−2.3,p<0.002, Fig. 2). The percentage of patients with a severe hypoglycemia increased from 1.7−7.6 %, an absolute increase of 5.9 % (95 % CI = 3.0, 8.9 %, p <0.002). The variability of serum glucose concentrations within patients did not change after implementation of the TGC protocol (absolute difference−0.11 mmol/L; 95 % CI =−0.26, 0.03,p= 0.13).
Similarly to serum glucose, values over time for serum po-tassium are displayed in Figs. 5, 6, and 7. Mean serum potas-sium concentrations stayed the same (absolute increase 0.02 mmol/L, 95 % CI =−0.06, 0.09 mmol/L,p= 0.64). The per-centage of patients with hypokalemia dropped from 23.8 to 19.0 %, an absolute reduction of 4.8 % (95 % CI =−11.1, 1.5
%, p = 0.13), however, this reduction was not statistically significant. The variability of serum potassium concentra-tions within a patient decreased after implementation of the TGC; SD values decreased by 0.04 mmol/L (95 % CI = −0.01,−0.07,p= 0.01).
ICU mortality over time is displayed in Fig. 8. ICU mor-tality decreased from 19.0−15.4 %, but this decrease was not significant (95 % CI=−9.3, 2.1,p= 0.20).
Relationship between serum glucose and potassium concentrations and ICU mortality during TGC
During TGC, overall ICU mortality was 15.2 %. Multivari-ate logistic regression analysis revealed a U-shaped
[image:5.595.59.539.99.341.2]Fig. 2Mean serum glucose concentrations during the study period. y = 8.720875 - 0.00002*time1 - 0.0011*time2 + 0.001605*time3
Table 1Baseline characteristics
Control period 1999, 2000, 2001 (n = 2,538)
Implementation period 2002, 2003, 2004, 2005, 2006 (n = 4,925)
Tight glucose control period 2007, 2008, 2009 (n = 2,730) P
value
Male gender, % 60.3 63.1 60.7 0.782a
Age, years, mean (95 % CI) 57.6 (57.0, 58.3) 59.9 (59.4, 60.3) 59.6 (59.0, 60.2) <0.002b
Length of stay in ICU, days, median (IQR) 4.5 (2.0, 11.3) 2.8 (1.1, 8.2) 3.1 (1.8, 8.3) <0.002c
Length of stay hospital, days, median (IQR) 18.0 (9.0, 38.7) 14.0 (7.9, 30.5) 16.0 (8.1, 32.8) <0.002c
Hospitalization due to emergency, % 54.0 41.8 45.1 <0.002a
Died on ICU, number (%) 472 (18.6) 659 (13.4) 393 (14.4) <0.002a
Died in hospital, number (%) 135 (5.3) 275 (5.6) 147 (5.4) 0.741a
Number of glucose measurements per patient, median (IQR)
8 (5–18) 12 (6–37) 27 (13–76) <0.002c
Number of glucose measurements per patient per ICU day, median (IQR)
1.9 (1.2, 3.3) 4.8 (2.8, 7.8) 8.9 (7.3, 10.6) <0.002c
Number of potassium measurements per patient, median (IQR)
10 (6–21) 9 (6–17) 9 (6–20) <0.002c
Number of potassium measurements per patient per ICU day, median (IQR)
2.3 (1.5, 3.5) 2.8 (1.9, 4.8) 2.8 (2.0, 3.9) <0.002c
pH, mean (95 % CI) 7.42 (7.38, 7.45)† 7.39 (7.39, 7.39)††††† 7.39 (7.39, 7.39)†† 0.125b
Creatinine, mean (95 % CI) 120.6 (115.7, 125.4)††† 108.5 (105.6, 111.4)†††††† 111.5 (107.5, 115.5)†††† <0.002b
Pvalues represent differences between control period and tight glucose control period.a
Chi square test;b
independent samplesttest;c
Mann-WhitneyUtest; †0.6 % missing;††8.6 % missing;†††0.1 % missing;††††0.7 % missing;†††††0.6 % missing;††††††0.5 % missing
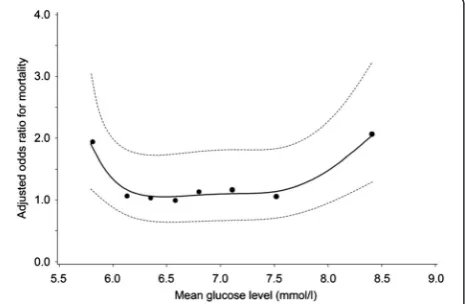
[image:5.595.306.538.550.694.2] [image:5.595.57.292.557.704.2]relationship between mean serum glucose concentrations and mortality (Fig. 9). This association was also found in the conventional and implementation period. A J-shaped relationship was found between serum potassium con-centration and mortality (Fig. 10). Both trends were statistically significant and independent of age and gender, and mean serum potassium or mean serum glucose concentrations, respectively.
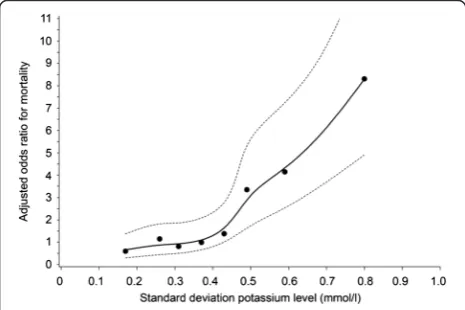
Mortality increased with increasing variability (SDs) of both serum glucose and serum potassium concentrations (Figs. 11 and 12). These trends were also independent of age and gender and SD for serum potassium or SD for serum glucose concentrations, respectively.
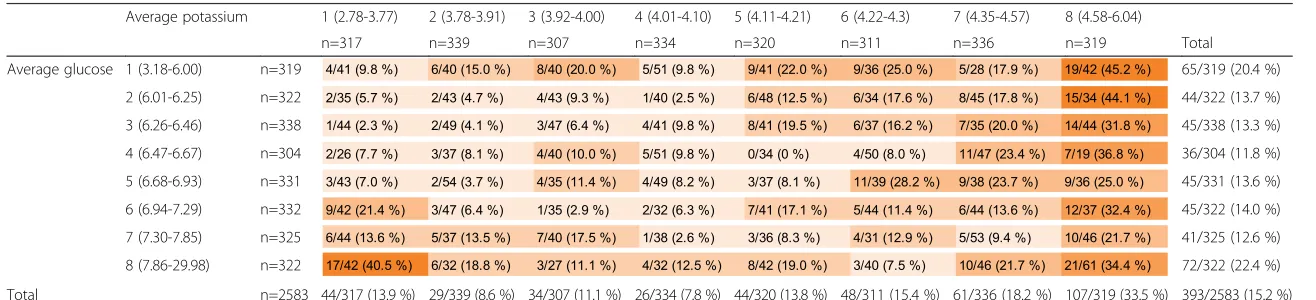
The percentages of patients who died at the ICU in each combined mean serum glucose and mean serum potassium concentration subgroup are displayed in Table 2. When stratified for both mean serum glucose and mean serum po-tassium concentrations, extremes in mortality were seen in both the combined highest mean serum potassium and low-est serum glucose subgroup (45.2 %) and the combined highest mean serum glucose and lowest mean serum
potassium subgroup (40.5 %). ICU mortality increased with increasing variability of both serum glucose and serum po-tassium concentrations with extremes at the highest SDs of the combination (Table 3).
Discussion
Although implementation of TGC resulted in a significant absolute reduction of mean serum glucose concentrations of 2.1 mmol/L, mean serum potassium concentrations did not change significantly. The proportion of patients with a severe hypoglycemia increased from 1.7 to 7.6 % while the proportion of patients with a hypokalemia did not change. The variability of serum glucose concentrations within patients did not change while the variability of serum potassium values decreased. TGC did not change ICU mortality significantly. The highest mortality was seen in patients with low serum glucose concentrations combined with high serum potassium concentrations and in patients with high serum glucose concentrations combined with low serum potassium concentrations. ICU mortality increased Fig. 4Means of individual standard deviations for serum glucose
concentrations during the study period. y = 2.085461 - 0.00019*time1 + 0.000133*time2 + 1.342228*time3
Fig. 5Mean serum potassium concentrations during the study period. y = 4.117654 - 0.0000025*time1 + 0.0000114*time2 + 0.0000374*time3
Fig. 6Percentage of patients with a period of hypokalemia (≤3 mmol/L) during the study period. y = 24.14247 0.00029*time1 -0.00236*time2 - 0.004526*time3
[image:6.595.57.290.88.236.2] [image:6.595.305.539.89.236.2] [image:6.595.305.539.551.695.2] [image:6.595.56.290.559.704.2]with increasing variability for both serum glucose and serum potassium concentrations.
Implementation of a TGC led to 4.7 times more frequent measurement of serum glucose concentrations per ICU day (8.9 vs 1.9), lower mean glucose concentrations and higher incidence of severe hypoglycemia. As both moderate and se-vere hypoglycemia are associated with increased risk of death, elevated rates of both moderate and severe hypoglycemia should be prevented [26, 30]. In our setting, after implementation of the TGC protocol, the incidence of severe hypoglycemia was 7.6 %. This percentage com-pares favourably to the percentages 5.1–28.6 % found in other studies [8, 11, 15]. As it is known that spontaneous hypoglycemia is correlated with higher mortality than hypoglycemia occurring during insulin administration [31], it would have been interesting to know whether the increase of severe hypoglycemia could be assigned to insu-lin administration. Unfortunately, data on insuinsu-lin adminis-tration were not available. Moreover, it is hard to unravel whether the increased incidence of severe hypoglycemia is
caused by the lower mean glucose concentrations or whether it is caused by the more frequent measuring of serum glucose concentrations, as more frequent monitor-ing may also increase the chance to detect severe hypoglycemia.
As insulin therapy induces a shift of potassium from the extracellular to the intracellular space, we expected that the proportion of patients with hypokalemia would increase. However, in our study mean serum potassium concentra-tions and the proportion of patients with hypokalemia did not change significantly after implementation of the TGC protocol. One study did find increased incidence of hypokal-emia after implementation of TGC, but this study used a higher threshold to define hypokalemia [24, 32]. Another study reported an increase of patient days with hypokalemia just after application of TGC, but this increase did not persist throughout the study period [27]. We believe that a serum potassium concentration ≤3 mmol/L represents a more appropriate threshold as this comprises a serious risk of arrhythmia [33]. Apparently, the unchanged policy in our setting to maintain serum potassium concen-trations >4 mmol/L was successful in preventing severe hypokalemia. The exact extent of potassium supplementa-tion, however, is not known, which complicates the interpretation of this finding. One may also speculate that after TGC, potassium can shift back from the intracellular to the extracellular cellular space and thereby increase mortality. Although we cannot exclude this possibility, our results do not support this hypothesis.
Some studies showed that TGC increased the variability of serum glucose concentrations. This is of clinical import-ance as an increased variability is associated with a rise in mortality. In our study, after implementation of TGC, serum glucose SD values stayed about equal. This means that TGC can be implemented in the general practice Fig. 8ICU mortality during the study period. y = 18.3116 +
0.000695*time1 - 0.00268*time2 + 0.0000777*time3
[image:7.595.306.539.88.250.2]Fig. 9Relationship between mean serum glucose concentrations and adjusted* ODDs ratio on ICU mortality during TGC period. * adjusted for age, gender, length of ICU stay and mean serum potassium concentrations
[image:7.595.57.291.89.238.2] [image:7.595.58.291.533.685.2]without an increase of serum glucose SD values. The SD of serum potassium concentrations even decreased, while the target concentrations and monitoring frequency remained unchanged.
As was shown in the follow up of the Leuven study in critically ill children, a possible effect of TGC is a reduc-tion in ICU mortality, despite an increase in severe hypoglycaemia [34]. In line with these findings, ICU mortality in our study decreased from 19.0 to 15.4 %, but this reduction was not significant when it was controlled for the pre-intervention trend in ICU mortality (absolute difference−3.6; 95 % CI =−9.3, 2.1,p= 0.20). This means that factors other than TGC have also contributed to the reduction in ICU mortality. As such, we cannot con-clude that the implementation of TGC resulted in lower mortality, even though this study was not designed to estimate the effect of TGC on ICU mortality.
During TGC, the highest ICU mortality was seen at both low and high mean serum glucose concentra-tions. A similar relationship between mean glucose concentrations and mortality was recently described for cardiac patients admitted to the ICU [35]. Mortal-ity, however, was also high at both low and high serum potassium concentrations. A similar relation-ship between serum potassium concentrations and hospital mortality has recently been described by Hes-sels et al. [36]. In our study, however, ICU mortality was adjusted for both mean serum glucose and mean serum potassium concentrations. This means that both mean serum glucose and serum potassium con-centrations were independently associated with ICU mortality. Moreover, mortality for low and high mean serum potassium concentrations was higher than for low and high mean serum glucose concentrations. Apparently, the association between mean serum po-tassium concentrations and ICU mortality was stron-ger than the association between serum glucose concentrations and ICU mortality.
The combined mean serum glucose–mean serum
potassium concentrations Table 2 reveals the highest mortality rates in both the combined lowest serum glucose and highest serum potassium subgroup (45.2 %) and the combined highest serum glucose and low-est serum potassium subgroup (40.5 %). Patients in the first subgroup, may have been severely ill, which is often accompanied with high serum potassium concentrations. When these high serum potassium concentrations were treated with insulin, severe hypo-glycemia may have resulted. In the latter subgroup, the TGC protocol might have contributed to the high mortal-ity, as correction of the high serum glucose concentration in combination with the relatively low serum potas-sium concentration may have resulted in unintended hypokalemia.
ICU mortality also increased with increasing SD values for both serum glucose and serum potassium concen-trations and the highest mortality rates were seen in the combined highest serum glucose SD and serum potassium SD subgroups. Xu et al. recently also showed a relationship between variability of serum sodium concen-trations and mortality, suggesting that high variability is unfavorable for a patient’s outcome [37]. High variability may have been caused by the TGC protocol but may also be the result of the severity of disease. As no information was available about the severity of illness, it was not possible to unravel the association between variability, severity of illness and mortality, which limits the causal interpretation.
[image:8.595.57.290.90.243.2]Another limitation is that no information was available about the individual use of insulin, parenteral feeding or co-medication. The use of co-medication might have been Fig. 11Relationship between SD for serum glucose concentrations
and adjusted* ODDs ratio on ICU mortality during TGC period. * adjusted for age, gender, length of ICU stay and SD for serum potassium concentrations
[image:8.595.57.290.532.687.2]Table 2ICU mortality (percentage and numbers) per stratum of mean serum glucose and mean serum potassium concentrations during the TGC period
Average potassium 1 (2.78-3.77) 2 (3.78-3.91) 3 (3.92-4.00) 4 (4.01-4.10) 5 (4.11-4.21) 6 (4.22-4.3) 7 (4.35-4.57) 8 (4.58-6.04)
n=317 n=339 n=307 n=334 n=320 n=311 n=336 n=319 Total
Average glucose 1 (3.18-6.00) n=319 65/319 (20.4 %)
2 (6.01-6.25) n=322 44/322 (13.7 %)
3 (6.26-6.46) n=338 45/338 (13.3 %)
4 (6.47-6.67) n=304 36/304 (11.8 %)
5 (6.68-6.93) n=331 45/331 (13.6 %)
6 (6.94-7.29) n=332 45/322 (14.0 %)
7 (7.30-7.85) n=325 41/325 (12.6 %)
8 (7.86-29.98) n=322 72/322 (22.4 %)
Total n=2583 44/317 (13.9 %) 29/339 (8.6 %) 34/307 (11.1 %) 26/334 (7.8 %) 44/320 (13.8 %) 48/311 (15.4 %) 61/336 (18.2 %) 107/319 (33.5 %) 393/2583 (15.2 %)
Critical
Care
(2015) 19:270
Page
9
of
Table 3ICU mortality (percentage and numbers) per stratum of standard deviation of serum glucose and serum potassium concentrations during the TGC period
SD potassium 1 (0.00-0.22) 2 (0.23-0.28) 3 (0.29-0.34) 4 (0.35-0.39) 5 (0.40-0.45) 6 (0.46-0.53) 7 (0.54-0.66) 8 (0.67-2.11)
n=323 n=291 n=370 n=298 n=330 n=312 n=337 n=322 Total
SD glucose 1 (0.00-0.99 n=318 12/318 (3.8 %)
2 (1.00-1.23) n=330 34/330 (10.3 %)
3 (1.24-1.42) n=318 33/318 (10.4 %)
4 (1.43-1.61) n=336 32/336 (9.5 %)
5 (1.62-1.81) n=311 57/311 (18.3 %)
6 (1.82-2.12) n=322 68/322 (21.1 %)
7 (2.13-2.60) n=323 66/323 (20.4 %)
8 (2.61-24.45) n=325 91/325 (28.0 %)
Total n=2583 12/323 (3.7 %) 20/291 (6.9 %) 20/370 (5.4 %) 19/298 (6.4 %) 33/330 (10.0 %) 67/312 (21.5 %) 89/337 (26.4 %) 133/322 (41.3 %) 393/2583 (15.2 %)
Critical
Care
(2015) 19:270
Page
10
of
relevant as it is known that many medications may influence both serum glucose and/or serum potassium concentrations [38–41]. Beta2-sympathicomimetics, for example, may in-duce hypokalemia and beta2-sympathicomimetics are widely
used in the ICU [42]. The use of co-medications, however, is not supposed to vary between the conventional and TGC period to an extent that would have influenced the outcome measures.
Conclusion
In conclusion, our study shows that the TGC protocol that was implemented was not associated with increased risk of serum-potassium-related events. A reduction in ICU mortality due to TGC could not be confirmed. During TGC, both low and high serum glucose and low and high mean serum potassium concentrations are predictors of a high ICU mortality rate. The same applies for high variability in both serum glucose and serum potassium concentrations.
Key messages
Implementation led to 4.7 times more frequent measurement of glucose concentrations but the number of potassium measurements increased only 1.2 times.
Both low and high mean glucose concentrations and low and high mean potassium concentrations predicted a high mortality rate in ICU patients. The same applies for the variability of glucose and potassium concentrations.
The TGC protocol that was implemented was not associated with increased risk of hypokalemia.
Additional file
Additional file 1:Details of the tight glucose protocol.
Abbreviations
MAG:Mean absolute glucose per hour.; SAS: Statistical Analysis System; SPSS: Statistical Package for the Social Sciences; TGC: tight glucose control; UMCU: University Medical Center Utrecht; UPOD: Utrecht Patient Oriented Database.
Competing interests
The authors do not have a potential conflict of interest. The Division of Pharmacoepidemiology and Pharmacotherapy employing authors AL, WvS. and TE have received unrestricted funding for pharmacoepidemiological research from GlaxoSmithKline, Novo Nordisk, the private–public-funded Top Institute Pharma (http://www.tipharma.com) (includes co-funding from universities, government, and industry), the Dutch Medicines Evaluation Board, and the Dutch Ministry of Health.
Authors’contributions
EU conceived of the study, was responsible for the acquisition of the data, performed data analysis and drafted the manuscript, JZ conceived of the study, participated in the design of the study and helped to draft the manuscript, DL participated in the design of the study and critically revised
the manuscript, AL participated in the design of the study, performed statistical support for the study, helped in the data analysis and critically revised the manuscript, WvS participated in the design of the study and critically revised the manuscript, TE conceived of the study, participated in the design of the study and critically revised the manuscript. All authors read and approved the final manuscript.
Acknowledgements
The authors are grateful to Hanneke den Breeijen for the data analysis and to their colleagues at the Utrecht Institute for Pharmaceutical Sciences and the UMC Utrecht for their support in establishing and maintaining UPOD.
Author details
1Department of Clinical Pharmacy, University Medical Centre Utrecht, PO box 855003508GA, Utrecht, The Netherlands.2Division of Pharmacoepidemiology and Clinical Pharmacology, Utrecht Institute for Pharmaceutical Sciences, Faculty of Science, Utrecht University, Utrecht, The Netherlands.3Intensive Care Centre, University Medical Centre Utrecht, Utrecht, The Netherlands. 4Department of Clinical Chemistry and Haematology, University Medical Centre Utrecht, Utrecht, The Netherlands.
Received: 2 February 2015 Accepted: 20 May 2015
References
1. Lepper PM, Ott S, Nüesch E, Von Eynatten M, Schumann C, Pletz MW, et al. Serum glucose levels for predicting death in patients admitted to hospital for community acquired pneumonia: prospective cohort study. BMJ. 2012;344:e3397.
2. Brownlee M. Biochemistry and molecular cell biology of diabetic complications. Nature. 2001;414:813–20.
3. Weekers F, Giulietti AP, Michalaki M, Coopmans W, Van Herck E, Mathieu C, et al. Metabolic, endocrine and immune effects of stress hyperglycemia in a rabbit model of prolonged critical illness. Endocrinology. 2003;144:5329–38. 4. Mizock BA. Alterations in carbohydrate metabolism during stress: A review
of the literature. Am J Med. 1995;98:75–84.
5. Van Cromphaut SJ. Hyperglycaemia as part of the stress response: the underlying mechanisms. Best Pract Res Clin Anaesthesiol. 2009;23:375–86. 6. Dungan KM, Braithwaite SS, Preiser JC. Stress hyperglycaemia. Lancet.
2009;373:1798–807.
7. Van den Berghe G. How does blood glucose control with insulin save lives in intensive care? J Clin Invest. 2004;114:1187–95.
8. Van den Berghe G, Wouters P, Weekers F, Verwaest C, Bruyninckx F, Schetz M, et al. Intensive insulin therapy in critically ill patients. N Engl J Med. 2001;345:1359–67.
9. Van den Berghe G, Wilmer A, Hermans G, Meersseman W, Wouters PJ, Milants I, et al. Intensive insulin therapy in the medical ICU. N Engl J Med. 2006;354:449–61.
10. De La Rosa GDC, Donado JH, Restrepo AH, Quintero AM, González LG, Saldarriaga NE, et al. Strict glycaemic control in patients hospitalised in a mixed medical and surgical intensive care unit: a randomised clinical trial. Crit Care. 2008;12:R120.
11. Arabi YM, Dabbagh OC, Tamim HM, Al-Shimemeri AA, Memish ZA, Haddad SH, et al. Intensive versus conventional insulin therapy: a randomized controlled trial in medical and surgical critically ill patients. Crit Care Med. 2008;36:3190–7.
12. The NICE-SUGAR Study Investigators. Intensive versus conventional glucose control in critically ill patients. N Engl J Med. 2009;360:1283–97.
13. Van den Berghe G, Mesotten D, Vanhorebeek I. Intensive insulin therapy in the intensive care unit. CMJA. 2009;180:799–800.
14. Friedrich JO, Chant C, Adhikari NKJ. Does intensive insulin therapy really reduce mortality in critically ill surgical patients? A reanalysis of meta-analytic data. Crit Care. 2010;14:324–30.
15. Wiener SR, Wiener D, Larson R. Benefits and risks of tight glucose control in critically ill adults. JAMA. 2008;300:933–44.
16. Kansagara D, Fu R, Freeman M, Wolf F, Helfand M. Intensive insulin therapy in hospitalized patients: a systematic review. Ann Intern Med. 2011;154:268–82. 17. Bagshaw SM, Bellomo R, Jacka MJ, Egi M, Hart GK, George C. The impact of
18. Quagliaro L, Piconi L, Assaloni R, Martinelli L, Motz E, Ceriello A. Intermittent high glucose enhances apoptosis related to oxidative stress in human umbilical vein endothelial cells: the role of protein kinase C and NAD(P)H-oxidase activation. Diabetes. 2003;52:2795–804.
19. Monnier L, Mas E, Ginet C, Michel F, Villon L, Cristol JP, et al. Activation of Oxidative Stress by Acute Glucose Fluctuations Compared With Sustained Chronic Hyperglycemia in Patients With Type 2 Diabetes. JAMA. 2006;295:1681–7.
20. Egi M, Bellomo R, Stachowski E, French CJ, Hart G. Variability of Blood Glucose Concentration and Short-term Mortality in Critically Ill Patients. Anesthesiology. 2006;105:244–52.
21. Krinsley JS. Glycemic variability: A strong independent predictor of mortality in critically ill patients. Crit Care Med. 2008;36:3008–13.
22. Ali NA, O'Brien JM, Dungan K, Phillips G, Marsh CB, Lemeshow S, et al. Glucose variability and mortality in patients with sepsis. Crit Care Med. 2008;36:2316–21.
23. Eslami S, Taherzadeh Z, Schultz M, Abu-Hanna A. Glucose variability measures and their effect on mortality: a systematic review. Int Care Med. 2011;37:583–93.
24. Van den Berghe G, Schetz M, Vlasselaers D, Hermans G, Wilmer A, Bouillon R, et al. Intensive insulin therapy in critically ill patients: NICE-SUGAR or Leuven blood glucose target? J Clin Endocrin Metab. 2009;94:3163–70. 25. Finfer SR. Flawed assumptions about clinical trials. Unpublished online letter
Br J. Anaesth 2014, http://bja.oxfordjournals.org/content/113/5/737.full/ reply#brjana_el_Finfer.
26. The NICE-SUGAR Study Investigators. Hypoglycemia and risk of death in critically ill patients. N Engl J Med. 2012;367:1108–18.
27. Onyenweni AJ, Winterstein AG. Rates of hypokalaemia after implementation of aggressive insulin dosing in critical care patients. Pharmacoepidemiol Drug Saf. 2007;16:S011.
28. Ten Berg MJ, Huisman A, Van den Bemt PM, Schobben AF, Egberts AC, Van Solinge WW. Linking laboratory and medication data: new opportunities for pharmacoepidemiological research. Clin Chem Lab Med. 2007;45:13–9.
29. Wagner AK, Soumerai SB, Zhang F, Ross-Degnan D. Segmented regression analysis of interrupted time series studies in medical use research. J Clin Pharm Therapeut. 2002;27:299–309.
30. Hermanides J, Bosman RJ, Vriesendorp TM, Dotsch R, Rosendaal FR, Zandstra DF, et al. Hypoglycemia is associated with intensive care unit mortality. Crit Care Med. 2010;38:1430–4.
31. Kosiborod M, Inzucchi SE, Goyal A, Krumholz HM, Masoudi FA, Xiao L, et al. Relationship between spontaneous and iatrogenic hypoglycemia and mortality in patients hospitalized with acute myocardial infarction. JAMA. 2009;301:1556–64.
32. Vlasselaers D, Milants I, Desmet L, Wouters PJ, Vanhorebeek I, van den Heuvel I, et al. Intensive insulin therapy for patients in paediatric intensive care: a prospective, randomised controlled study. Lancet. 2009;373:547–56.
33. Paltiel O, Salakhov E, Ronen I, Berg D, Israeli A. Management of severe hypokalaemia in hospitalized patients. Arch Int Med. 2001;161:108995. 34. Mesotten D, Gielen M, Sterken C, Claessens K, Hermans G, Vlasselaers D.
Neurocognitive development of children 4 years after critical illness and treatment with tight glucose control: a randomized controlled trial. JAMA. 2012;308:1641–50.
35. Lipton JA, Barendse RJ, Van Domburg RT, Schinkel AF, Boersma H, Simoons MI, et al. Hyperglycemia at admission and during hospital stay are independent risk factors for mortality in high risk cardiac patients admitted to an intensive cardiac care unit. Eur Heart J Acute Cardiovasc Care. 2013;2:306–13.
36. Hessels L, Hoekstra M, Mijzen LJ, Vogelzang M, Dieperink W, Lansink A, et al. The relationship between serum potassium, potassium variability and in-hospital mortality in critically ill patients and a before-after analysis on the impact of computer-assisted potassium control. Crit Care. 2015;19:4. Epub 21 Jan 2015.
37. Xu Q, Xu F, Fan L, Xiong L, Li H, Cao S, et al. Serum potassium levels and its variability in incident peritoneal dialysis patients: Associations with mortality. Plos one. 2014;9:e86750.
38. Rimmer JM, Horn JF, Gennari J. Hyperkalaemia as a complication of drug therapy. Arch Intern Med. 1987;147:867–9.
39. Paice BJ, Paterson KR, Onyanga-Omara F, Donnelly T, Gray JM, Lawson DH. Record linkage study of hypokalaemia in hospitalized patients. Postgrad Med J. 1986;62:187–91.
40. Salem CB, Fathallah N, Hmouda H, Bouraoui K. Drug-Induced Hypoglycaemia, an update. Drug Saf. 2011;34:21–45.
41. Luna B, Feinglos MN. Drug-induced hyperglycemia. JAMA. 2001;286:1945–8. 42. Zanen P. Dalingen van het kaliumgehalte in het serum ten gevolge van
ß2-sympathicomimetica. Ned Tijdschr Geneeskd. 1990;134:688–91. Dutch.
Submit your next manuscript to BioMed Central and take full advantage of:
• Convenient online submission
• Thorough peer review
• No space constraints or color figure charges
• Immediate publication on acceptance
• Inclusion in PubMed, CAS, Scopus and Google Scholar
• Research which is freely available for redistribution