R E S E A R C H A R T I C L E
Open Access
Antimicrobial co-resistance patterns of
gram-negative bacilli isolated from bloodstream
infections: a longitudinal epidemiological study
from 2002
–
2011
Patrick HP Wong
1*, Marcus von Krosigk
2, Diane L Roscoe
3,4, Tim TY Lau
1,2, Masoud Yousefi
5and William R Bowie
1*Abstract
Background:Increasing multidrug resistance in gram-negative bacilli (GNB) infections poses a serious threat to public health. Few studies have analyzed co-resistance rates, defined as an antimicrobial susceptibility profile in a subset already resistant to one specific antibiotic. The epidemiologic and clinical utility of determining co-resistance rates are analyzed and discussed.
Methods:A 10-year retrospective study from 2002–2011 of bloodstream infections with GNB were analyzed from three hospitals in Greater Vancouver, BC, Canada. Descriptive statistics were calculated for antimicrobial resistance and co-resistance. Statistical analysis further described temporal trends of antimicrobial resistance, correlations of resistance between combinations of antimicrobials, and temporal trends in co-resistance patterns.
Results:The total number of unique blood stream isolates of GNB was 3280. Increasing resistance to individual antimicrobials was observed forE. coli,K. pneumoniae,K. oxytoca,E. cloacae, andP. aeruginosa. Ciprofloxacin resistance inE. colipeaked in 2006 at 40% and subsequently stabilized at 29% in 2011, corresponding to decreasing ciprofloxacin usage after 2007, as assessed by defined daily dose utilization data. High co-resistance rates were observed for ceftriaxone-resistantE. coliwith ciprofloxacin (73%), ceftriaxone-resistantK. pneumoniaewith trimethoprim-sulfamethoxazole (83%), ciprofloxacin-resistantE. cloacaewith ticarcillin-clavulanate (91%), and piperacillin-tazobactam-resistantP. aeruginosawith ceftazidime (83%).
Conclusions:Increasing antimicrobial resistance was demonstrated over the study period, which may partially be associated with antimicrobial consumption. The study of co-resistance rates in multidrug resistant GNB provides insight into the epidemiology of resistance acquisition, and may be used as a clinical tool to aid prescribing empiric antimicrobial therapy.
Keywords:Co-resistance, Multi-drug resistance, Gram-negative bacilli, Bloodstream infections, Antibiograms
Background
Gram-negative bacilli (GNB) are a significant cause of in-fection in community and nosocomial settings [1]. Besides inherent and chromosomally mediated mechanisms of re-sistance, the development of multidrug resistance in GNB is further facilitated by the acquisition of plasmids,
integrons and transposons carrying resistance genes, which is typically a consequence of selective antimicrobial pres-sure exerted by prolonged antibiotic use [2]. It is also becoming increasingly common to find multiple re-sistance genes that are linked together, thus antibiotics from unrelated classes may contribute to the selective pressures and maintain the expression of these multidrug resistant genes [3,4].
The Infectious Diseases Society of America views anti-microbial resistance as a serious threat to public health, patient safety and national security, and has published * Correspondence:phpwong@mail.ubc.ca;william.bowie@ubc.ca
1Division of Infectious Diseases, Department of Medicine, Faculty of
Medicine, The University of British Columbia (UBC), 452D, Heather Pavilion East, VGH, 2733 Heather Street, Vancouver, BC V5Z 3J5, Canada Full list of author information is available at the end of the article
policy recommendations for the US Congress to address the rising rates of antibiotic resistance together with de-clining approvals of new antibiotics [5]. Pop-Vicas and D’Agata (2005) have emphasized the need to further ex-pand our understanding of the dynamics of transmis-sion of these multidrug resistant pathogens to determine whether it is related to cross transmission from humans to humans or antimicrobial selective pressures [6]. Kallen and Srinivasan (2010) have also highlighted the import-ance for ongoing surveillimport-ance of the incidence and epi-demiology of multidrug resistant GNB [1].
Several studies have shown an increasing incidence of multidrug resistant GNB [7-9]. However, to our know-ledge, few studies provide a comprehensive evaluation of co-resistance patterns with antimicrobial agents com-monly used to treat GNB. Co-resistance is defined in this study as the antimicrobial susceptibility profile in a subset of isolates already resistant to a specific antibiotic, and provides a different means for monitoring multidrug re-sistance and displaying observed trends, such as increasing multidrug resistance in P. aeruginosa that are resistant to ciprofloxacin [10-12]. The study of co-resistance can thus be quite broad and not limited to isolates that are known to harbour multidrug resistance, such as those with ESBLs. From a clinical perspective, co-resistance should be taken into consideration when prescribing empiric therapy for pa-tients being treated for specific GNB where local antimicro-bial resistance rates are significant, and in patients who have been exposed to prior courses of antimicrobial agents.
The aim of our study is to examine the antimicrobial co-resistance patterns of GNB bloodstream isolates over a 10-year time period in order to document changes in sus-ceptibility patterns, and to identify any potential causes when significant changes occur. The utility of the informa-tion gathered would be applicable in clinical practice when tailoring empiric antibiotic treatment.
Methods
We conducted a 10-year retrospective study from Jan 2002 to Dec 2011 to quantify the trends of resistance and co-resistance patterns in GNB isolated from bloodstream infections at Vancouver Coastal Health (VCH), which in-cludes Vancouver General Hospital (VGH) (a 950-bed ter-tiary care teaching hospital with 21,000 admissions per year), Richmond Hospital (a 175-bed community hospital), and Lion's Gate Hospital (a 268-bed community hospital). The study was approved by the University of British Columbia Clinical Research Ethics Board and by the Van-couver Coastal Health Research Institute.
Utilizing the VCH laboratory information system, Sunquest®, which stores laboratory data in the Sunset® data-base, a report was generated to identify all positive blood cultures with GNB from 2002–2011. Further refinement was performed through computer programming to include
only one bacterial isolate of the same identification (genus and species) and susceptibility pattern per patient per cal-endar year in the analysis. The first unique patient isolate from the first admission during each study year was used in cases where multiple isolates of the same genus, species and susceptibility pattern were identified. When multiple cultures taken from the same patient had the same GNB identified but with any difference in susceptibility patterns, these were considered unique isolates and were included in the analysis. The Sunquest® system started to incorpor-ate data for Richmond Hospital in April 2005 and Lion's Gate Hospital in August 2007. Annual review of the anti-microbial susceptibility patterns from the individual hospi-tals in this study do not differ significantly from each other and inclusion of additional sites over the study period was not felt to influence results.
Identification and susceptibility testing were performed using commercially available automated systems [BD Phoenix™(Sep 2009 to study end date) or Siemens Micro-Scan® (2002 to Sept 2009) systems]. Quality control measures were implemented during the changeover of automated systems in 2009 for validation and verification to ensure that the results on both systems were concordant within acceptable limits. Antibiotic susceptibility testing was performed and interpreted using guidelines and interpretive breakpoints for susceptible, intermediate, and resistant categories established by the Clinical and Laboratory Stan-dards Institute (CLSI). All antimicrobial susceptibility results that fell into the intermediate category were presumed to be resistant for the purposes of this study. Guidelines for sus-ceptibility breakpoints for cephalosporins were changed after 2010, but the laboratory did not change to the new guidelines since the panels for the commercial system in use did not have concentration wells that were low enough to allow interpretation at the lower breakpoints [13].
The data collected was extrapolated from Sunset® into a Microsoft Access® database. Queries and reports of indi-vidual antimicrobial resistance and co-resistance patterns were generated to supply descriptive statistics for each specific study year and pathogen. Pharmacy data on inpatient antimicrobial consumption at VGH in the form of defined daily doses (DDDs) were compared against antimicrobial resistance results. Statistical analysis was performed to determine linear-to-linear temporal trends of individual antimicrobial resistance patterns. In addition, Pearson correlation coefficients were determined for asso-ciations between resistant combinations of antimicrobial agents, and Pearson Chi-square test was performed to assess for temporal trends in co-resistance patterns. P values of≤0.05 were used for statistical significance in all cases.
Results
annually from 109 (2002) to 463 (2010). The five most common GNB isolated were Escherichia coli, Klebsiella pneumoniae,Klebsiella oxytoca,Enterobacter cloacae, and
Pseudomonas aeruginosa, and the proportion of each is il-lustrated in Figure 1. The temporal trends of resistance to commonly used antibiotics for each of these organisms are illustrated by line graphs in Figure 2.
ForE. coli(Figure 2a), overall trends of increasing resist-ance to cefazolin and ceftriaxone were observed over time. Resistance to piperacillin-tazobactam remained stable at 4% from 2009 to 2011; it replaced ticarcillin-clavulanate on the hospital formulary in 2009. Resistance to ciproflox-acin and trimethroprim-sulfamethoxazole (TMP-SMX) both peaked during 2006 at roughly 40% and stabilized at lower levels of 29% and 34% respectively in 2011. Compar-ing this with antimicrobial consumption data (Figure 3), use of ciprofloxacin peaked in 2007 at 23,800 DDD and decreased to 10,100 DDD in 2011, whereas TMP-SMX consumption peaked in 2007 at 5,100 DDD, dropped to 4,200 DDD in 2009, and has increased back to 6,700 DDD in 2011. A subgroup analysis of ESBL E. coli(total of 54 isolates in 2010 and 2011) revealed the following resist-ance rates: ciprofloxacin (83%), piperacillin-tazobactam (17%), TMP-SMX (76%), gentamicin (52%), ceftriaxone (100%), and imipenem (0%). In contrast, non-ESBLE. coli
(total of 414 isolates in 2010 and 2011) had lower resist-ance rates: ciprofloxacin (21%), piperacillin-tazobactam (2%), TMP-SMX (26%), gentamicin (8%), ceftriaxone (3%), and imipenem (0%).
ForK. pneumoniae(Figure 2b), overall trends of increas-ing resistance were observed with cefazolin, ceftriaxone
and piperacillin-tazobactam. Subgroup analysis for ESBL
K. pneumoniae(total of 12 isolates in 2010 and 2011) re-vealed the following resistance rates: ciprofloxacin (50%), piperacillin-tazobactam (42%), TMP-SMX (50%), gentami-cin (42%), ceftriaxone (100%), and imipenem (0%). In con-trast, non-ESBL K. pneumoniae (total of 118 isolates in 2010 and 2011) had lower resistance rates: ciprofloxacin (10%), piperacillin-tazobactam (4%), TMP-SMX (8%), gen-tamicin (2%), ceftriaxone (2%), and imipenem (1%).
For K. oxytoca (Figure 2c), increasing rates of resist-ance to ceftriaxone, ciprofloxacin, TMP-SMX, and piperacillin-tazobactam were observed. ForE. cloacae(Figure 2d), re-sistance rates increased with ceftriaxone, TMP-SMX, and ciprofloxacin, but remained relatively stable with piperacillin-tazobactam. ForP. aeruginosa(Figure 2e), resistance rates to ceftazidime, ciprofloxacin, and piperacillin-tazobactam all increased. P. aeruginosa resistance to imipenem was 4.2% during 2007–2011 (from a baseline of 0% in 2002– 2006).
Chi-square trend tests were performed to determine which temporal patterns of antimicrobial resistance fit into a linear-by-linear association model. Linear-by-linear trends were identified with cefazolin resistance in E. coli
(X2= 9.062, p < 0.003), ceftriaxone resistance inE. coli(X2= 13.070, p < 0.001), cefazolin resistance in K. pneumoniae
(X2= 15.183, p < 0.001), ceftriaxone resistance in K. pneumoniae (X2= 18.066, p < 0.001), piperacillin-tazobactam resistance in K. pneumoniae (X2= 5.485, p < 0.019), and cefazolin resistance in K. oxytoca (X2= 4.329, p < 0.037). Other temporal patterns that approached significance in a linear-by-linear association model include ciprofloxacin resistance inK. pneumoniae(X2= 3.656, p = 0.056), TMP-SMX resistance in K. oxytoca (X2= 3.576, p = 0.059), ticarcillin-clavulanate resistance in K. pneumoniae (X2= 3.716, p = 0.054), and ceftazidime resistance in P. aerugi-nosa (X2= 3.213, p = 0.073). The temporal trend models for E. coli resistant to ciprofloxacin and SMX-TMP are curvilinear with calculated departure of linearity as a chi-square for ciprofloxacin is 22.611 on 8df (p < 0.0039), and for TMP-SMX is 15.31 on 8df (p = 0.053).
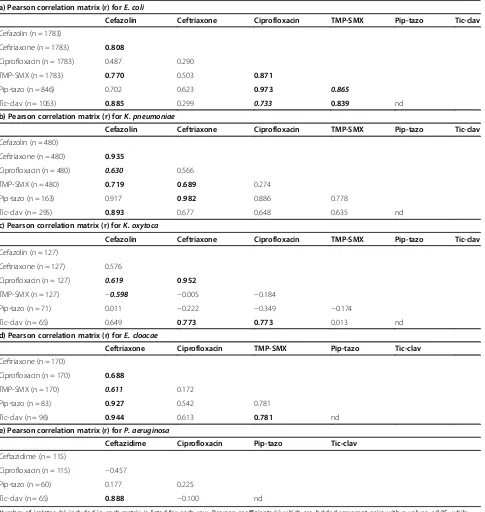
[image:3.595.56.292.472.692.2]The second part of the analysis involved looking at correlation patterns of resistance between various pairs of antibiotics, which is commonly reported in other pub-lications but does not provide information regarding co-resistance as defined in this study. In E. coli (Table 1a), high correlations of resistance were identified between several combinations of antimicrobial agents including piperacillin-tazobactam with ciprofloxacin (r = 0.973), ticarcillin-clavulanate with cefazolin (r = 0.885), TMP-SMX with ciprofloxacin (r = 0.871), ticarcillin-clavulanate with TMP-SMX (r = 0.839), and ceftriaxone with cefazolin (r = 0.808). InK. pneumoniae(Table 1b), highest correlations of resistance were seen between piperacillin-tazobactam with ceftriaxone (r = 0.982), ceftriaxone with cefazolin (r = 0.935), Figure 1Distribution of gram-negative bacilli isolated from
Figure 2Temporal patterns of resistance to selected antimicrobial agents for a)E. coli, b)K. pneumoniae, c)K. oxytoca, d)E. cloacae, and e)P. aeruginosa.Antimicrobial resistance rates were analyzed yearly forE. coliandK. pneumoniae, and combined into two time groups of 2002–06 and 2007–11 forK. oxytoca,E. cloacae, andP. aeruginosadue to lower isolate numbers. Number of isolates for each GNB is listed below the corresponding year or time groups. Y-axis represents resistance in percentage. Note: Pip-tazo is piperacillin-tazobactam, TMP-SMX is trimethoprim-sulfamethoxazole, Tic-clav is ticarcillin-clavulanate.
[image:4.595.59.540.471.707.2]and ticarcillin-clavulanate with cefazolin (r = 0.893). In
K. oxytoca (Table 1c), highest correlations of resistance were between ciprofloxacin with ceftriaxone (r = 0.952), ticarcillin-clavulanate with ceftriaxone (r = 0.773), and ticarcillin-clavulanate with ciprofloxacin (r = 0.773). In
[image:5.595.58.543.111.623.2]E. cloacae (Table 1d), highest correlations of resistance were observed between ticarcillin-clavulanate with ceftri-axone (r = 0.944), piperacillin-tazobactam with ceftriceftri-axone (r = 0.927), and ticarcillin-clavulanate with TMP-SMX (r = 0.781). Finally, inP. aeruginosa(Table 1e), resistance Table 1 Pearson correlation matrixes showing Pearson correlation coefficients (r) of resistance between pairs of antibiotics for a)E. coli, b)K. pneumonia, c)K. oxytoca, d)E. cloacae, e)P. aeruginosa
a) Pearson correlation matrix (r) forE. coli
Cefazolin Ceftriaxone Ciprofloxacin TMP-SMX Pip-tazo Tic-clav
Cefazolin (n = 1783)
Ceftriaxone (n = 1783) 0.808
Ciprofloxacin (n = 1783) 0.487 0.290
TMP-SMX (n = 1783) 0.770 0.503 0.871
Pip-tazo (n = 846) 0.702 0.623 0.973 0.865
Tic-clav (n = 1063) 0.885 0.299 0.733 0.839 nd
b) Pearson correlation matrix (r) forK. pneumoniae
Cefazolin Ceftriaxone Ciprofloxacin TMP-SMX Pip-tazo Tic-clav
Cefazolin (n = 480)
Ceftriaxone (n = 480) 0.935
Ciprofloxacin (n = 480) 0.630 0.566
TMP-SMX (n = 480) 0.719 0.689 0.274
Pip-tazo (n = 163) 0.917 0.982 0.886 0.778
Tic-clav (n = 295) 0.893 0.677 0.648 0.635 nd
c) Pearson correlation matrix (r) forK. oxytoca
Cefazolin Ceftriaxone Ciprofloxacin TMP-SMX Pip-tazo Tic-clav
Cefazolin (n = 127)
Ceftriaxone (n = 127) 0.576
Ciprofloxacin (n = 127) 0.619 0.952
TMP-SMX (n = 127) −0.598 −0.005 −0.184
Pip-tazo (n = 71) 0.011 −0.222 −0.349 −0.174
Tic-clav (n = 65) 0.649 0.773 0.773 0.013 nd
d) Pearson correlation matrix (r) forE. cloacae
Ceftriaxone Ciprofloxacin TMP-SMX Pip-tazo Tic-clav
Ceftriaxone (n = 170)
Ciprofloxacin (n = 170) 0.688
TMP-SMX (n = 170) 0.611 0.172
Pip-tazo (n = 83) 0.927 0.542 0.781
Tic-clav (n = 96) 0.944 0.613 0.781 nd
e) Pearson correlation matrix (r) forP. aeruginosa
Ceftazidime Ciprofloxacin Pip-tazo Tic-clav
Ceftazidime (n = 115)
Ciprofloxacin (n = 115) −0.457
Pip-tazo (n = 60) 0.177 0.225
Tic-clav (n = 65) 0.888 −0.100 nd
Number of isolates (n) included in each matrix is listed for each row. Pearson coefficients (r) which are bolded represent pairs with p values≤0.05, while those that are bolded and italicized trended towards significance with p values > 0.05≤0.07. Note: TMP-SMX is trimethoprim-sulfamethoxazole, Pip-tazo is piperacillin-tazobactam, Tic-clav is ticarcillin-clavulanate; nd is not determined as isolates did not consistently have both Pip-tazo and Tic-clav
to ticarcillin-clavulanate was highly correlated with ceftaz-idime resistance (r = 0.888).
The final part of our analysis involved selecting out a group of isolates that were resistant to one specific microbial agent and then examining that group's anti-microbial susceptibility profile–the co-resistance pattern. In E. coli(Table 2a), those that are resistant to ceftriax-one have a 73% probability of also exhibiting resistance to ciprofloxacin. In contrast, for those that are resistant to ciprofloxacin, only 25% are also resistant to ceftriax-one. Other high co-resistance rates found inE. coli were piperacillin-tazobactam-resistant strains that are co-resistant with TMP-SMX (77%), piperacillin-tazobactam-resistant strains that are co-resistant with ciprofloxacin (71%), and ceftriaxone-resistant strains that are co-resistant with TMP-SMX (69%). To assess temporal patterns, Pearson Chi-Square tests were performed to analyze whether co-resistance rates remained stable or changed significantly over time. Over time comparing the periods of 2002–2006 and 2007–2011, the rate of ceftriaxone-resistant E. coli
that are co-resistant with ciprofloxacin has been stable around 73% (X2= 0.005, p = 0.941) suggesting no signifi-cant change. However, the rate of ciprofloxacin-resistant
E. colithat are co-resistant with ceftriaxone has increased from 16% to 30% (X2= 12.103, p < 0.001).
ForK. pneumoniae(Table 2b), high co-resistance rates were seen with ceftriaxone-resistant strains that are co-resistant with TMP-SMX (83%), ceftriaxone-co-resistant strains that are co-resistant with ciprofloxacin (60%), and piperacillin-tazobactam-resistant strains that are co-resistant with ceftriaxone (60%). ForK. oxytoca(Table 2c), high co-resistance was seen between ciprofloxacin-resistant strains with ceftriaxone (60%), however it is important to note that only 5 isolates ofK. oxytocawere analyzed.
ForE. cloacae(Table 2d), highest co-resistance rates were observed with piperacillin-tazobactam-resistant strains that are co-resistant with ceftriaxone (100%), ciprofloxacin-resistant strains that are co-ciprofloxacin-resistant with ticarcillin-clavulanate (91%), ceftriaxone-resistant strains that are co-resistant with ticarcillin-clavulanate (81%), and TMP-SMX resistant strains that are co-resistant with ticarcillin-clavulanate (80%).
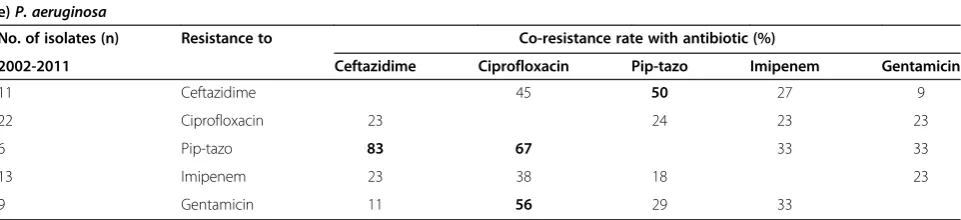
InP. aeruginosa(Table 2e), high co-resistance rates were observed with piperacillin-tazobactam-resistant strains that are co-resistant with ceftazidime (83%), and piperacillin-tazobactam-resistant strains that are co-resistant with ciprofloxacin (67%). It has been previously observed that
P. aeruginosa resistant to fluoroquinolones are often associated with resistance to other antibiotic classes [10,12]. Interestingly, our results do not suggest a particu-larly high co-resistance profile in ciprofloxacin-resistant
P. aeruginosa with co-resistance rates of 23-24% with gentamicin, imipenem, ceftazidime, and piperacillin-tazobactam.
Discussion
To our knowledge, this is one of the largest studies com-prehensively evaluating antimicrobial co-resistance in GNB isolated from bloodstream infections. In the first part of our study, an unanticipated finding in our results was that both ciprofloxacin and TMP-SMX resistance
peaked in 2006 for E. coli, and has subsequently
de-creased and stabilized.
Our experience at VGH is that there had previously been heavy consumption of ciprofloxacin during the time period when the resistance peaked, which suggests this selective pressure may have contributed to this ob-servation. We reviewed consumption data of antibiotics at VGH based on inpatient utilization data (Figure 3), and determined that the (DDD) of ciprofloxacin was stable at 23,000-24,000 from 2002–2004, decreasing to 17,000 in 2005, increasing back to 23,800 in 2007, and has since decreased to 10,100 in 2011. In comparison for ceftriaxone utilization, the DDD has continually increased from 3,300 to 7,200 from 2002 to 2011. The utilization data supports that resistance rates ofE. colito ciprofloxa-cin and ceftriaxone correlate with consumption patterns of antibiotics during that period, which peaked in 2007 and 2011, respectively (Figure 2a). The DDD for TMP-SMX is also of interest in that there were two consump-tion peaks–5,100 in 2007 and 6,700 in 2011, which again correlates with resistance peaks in our E. coli resistance data and provides further support that resistance pat-terns may be associated with antimicrobial consump-tion (Figure 2a). As most of the GNB isolates were collected from VGH, the changes in resistance patterns are most attributable to the antimicrobial consumption at that site. In general, the antimicrobial consumption data collected from VGH is representative of the usage at the other two smaller hospitals sites.
When looking at antimicrobial resistance patterns of
Table 2 Summary of antimicrobial co-resistance rates determined for a)E. coli, b)K. pneumoniae, c)K. oxytoca, d)E. cloacae, and e)P. aeruginosa
a)E. coli
No. of isolates (n) Resistance to Co-resistance rate with antibiotic (%)
2002-06 Ceftriaxone Ciprofloxacin Pip-tazo TMP-SMX Tic-clav
44 Ceftriaxone 73 14 59 59
194 Ciprofloxacin 16 8 62 31
3 Pip-tazo 33 67 67 nd
193 TMP-SMX 13 63 8 31
91 Tic-clav 29 67 nd 66
2007-11
146 Ceftriaxone 73 18 72 48
357 Ciprofloxacin 30 10 58 26
28 Pip-tazo 57 71 79 nd
373 TMP-SMX 28 56 10 27
64 Tic-clav 42 61 nd 61
2002-11
190 Ceftriaxone 73 18 69 53
551 Ciprofloxacin 25 10 60 29
31 Pip-tazo 55 71 77 nd
566 TMP-SMX 23 58 9 30
155 Tic-clav 34 65 nd 64
b)K. pneumoniae
No. of isolates (n) Resistance to Co-resistance rate with antibiotic (%)
2002-2011 Ceftriaxone Ciprofloxacin Pip-tazo TMP-SMX Tic-clav
20 Ceftriaxone 60 35 83 53
54 Ciprofloxacin 22 22 46 29
10 Pip-tazo 60 50 40 nd
44 TMP-SMX 30 57 16 37
19 Tic-clav 26 58 nd 53
c)K. oxytoca
No. of isolates (n) Resistance to Co-resistance rate with antibiotic (%)
2002-2011 Ceftriaxone Ciprofloxacin Pip-tazo TMP-SMX Tic-clav
8 Ceftriaxone 38 20 25 50
5 Ciprofloxacin 60 0 20 25
2 Pip-tazo 50 0 0 nd
5 TMP-SMX 40 20 0 100
3 Tic-clav 67 33 nd 33
d)E. cloacae
No. of isolates (n) Resistance to Co-resistance rate with antibiotic (%)
2002-2011 Ceftriaxone Ciprofloxacin Pip-tazo TMP-SMX Tic-clav
43 Ceftriaxone 26 47 37 81
17 Ciprofloxacin 65 17 59 91
9 Pip-tazo 100 11 11 nd
24 TMP-SMX 67 42 6 80
Disease Society of America (IDSA) guideline for uncom-plicated cystitis now recommends fluoroquinolone anti-biotics as alternative agents only when other urinary tract infection therapies cannot be used [15]. As seen by our utilization data at VGH, in the hospital setting where pa-tients are more ill in general, physicians are now prescrib-ing less ciprofloxacin as empiric antimicrobial therapy because of the high rates of resistance in both inpatient and outpatient settings.
A further clinical utility of determining co-resistance rates is to aid in the selection of empiric antimicrobial coverage. For example, patients with suspected urinary tract infection are often started on TMP-SMX while pending culture results. However, if the patient deterio-rates and is not responding clinically, one would have to decide which antibiotic to use to broaden the coverage. In the periods from 2002–2006, co-resistance of E. coli
to ceftriaxone was only 13%, so it may have been appro-priate to switch to this antibiotic. However, co-resistance of E. coli to ceftriaxone was 28% in 2007–2011, thus it may be more reasonable based on our results to switch to piperacillin-tazobactam which has a co-resistance rate of only 10%. This is of particular importance with the ad-vances in bacterial identification techniques, such as
Matrix Assisted Laser Desorption Ionization – Time of
Flight (MALDI-TOF) where bacterial species are identi-fied on average 1.45 days earlier than traditional methods [16]. The limitation of this technique is that susceptibility testing is still required, further separating the time gap between identification of bacteria to reporting of sus-ceptibility results. Knowledge of local antimicrobial re-sistance and co-rere-sistance rates becomes more critical in prescribing empiric antimicrobial therapy during this period. In addition, for initial empiric therapy in critically ill patients one may want to consider combination anti-microbial coverage, especially in patients at high risk for acquiring multidrug resistant organisms. With co-resistance data, one can calculate resistant rates of
using various combinations of empiric antimicrobial
treat-ment. For example, 15% of P. aeruginosa isolates are
resistant to gentamicin (2011), and gentamicin-resistant
P. aeruginosa that are co-resistant with piperacillin-tazobactam, imipenem and ceftazidime are 29, 33 and 11%, respectively. The resistance rates of utilizing combin-ation gentamicin with piperacillin-tazobactam (0.15 × 0.29), imipenem (0.15 × 0.33) or ceftazidime (0.15 × 0.11) in initial management are 4.4, 5.0, and 1.6%, respectively. This is an interesting finding as one may not intuitively expect the lower resistance rates with the utilization of combination therapy with ceftazidime versus imipenem.
[image:8.595.58.539.115.225.2]A major strength of our study is that the isolates were included from a diverse area within the Greater Vancouver Regional District, which included the cities of Vancouver, Richmond, and North Vancouver. The inclusion criteria were stringent to ensure that duplicate samples from the same patient were not included in the analysis. Our use of only bloodstream isolates allowed us to reliably negate effects from other possible ‘contaminant’ specimens, as GNB isolated from blood samples are almost invariably in-dicative of true infections. Patients with positive blood cul-tures are generally more acutely ill and would benefit most from the clinical utility of using co-resistance data in the selection of an empiric antimicrobial regimen. One limita-tion of this study is that we were unable to determine whether these bloodstream infections were community- or nosocomially-acquired. Due to the low number of isolates forK. oxytoca,E. cloacae, andP. aeruginosa, the resistance data had to be grouped into two time points, which re-duced the ability to determine annual variations that may have occurred. Another limitation was that we were un-aware of whether a patient received any recent or concur-rent antimicrobial therapies when blood cultures were drawn, which may have yielded additional information re-garding the incidence of failed empiric therapy. In addition, we did not explicitly determine the source of bacteremia, and so are unable to tell if resistance strains and patterns Table 2 Summary of antimicrobial co-resistance rates determined for a)E. coli, b)K. pneumoniae, c)K. oxytoca,
d)E. cloacae, and e)P. aeruginosa(Continued)
e)P. aeruginosa
No. of isolates (n) Resistance to Co-resistance rate with antibiotic (%)
2002-2011 Ceftazidime Ciprofloxacin Pip-tazo Imipenem Gentamicin
11 Ceftazidime 45 50 27 9
22 Ciprofloxacin 23 24 23 23
6 Pip-tazo 83 67 33 33
13 Imipenem 23 38 18 23
9 Gentamicin 11 56 29 33
were more commonly associated with certain types of in-fections. Although we classified all intermediate susceptible isolates as being resistant which would seemingly elevate the overall resistance rates, this methodology is consistent with clinical practice in which an antimicrobial agent with intermediate susceptibility would generally not be used if there were other effective alternatives. Overall, the inci-dence of intermediate susceptible isolates was generally low during the study period ranging from 0% to 2% for most of the antibiotic agents.
Besides ongoing surveillance of co-resistance patterns, one potential application for the future would be to look at co-resistance patterns in various medical services and ward locations. It has been proposed that unit-based anti-biograms and combination antianti-biograms may be more use-ful than national or hospital-specific antibiograms [17]. Unit-based antibiograms refers to cumulative antibiotic susceptibility reports for patients in a particular ward over a specified period of time, whereas combination antibio-grams provide information on percent susceptibility to other antibiotics if it is resistant to one particular antibiotic [17], or essentially the co-resistance rate that we investi-gated in this study. Unit-based combination antibiograms can be considered for certain wards, such as the leukemia/ bone marrow transplant ward where patients can be critic-ally ill, as this population may benefit from combination antibiotic empiric coverage depending on local susceptibil-ity patterns. The abilsusceptibil-ity of MALDI-TOF technology to ex-pedite identification of pathogens emphasizes the need and importance of having accurate and up to date antimicro-bial susceptibility data.
Conclusions
In summary, increasing antimicrobial resistance was ob-served for several GNB over a 10-year period, and may partially be associated with antimicrobial consumption. The study of co-resistance rates in multidrug resistant GNB may provide further insight into the epidemiology of resistance acquisition. Further applications for co-resistance data include its utility as a clinical tool to aid in the prescription of empiric antimicrobial therapy.
Competing interests
All authors have completed ICMJE forms and disclose no potential financial or non-financial competing interest.
Authors’contributions
PW participated in study design, interpreted data analysis, produced graphical illustrations of data, and drafted the manuscript. MVK participated in study design, and acquired and analyzed majority of data. DR participated in study design, provided raw data, and has been involved in revising the manuscript. TL participated in study design, provided raw data, and has been involved in revising the manuscript. MY interpreted the data and performed the statistical analysis. WB participated in the design and coordination of the study, and helped draft and revise the manuscript. All authors have read and approved the final manuscript.
Acknowledgements
We would like to thank Salomeh Shajari for compiling data on DDD for antimicrobial utilization at VGH over the study period.
Funding
This study was an unfunded project.
Author details 1
Division of Infectious Diseases, Department of Medicine, Faculty of Medicine, The University of British Columbia (UBC), 452D, Heather Pavilion East, VGH, 2733 Heather Street, Vancouver, BC V5Z 3J5, Canada.2Faculty of Pharmaceutical Sciences, UBC, Vancouver, Canada.3Department of Pathology and Laboratory Medicine, Faculty of Medicine, UBC, Vancouver, Canada. 4Division of Medical Microbiology and Infection Control, Vancouver General
Hospital (VGH), Vancouver, Canada.5Brain Research Centre, UBC, Vancouver, Canada.
Received: 17 March 2014 Accepted: 10 July 2014 Published: 12 October 2014
References
1. Kallen AJ, Srinivasan A:Current epidemiology of multidrug-resistant gram-negative bacilli in the United States.Infect Control Hosp Epidemiol 2010,31(Suppl 1):S51–54.
2. D'Agata EM:Rapidly rising prevalence of nosocomial multidrug-resistant, Gram-negative bacilli: a 9-year surveillance study.Infect Control Hosp Epidemiol2004,25(10):842–846.
3. Gootz TD:The forgotten Gram-negative bacilli: what genetic determinants are telling us about the spread of antibiotic resistance.Biochem Pharmacol 2006,71(7):1073–1084.
4. Courvalin P, Trieu-Cuot P:Minimizing potential resistance: the molecular view.Clin Infect Dis2001,33(Suppl 3):S138–146.
5. Spellberg B, Blaser M, Guidos RJ, Boucher HW, Bradley JS, Eisenstein BI, Gerding D, Lynfield R, Reller LB, Rex J, Schwartz D, Septimus E, Tenover FC, Gilbert D:Combating antimicrobial resistance: policy recommendations to save lives.Clin Infect Dis2011,52(Suppl 5):S397–428.
6. Pop-Vicas AE, D'Agata EM:The rising influx of multidrug-resistant gram-negative bacilli into a tertiary care hospital.Clin Infect Dis2005,40(12):1792–1798. 7. McGowan JE Jr:Resistance in nonfermenting gram-negative bacteria:
multidrug resistance to the maximum.Am J Med2006,
119(6 Suppl 1):S29–36. discussion S62-70.
8. Lockhart SR, Abramson MA, Beekmann SE, Gallagher G, Riedel S, Diekema DJ, Quinn JP, Doern GV:Antimicrobial resistance among Gram-negative bacilli causing infections in intensive care unit patients in the United States between 1993 and 2004.J Clin Microbiol2007,45(10):3352–3359. 9. Andrade SS, Jones RN, Gales AC, Sader HS:Increasing prevalence of
antimicrobial resistance among Pseudomonas aeruginosa isolates in Latin American medical centres: 5 year report of the SENTRY Antimicrobial Surveillance Program (1997–2001).J Antimicrob Chemother2003,52(1):140–141.
10. Trouillet JL, Vuagnat A, Combes A, Kassis N, Chastre J, Gibert C:
Pseudomonas aeruginosa ventilator-associated pneumonia: comparison of episodes due to piperacillin-resistant versus piperacillin-susceptible organisms.Clin Infect Dis2002,34(8):1047–1054.
11. Paramythiotou E, Lucet JC, Timsit JF, Vanjak D, Paugam-Burtz C, Trouillet JL, Belloc S, Kassis N, Karabinis A, Andremont A:Acquisition of multidrug-resistant Pseudomonas aeruginosa in patients in intensive care units: role of antibiotics with antipseudomonal activity.Clin Infect Dis2004,
38(5):670–677.
12. Kriengkauykiat J, Porter E, Lomovskaya O, Wong-Beringer A:Use of an efflux pump inhibitor to determine the prevalence of efflux pump-mediated fluoroquinolone resistance and multidrug resistance in Pseudomonas aeruginosa.Antimicrob Agents Chemother2005,49(2):565–570. 13. CLSI:Performance Standards for Antimicrobial Susceptibility Testing:
Twentieth Informational Supplement.CLSI document M100-S20. Wayne, PA: Clinical and Laboratory Standards Institute; 2010.
14. BC Centre for Disease Control:Antimicrobial Resistance Trends in the Province of British Columbia. 2012:1–52 [http://www.bccdc.ca/util/about/ annreport/default.htm#heading6]
guidelines for the treatment of acute uncomplicated cystitis and pyelonephritis in women: A 2010 update by the Infectious Diseases Society of America and the European Society for Microbiology and Infectious Diseases.Clin Infect Dis2011,52(5):e103–120.
16. Tan KE, Ellis BC, Lee R, Stamper PD, Zhang SX, Carroll KC:Prospective evaluation of a matrix-assisted laser desorption ionization-time of flight mass spectrometry system in a hospital clinical microbiology laboratory for identification of bacteria and yeasts: a bench-by-bench study for assessing the impact on time to identification and cost-effectiveness.
J Clin Microbiol2012,50(10):3301–3308.
17. Paterson DL:Impact of antibiotic resistance in gram-negative bacilli on empirical and definitive antibiotic therapy.Clin Infect Dis2008,
47(Suppl 1):S14–20.
doi:10.1186/1471-2334-14-393
Cite this article as:Wonget al.:Antimicrobial co-resistance patterns of gram-negative bacilli isolated from bloodstream infections: a longitudinal epidemiological study from 2002–2011.BMC Infectious Diseases201414:393.
Submit your next manuscript to BioMed Central and take full advantage of:
• Convenient online submission
• Thorough peer review
• No space constraints or color figure charges
• Immediate publication on acceptance
• Inclusion in PubMed, CAS, Scopus and Google Scholar
• Research which is freely available for redistribution