R E S E A R C H A R T I C L E
Open Access
Choosing algorithms for TB screening: a modelling
study to compare yield, predictive value and
diagnostic burden
Anna H van
’
t Hoog
1,2*, Ikushi Onozaki
3and Knut Lonnroth
3Abstract
Background:To inform the choice of an appropriate screening and diagnostic algorithm for tuberculosis (TB) screening initiatives in different epidemiological settings, we compare algorithms composed of currently available methods.
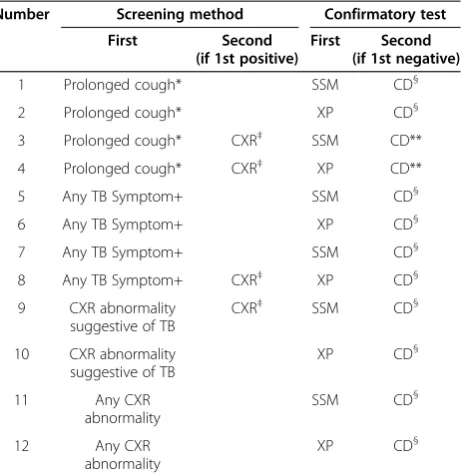
Methods:Of twelve algorithms composed of screening for symptoms (prolonged cough or any TB symptom) and/or chest radiography abnormalities, and either sputum-smear microscopy (SSM) or Xpert MTB/RIF (XP) as confirmatory test we model algorithm outcomes and summarize the yield, number needed to screen (NNS) and positive predictive value (PPV) for different levels of TB prevalence.
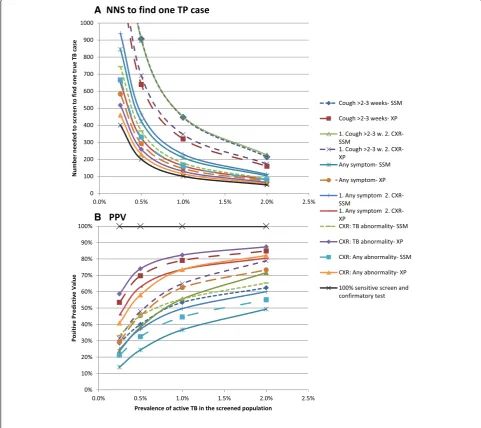
Results:Screening for prolonged cough has low yield, 22% if confirmatory testing is by SSM and 32% if XP, and a high NNS, exceeding 1000 if TB prevalence is≤0.5%. Due to low specificity the PPV of screening for any TB symptom followed by SSM is less than 50%, even if TB prevalence is 2%. CXR screening for TB abnormalities followed by XP has the highest case detection (87%) and lowest NNS, but is resource intensive. CXR as a second screen for symptom screen positives improves efficiency.
Conclusions:The ideal algorithm does not exist. The choice will be setting specific, for which this study provides guidance. Generally an algorithm composed of CXR screening followed by confirmatory testing with XP can achieve the lowest NNS and highest PPV, and is the least amenable to setting-specific variation. However resource requirements for tests and equipment may be prohibitive in some settings and a reason to opt for symptom screening and SSM. To better inform disease control programs we need empirical data to confirm the modeled yield, cost-effectiveness studies, transmission models and a better screening test.
Keywords:Tuberculosis, Systematic screening, Diagnostic algorithms, Modelling
Background
The current global rate of decline in TB incidence, at about 2% annually, is grossly insufficient to reach the goal of TB elimination by 2050 [1]. Missed and delayed diagno-sis of active TB helps sustain transmission and is a major contributor to the slow rate of decline. It also translates into poor health outcomes in people who get no or too late access to appropriate treatment [2]. In order to im-prove early detection of TB, active case finding approaches
may be needed in certain risk groups with high TB preva-lence or poor access to TB diagnosis. A recently released WHO guideline provides recommendations on when, whom and how to screen for active TB [3,4].
TB screening is defined as“systematic identification of people with suspected active TB in a predetermined tar-get group, using tests, examinations, or other procedures which can be applied rapidly” [3]. Screening is offered systematically to predetermined target groups, and not only to individuals seeking care for symptoms or signs [4]. Screening could target both people who seek health care (with or without symptoms/signs consistent with TB) and people who do not seek care. In addition to prerequisites that need to be met regarding TB program * Correspondence:[email protected]
1
Academic Medical Centre, Department of Global Health, University of Amsterdam, Amsterdam, The Netherlands
2
Amsterdam Institute for Global Health and Development, Amsterdam, The Netherlands
Full list of author information is available at the end of the article
performance and health system capacity, the decisions about screening require prioritization of risk groups, an approach on how to reach the intended populations, and choices with respect to the screening and diagnostic algorithm [3].
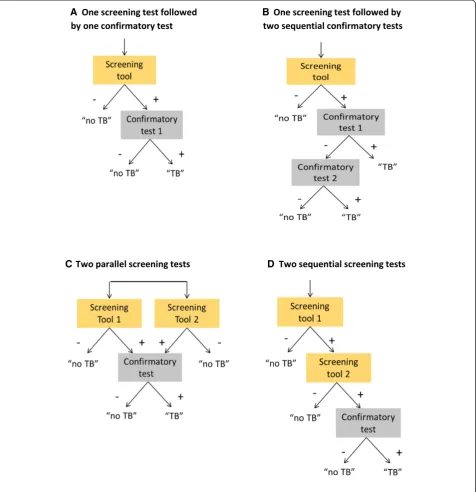
Such an algorithm will generally be composed of one or more screening methods and one or more confirmatory tests (Figure 1). Symptom questionnaires and chest radi-ography are the most available and best documented methods to screen for active TB disease [5,6]. Confirma-tory tests are historically sputum smear microscopy, and mycobacterial culture, which is the reference standard of diagnostic testing for TB [7], and the more recently developed molecular Xpert MTB/RIF assay (Cepheid, Sunnyvale, CA) [8]. However, culture is often not available for routine diagnosis in high TB burden countries [9], and requires a much longer wait for results (2–6 weeks) than the Xpert MTB/RIF assay (XP) and sputum-smear mi-croscopy (SSM), both of which can provide final test re-sults in less than 1 day [8]. In theory, the algorithm could comprise of one simple and cheap rapid test that can diag-nose TB with high sensitivity and very high specificity. However, in practice none of the currently available tests for TB fulfill this ideal profile [9]. A screening initiative will thus need to consider which algorithm is the most ap-propriate for a specific risk group in a specific setting. This requires balancing the yield of true- and false-positive and -negative TB, the benefits and risk of each outcome, the resource requirements, cost-effectiveness, and the feasibil-ity of reaching and enabling access to full diagnostic work-up as well as required care for the screened population.
To inform the choice of an appropriate algorithm we discuss clinical epidemiological principles that are im-portant for screening and diagnostic algorithms, and we use a simple mathematical model to compare algorithms that may likely be considered for TB screening using currently available screening and diagnostic methods. We compare the yield, positive predictive value, and requirements in terms of diagnostic tests.
Methods
Algorithm
In our calculations we consider a population of 100,000 persons who will be screened. The TB prevalence used in the calculations determines the number of persons in the total population who truly have active pulmonary TB that would be detectable by a highly sensitive and specific bacteriological test like liquid mycobacterial culture. We compare 12 algorithms, composed of one or more screening methods and one or more confirmatory tests [Figure 1]. The 12 combinations of screening methods and confirmatory tests are listed in Table 1.
Persons with a negative screen would not be further evaluated. Individuals with a positive screening result
will require one or more diagnostic tests to establish a final TB diagnosis. Individuals with a positive screen, but negative confirmatory test would either receive a definite diagnosis of no TB, or may be advised on follow up care if warranted.
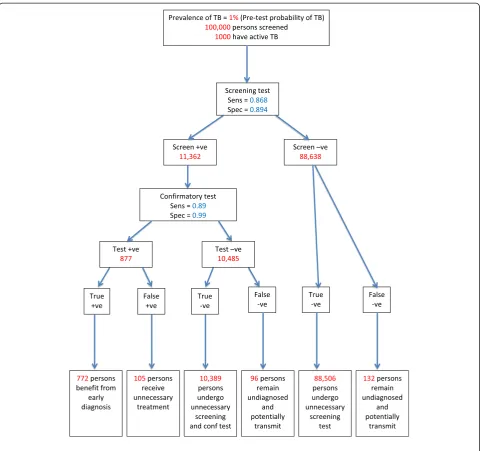
Six categories of algorithm outcomes are possible (Figure 2):
A. True positives (TP), who are screen-positive, confirmatory test-positive, and truly have active TB. These individuals will benefit from screening provided that they receive proper TB treatment, which would not otherwise have been received or which would have been received after a delay of clinical importance. There is also potential community benefit of this outcome, through reduced TB transmission [10]. The TP may face costs and inconvenience of screening and diagnostic procedures as well as adverse health, financial and social effects of appropriate TB treatment [11,12].
B. False positives (FP), who are screen-positive, confirmatory test-positive, but do not have active TB. These individuals may face costs and
inconvenience of screening and diagnosis as well as adverse health, financial and social effects of unnecessary TB treatment [11,12].
C. True negatives (TN), who are screen-positive, but confirmatory test-negative, and do not have active TB. These individuals will benefit from knowing that they do not have TB. However, they may face costs and inconvenience of screening and diagnostic procedures that could be regarded as unnecessary. Depending on the type of test, they may be identified as at higher risk to develop TB disease in the future, which may be a benefit or a disadvantage.
D. True negatives, who are screen-negative, and do not have active TB. These individuals will benefit from knowing that they do not have TB. However, they may face costs and inconvenience of screening that could be regarded as unnecessary.
E. False negatives (FN), who are screen-positive, confirmatory test-negative but actually have active TB. These individuals remain undiagnosed due to the limitation of the confirmatory test(s). They may face costs and inconvenience of screening and of the confirmatory test(s).
F. False negatives, who are screen-negative but have active TB. They remain undiagnosed due to the limitation of the screening test(s).
The extent to which screening correctly identifies all persons with bacteriologically active TB among the popu-lation to be screened, i.e. the proportion of cases detected, is determined by the sensitivity of the screening method
and of the confirmatory test(s), and by acceptance to participate and adherence to the algorithm. However, we focus on differences that can be expected from different algorithms and assume 100% participation for this study.
A
C
B
[image:3.595.62.539.90.583.2]D
Figure 1Algorithms composed of one or more screening methods and one or more confirmatory tests.In panelAone screening tool is applied (e.g. symptoms) and screen positives are further evaluated by one confirmatory test with high sensitivity and high specificity (e.g. Xpert MTB/RIF). In panelBone screening tool is applied (e.g. symptoms) and screen positives are further evaluated by a confirmatory test with low sensitivity (e.g. sputum smear microscopy), and persons with a negative test receive a second test or procedure (e.g. clinical diagnosis, or sputum culture). In panelCtwo screening tools are applied (e.g. symptoms and chest radiography) and screen positives on either one or on both are further evaluated with a confirmatory test. In panelDtwo screening tools are applied sequentially. Screen positives on the first screen (e.g. symptoms) undergo a second screen (e.g. CXR) and if also positive on the second a confirmatory test is applied. The single confirmatory test in panelsCandD
The prevalence of active TB in the population to be screened is an important determinant of the tradeoff be-tween benefits, risks and costs. The latter includes finan-cial, logistical and human resource requirements as well as participants’time and personal expenses. This tradeoff can be judged by the following three indicators, which all depend on the TB prevalence: (i) the number needed to screen (NNS) and thus the resources required to detect one true TB case. Furthermore (ii) the positive predictive value (PPV), i.e. the number of true positive cases detected divided by the sum of true positive cases detected and false-positive TB diagnoses made, and (iii) the negative predictive values (NPV), i.e. the number of true negatives divided by the sum of true negative and false negative outcomes.
Screening methods
We consider the most available screening methods, which are symptom questions, chest radiography (CXR), and serial screening with first a symptom question-naire followed by CXR if the symptom screen is posi-tive (Figure 1D). We left out algorithms composed of
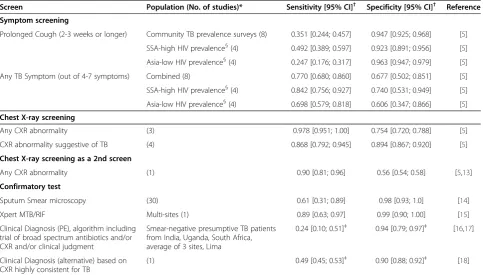
symptom and CXR screening in parallel (Figure 1C). Although this combination is the standard screening in TB prevalence surveys, it has little advantage for an active screening program as the sensitivity of symptom and CXR screening in parallel is only marginally better compared to the sensitivity of CXR screening for any abnormality alone, and its specificity is worse [5]. The sensitivity and specificity of the symptom screens as used in the model (Table 2) are obtained from a systematic review and meta-analysis [5]. We examine symptom screening for ‘prolonged cough’i.e. cough for 2-3 weeks or more, and for ‘any TB symptom’i.e. presence of any one symptom out of a combination of 4-7 symptoms suggestive of TB: cough, productive cough, fever, night sweats, weight loss, chest pain, haemoptysis. CXR screening distinguishes between ‘any CXR abnormality’, which includes abnormalities that may not be considered suggestive of active or inactive TB and‘abnormalities suggestive of TB’, which could be active or inactive TB. The two sequential screening algorithms
that we consider are composed of ‘prolonged cough’ or
‘any TB symptom’respectively as the first screen, and CXR as a second screening step for individuals with a positive first screen. Due to limited data, the accuracy of CXR is assumed to be the same in both algorithms, and reflects ‘any CXR abnormality’in symptomatic persons [5,13].
Confirmatory tests
As the first confirmatory tests we consider SSM which is widely available, or XP, whose availability is globally expanding. Since neither of these tests is 100% sensitive, clinical diagnosis, which implies a clinician’s judgment of
the patient’s symptoms and signs and/or chest
[image:4.595.60.291.111.349.2]radiog-raphy findings, possibly re-assessed after a short course of broad-spectrum antibiotics, is a follow-on in some pa-tients with a negative first test (in absence of mycobac-terial culture). For XP we took the predicted sensitivity (89%) and specificity (99%) of a meta-analysis of XP as an initial test for TB detection replacing microscopy [15]. In sensitivity analyses we explored the predicted ra-ther than the pooled 95% credible intervals for XP sensi-tivity and specificity, as a better reflection of what may happen in new situations. For the SSM sensitivity (Table 2) we use 61% as the point estimate (PE), which is both the unweighted average and median sensitivity of 30 studies included in two systematic reviews on sputum smear microscopy and processing techniques [14,19]. In absence of a prediction interval obtained by meta-analysis we explored the range across included studies (31-89%) in sensitivity analysis, to accommodate the wide variation in patient characteristics, including HIV status, age, and disease severity, on the referral level where the test is done, on background epidemiology, on sputum processing and staining techniques, and skills Table 1 The 12 combinations of screening methods and
confirmatory tests
Number Screening method Confirmatory test
First Second
(if 1st positive)
First Second
(if 1st negative)
1 Prolonged cough* SSM CD§
2 Prolonged cough* XP CD§
3 Prolonged cough* CXR‡ SSM CD**
4 Prolonged cough* CXR‡ XP CD**
5 Any TB Symptom+ SSM CD§
6 Any TB Symptom+ XP CD§
7 Any TB Symptom+ SSM CD§
8 Any TB Symptom+ CXR‡ XP CD§
9 CXR abnormality suggestive of TB
CXR‡ SSM CD§
10 CXR abnormality suggestive of TB
XP CD§
11 Any CXR
abnormality
SSM CD§
12 Any CXR
abnormality
XP CD§
SSM = Sputum smear microscopy; XP = Xpert MTB/RIF; TB = tuberculosis; CXR = chest X-ray.
CD = clinical diagnosis, which may in addition to clinical judgment include antibiotic trial and/or CXR for TB abnormalities.
*Cough for 2-3 weeks or longer †Any one out of 4-7 symptoms suggestive of TB.
§
We assume that the proportion of persons who receive a clinical diagnosis depends on the negative predictive value of the prior algorithm, as explained in the Methods.
‡Any CXR abnormality.
and diagnostic quality [14,19,20]. The specificity PE (98%) is consistent with a number of reviews [14,19,20]. In clinical settings where mycobacterial cultures are not part of the routine diagnostic work-up, all or most patients who report with suggestive symptoms but have negative smears are expected to be evaluated clinically. In an active screening initiative we expect patients eligible for confirma-tory testing to be less ill on average compared to patients who seek care themselves. We therefore assume that only a proportion of the persons with a positive screen but nega-tive confirmatory test be further examined by clinical diag-nosis [21], and that this proportion will depend on the
[image:5.595.58.543.87.538.2]probability of TB in a person with a negative SSM or XP result, i.e. the NPV at that point in the algorithm (Table 2), except for algorithms 3 and 4 where we assume that 100% of persons with prolonged cough and a CXR abnormality and negative confirmatory tests are further evaluated clinic-ally. In the primary analysis the sensitivity and specificity of clinical diagnosis reflect settings where not all patients are examined by CXR [8,16,17]. In sensitivity analysis we explore the assumption about the proportion of pa-tients receiving clinical evaluation (0-100%), and alter-native parameter values for sensitivity and specificity based on a study where all clinically evaluated patients
receive a diagnostic CXR and are considered a to have TB if the CXR is highly consistent for TB [18].
The sensitivity and specificity of all screens and con-firmatory tests are relative to sputum culture as the refer-ence standard, and considered to be independent. Simple decision trees were constructed in TreeAge software (TreeAge Software, Inc, Williamstown MA, USA) and model outputs were transferred to MS-Excel (Microsoft Corp, Seattle WA, USA) for further analysis. Ethical ap-proval was not sought, as only secondary data were used.
For each algorithm we calculated the number of TP, FP, FN, and TN in categories A-F as described above, propor-tion of true TB cases detected, the PPV, NPV, NNS, the number of persons requiring confirmatory testing, and the number of screening CXRs, sputum microscopy examina-tions and XP tests required for different levels of TB prevalence in the population.
Sensitivity analysis
In 10 scenarios (Table 3) we examine the effect of uncer-tainty in the model parameters on case detection, NNS,
PPV, and resource requirements expressed as the number of CXRs, SSM and XP tests that needs to be done, assum-ing TB prevalence is 1%. We assume that if the sensitivity of a screening or confirmatory test increases to the ex-treme highest value of the uncertainty range, the specifi-city reduces to the lowest end of the uncertainty range. We also explore the effect of symptom screening using ac-curacy estimates from studies in African populations with high HIV prevalence versus Asian low HIV settings. Since real life experience with XP is less compared to SSM, we examine the effect if the specificity of smear microscopy and XP were the same (98%) in practice [14,20,22].
Results
Sensitivity and NNS
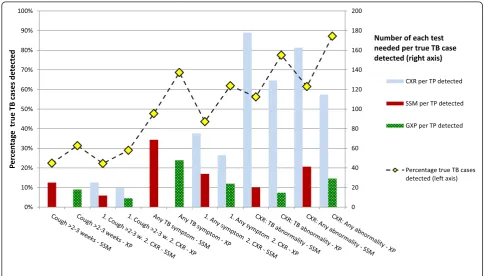
[image:6.595.57.541.100.375.2]If prolonged cough, which has low sensitivity, is either the only screen or a first step followed by CXR, the proportion of true TB cases detected is low: 22% if the confirmatory test for screen-positives is SSM, and approximately 30% if XP (Figure 3). The NNS to find a true TB case depends on the sensitivity of the algorithm and increases with Table 2 Model Parameters: sensitivity and specificity of screening methods and confirmatory tests
Screen Population (No. of studies)* Sensitivity [95% CI]† Specificity [95% CI]† Reference
Symptom screening
Prolonged Cough (2-3 weeks or longer) Community TB prevalence surveys (8) 0.351 [0.244; 0.457] 0.947 [0.925; 0.968] [5]
SSA-high HIV prevalence§(4) 0.492 [0.389; 0.597] 0.923 [0.891; 0.956] [5]
Asia-low HIV prevalence§(4) 0.247 [0.176; 0.317] 0.963 [0.947; 0.979] [5]
Any TB Symptom (out of 4-7 symptoms) Combined (8) 0.770 [0.680; 0.860] 0.677 [0.502; 0.851] [5]
SSA-high HIV prevalence§(4) 0.842 [0.756; 0.927] 0.740 [0.531; 0.949] [5]
Asia-low HIV prevalence§(4) 0.698 [0.579; 0.818] 0.606 [0.347; 0.866] [5]
Chest X-ray screening
Any CXR abnormality (3) 0.978 [0.951; 1.00] 0.754 [0.720; 0.788] [5]
CXR abnormality suggestive of TB (4) 0.868 [0.792; 0.945] 0.894 [0.867; 0.920] [5]
Chest X-ray screening as a 2nd screen
Any CXR abnormality (1) 0.90 [0.81; 0.96] 0.56 [0.54; 0.58] [5,13]
Confirmatory test
Sputum Smear microscopy (30) 0.61 [0.31; 0.89] 0.98 [0.93; 1.0] [14]
Xpert MTB/RIF Multi-sites (1) 0.89 [0.63; 0.97] 0.99 [0.90; 1.00] [15]
Clinical Diagnosis (PE), algorithm including trial of broad spectrum antibiotics and/or CXR and/or clinical judgment
Smear-negative presumptive TB patients from India, Uganda, South Africa, average of 3 sites, Lima
0.24 [0.10; 0.51]‡ 0.94 [0.79; 0.97]‡ [16,17]
Clinical Diagnosis (alternative) based on CXR highly consistent for TB
(1) 0.49 [0.45; 0.53]‡ 0.90 [0.88; 0.92]‡ [18]
PE = point estimate; NPV = negative predictive value; SSA = Sub-Saharan Africa; TB = tuberculosis; CXR = chest X-ray. *Number of studies included in the estimate.
†The values in between brackets reflect the 95% confidence interval, except for Xpert MTB/RIF the 95% prediction interval was used, and for SSM the range across
studies (seeMethodssection). §
the 4 SSA-high HIV prevalence studies are from Zimbabwe, Zambia, South Africa and Kenya. The Asia-low HIV studies are from Vietnam, Myanmar, India and Cambodia.
‡An assumption is made that in an active screening program only a proportion of patients with a negative confirmatory SSM or Xpert MTB/RIF result receive
decreasing TB prevalence (Figure 4A). Of algorithms using screening for prolonged cough the NNS is 3-4 times higher compared to the NNS of the most sensitive algorithm and exceeds 1000 if the TB prevalence is below 0.5%. The highest case detection and lowest NNS is achieved if XP is used for confirmatory testing, and screening is either by CXR for any abnormality (87%) or TB abnormalities (77%), or by screening for any TB symptom (69%).
Detailed information on the outcomes of the screening and confirmatory testing is available in the Additional file 1: Table S1. For each of the 12 algorithm the number of TP, FP, TN, FN, PPV, NPV and the number of tests required for an assumed prevalence in the population to be screened of 0.5, 1.0 and 2.0% are provided with and without clinical diagnosis following a negative SSM or XP.
Specificity and PPV
[image:7.595.56.291.111.364.2]The algorithms in which the specificity of the screening test and/or the confirmatory test(s) is lowest result in more false positive diagnoses and thus in a lower PPV, especially if the TB prevalence is low and/or the sensitivity of the algorithm is low (Figure 4B). If the TB prevalence is 0.5% only four algorithms attain a PPV greater than 50% (which means that the number of TP cases exceeds the number of FPs). Table 3 Scenarios to examine the effect of uncertainty in
the model parameters
Variation in Scenario Reference
1. Accuracy of screening tests (symptom, CXR)
a. High sensitivity, low specificity*
[5]
b. Low sensitivity, high specificity*
[5]
2. Accuracy of confirmatory tests (SSM, XP)
a. High sensitivity, low specificity*
[14,15,19,20]
b. Low sensitivity, high specificity*
[14,15,19,20]
3. Specificity of SSM, XP Assume 98% specificity for SSM and XP
[22]
4. Proportion of persons with negative SSM or XP receiving clinical diagnosis
a. 0%
b. 100%
5. Accuracy of clinical diagnosis Entirely based on CXR diagnosis
[18]
6. Accuracy of screening tests in different settings
a. Sub Saharan Africa/high HIV-population
[5]
b. Asia/low HIV population
[5]
[image:7.595.55.540.413.689.2]*set to the extremes of the ranges shown in Table1.
Those are algorithms that use XP as the confirmatory test, and screen with CXR for either any abnormality or TB abnormalities, symptom screening for prolonged cough, or sequential screening with any symptom followed by CXR. The PPV of screening for any symp-tom followed by SSM does not reach 50% even if the TB prevalence is 2%.
Requirements in terms of diagnostic tests
Of the algorithms with high sensitivity, CXR screening for TB abnormalities followed by XP requires 15 XP tests per
TB case detected when TB prevalence is 1% (Figure 3). This is more efficient compared to any CXR abnormality (29 XP tests), due to better specificity. When counting the number of screening CXRs needed per one TP case, CXR screening for TB abnormalities requires 129 CXRs and is slightly less efficient compared to CXR screening for any abnormality (115 CXRs), due to lower sensitivity. Screen-ing for any TB symptom results in high requirements for confirmatory tests per TP case (69 SSM or 48 XP). The efficiency of symptom screening improves if CXR as a second screen is added for symptom screen positives, but
A
[image:8.595.56.538.92.520.2]B
adds the need for CXRs compared to symptom screening alone. The number of tests per TP approximately doubles if prevalence halves.
Sensitivity analyses
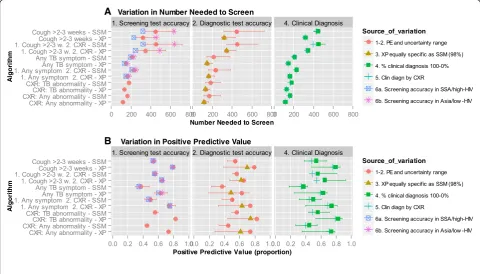
Uncertainty and setting-specific variation in the sensitiv-ity of symptom screening, translates into considerable variation in the NNS of algorithms with low sensitivity, i.e. those screening with prolonged cough (Figure 5). If the sensitivity of the cough screen is at the low end, the NNS is double compared to sensitivity at the high end of the range. For screening with any TB symptom the PPV is more susceptible to uncertainty. Setting-specific variation in the sensitivity and specificity of symptom screening does not change the ranking of the NNS or PPV of the 12 algorithms. The assumptions about clinical diagnosis have little effect on the NNS. The PPV of all algorithms drops if the proportion of persons receiving clinical diagnosis after a negative confirmatory test would increase or a clinical diagnostic algorithm with higher sensitivity but lower specificity would be applied (due to an increase in false positive diagnoses). The largest increase in the number of confirmatory tests required per TP case detected is caused by a
lower sensitivity of the confirmatory test (Additional file 2: Table S2).
Discussion
This modeling study shows how algorithms that could be considered for a TB screening initiative differ in the proportion of TB cases detected, the NNS, the risk of providing a TB diagnosis to individuals who do not have TB, an indication of the number of tests that need to be used to detect a true case of TB, and how those are affected by the prevalence of TB in the screened popula-tion and by variapopula-tion in performance of screening and diagnostic tests.
How could TB screening programs use this information
For a TB screening program in a specific setting, the choice of screening and diagnostic methods will depend on several considerations. The choice between symptom and CXR screening may be driven by the availability, cost and mobility of CXR equipment, but should be balanced against the overall resource requirements for an active screening initiative and the expected yield. The algorithm composed of screening for prolonged cough followed by smear microscopy requires the least resources for
A
[image:9.595.57.538.396.670.2]B
screening and confirmatory tests, but the low case detec-tion, only 22% of the TB cases, results in a high NNS which is inefficient. In severely resource constrained settings this algorithm may nevertheless be chosen since a low number of confirmatory tests is needed, it does not require expensive equipment, and the costs of reaching out to the screened population may be low in such settings. A more sensitive symptom screen, any TB symp-tom, increases the proportion of cases detected and thus lowers the NNS, but creates a large number of persons requiring confirmatory testing and a low PPV due to an expected increase in FP diagnoses. The latter creates a treatment burden for patients and the health service. An additional disadvantage of symptom screening and espe-cially prolonged cough, is the wide variation in accuracy observed between studies [5], which was in part explained by differences in region and population HIV-prevalence. As a result the NNS in a specific setting may be approxi-mately 50% higher or lower than the average that we used. Less variation is expected from CXR screening.
In settings where the prevalence of TB is low, the NNS is high for all algorithms, even for an algorithm with 100% sensitivity, resulting in high costs of screening per TP TB case found, and the PPV is low. Therefore in low preva-lence settings great caution is needed and high specificity is very important. Mechanisms to improve specificity should be considered, for instance adding confirmatory culture before TB treatment is initiated in patients with absent or minimal symptoms, or XP may be used to con-firm positive SSM. Target groups should be selected for whom it is critically important to detect active TB, and/or exclude active TB because of possible eligibility for treat-ment of latent TB infection (LTBI), e.g. HIV-infected [23]. Under those conditions some overtreatment of active TB may be more acceptable. In contrast, when the TB preva-lence in the population to be screened is 2% or above, the NNS is much lower and the PPV is higher for all algo-rithms. Very high specificity is less crucial compared to low prevalence settings. These clinical epidemiological principles do not only guide the choice for an algorithm, but also provide a key rationale to focus screening to high-est risk groups where TB prevalence may even be above 2% like HIV-infected, contacts of infectious TB cases, persons with silicosis, prisoners [24], and the elderly population in some very-high TB burden countries in Asia [25,26].
CXR screening becomes much more attractive when XP is available. CXR for screening should ideally not be com-bined with SSM for diagnosis because of an increase in the NNS by approximately half, and the higher risk of false positives, especially if among SSM negatives the CXR is also used for a clinical diagnosis. Although CXR is good for screening because of high sensitivity, it is not as good for diagnosis since a CXR based clinical diagnosis has low
specificity [18]. CXR screening has additional benefits. Persons with highly suggestive TB abnormalities can be identified who are missed by bacteriological tests. These persons are at increased risk of developing active TB in the future and would benefit from follow-up and possibly preventive treatment [27]. Second, the ability to detect other diseases. These advantages only apply if the health service has the capacity to provide follow-up of patients with unclear TB outcomes or clinical services for other identified conditions. A screening program should con-sider all such possible outcomes and consequences, and include those in informed consent to TB screening [4].
The cost and cost-effectiveness of an algorithm will be an important consideration, which we do not address in this study. CXR and XP are more costly tests compared to symptom screening and SSM [28]. However, digital CXR has very low running cost and is an attractive tool if the technology is already available, or if the high start-up costs could be covered under investments for general improve-ments of diagnostic capacity of a health system. Cost for screening program operations will be very setting specific. Ultimately cost-effectiveness also depends on the effect that different algorithms may have on transmission and at which interval they should be applied to accelerate or sustain reduced transmission. The development of a com-bined transmission and cost-effectiveness model will be important to compare screening and diagnostic strategies. However, empirical data on the effect of screening or active case finding on transmission are scarce [29]. Field studies comparing the effectiveness and cost-effectiveness of different algorithms and screening intervals are needed to better inform decision makers and screening models.
Screening tests with low specificity may either cause un-necessary worry, or decrease motivation since one rarely receives a positive confirmatory test.
Our analysis points to a number of monitoring and evaluation questions. An assessment of the true pro-portion of TB cases detected would be desirable, but will often not be feasible. Instead an estimation of the specificity of the screen, the NNS and PPV could be obtained from routine monitoring data on participation in the screening program, the numbers and proportions of persons testing positive on screening and of TB cases diagnosed, and by periodic retesting of the persons diagnosed with TB with a more sensitive method (culture). If these indicators are outside the expected range for the algorithm used and presumed TB prevalence, more in-depth evaluation may be needed. Future research should address the need for empirical data and cost-effectiveness studies, and also focus on the development of a better screening test. Digital CXR has very low running costs and automated reading may be an option in the future [34,35]. However, a simple, more portable screening test with greater and more consistent accuracy compared to symptom screening could greatly enhance TB screening.
This analysis concerns screening scenarios, but has relevance for diagnostic algorithms among people actively seeking care with TB symptoms as well. CXR may be used to triage patients for further bacteriological tests [36]. XP as a replacement of SSM will not only increase sensitivity and thus increase case detection, but also increase the PPV.
Conclusion
In conclusion, this study provides guidance on choice of algorithms, keeping in mind that with currently available means‘the one ideal algorithm’does not exist. Generally an algorithm composed of CXR screening followed by confirmatory testing with XP can achieve the lowest NNS and highest PPV, and the validity is least amendable to setting-specific variation. However resource requirements for tests and equipment may be prohibitive in some settings and a reason to opt for symptom screening and SSM. To better inform disease control programs about TB screening options we need empirical data to confirm the modeled yield, cost-effectiveness studies, transmission models and a better screening test.
Additional files
Additional file 1: Table S1.Detailed information on the outcomes of the screening and confirmatory testing.
Additional file 2: Table S2.Sensitivity Analysis, showing the effect of variation in model parameters on five indicators, for a prevalence of 1.0%.
Competing interests
The authors declare that they have no competing interests.
Authors’contributions
AVH participated in study design, constructed the model, conducted the analyses and wrote the first draft. IO provided technical input and critically revised the manuscript. KL conceived of the study and participated in its design, and helped draft the manuscript. All authors read and approved the final manuscript.
Acknowledgements
This study was financially supported by USAID (TB Care I) through the World Health Organization. The funding body had no role in the design, collection, analysis, and interpretation of data, nor in the writing of the manuscript or the decision to submit the manuscript for publication.
IO and KL are staff members of the World Health Organization (WHO). They alone are responsible for the views expressed in this publication and they do not necessarily represent the decisions or policies of the WHO.
Author details
1Academic Medical Centre, Department of Global Health, University of Amsterdam, Amsterdam, The Netherlands.2Amsterdam Institute for Global Health and Development, Amsterdam, The Netherlands.3Global TB Programme, World Health Organization, Geneva, Switzerland.
Received: 4 April 2014 Accepted: 3 September 2014 Published: 19 October 2014
References
1. World Health Organization:Global Tuberculosis Report 2013.Geneva: World Health Organization; 2013. WHO/HTM/TB/2013.11.
2. Tiemersma EW, van der Werf MJ, Borgdorff MW, Williams BG, Nagelkerke NJ:
Natural history of tuberculosis: duration and fatality of untreated pulmonary tuberculosis in HIV negative patients: a systematic review.
PloS One2011,6:e17601.
3. Lonnroth K, Corbett E, Golub J, Godfrey-Faussett P, Uplekar M, Weil D, Raviglione M:Systematic screening for active tuberculosis: rationale, definitions and key considerations.Int J Tuberc Lung Dis2013,17:289–298. 4. World Health Organization:Systematic Screening for Active Tuberculosis.
Principles and Recommendations.Geneva: World Health Organization; 2013. 5. van’t Hoog AH, Langendam MW, Mitchell E, Cobelens FG, Sinclair D,
Leeflang MMG, Lonnroth K:A Systematic Review of the Sensitivity and Specificity of Symptom- and Chest-Radiography Screening for Active Pulmonary Tuberculosis in HIV-Negative Persons and Persons with Unknown HIV Status, Report to WHO; 2013.
6. van’t Hoog AH, Meme HK, Laserson KF, Agaya JA, Muchiri BG, Githui WA, Odeny LO, Marston BJ, Borgdorff MW:Screening strategies for tuberculosis prevalence surveys: the value of chest radiography and symptoms.
PLoS One2012,7:e38691.
7. Whitelaw A, Sturm WA:Microbiological testing for Mycobactrium tuberculosis. InTuberculosis. A Comprehensive Clinical Reference.Edited by Schaaf HS, Zumla AI. Philadelphia: Saunders; 2009:164–168.
8. Boehme CC, Nicol MP, Nabeta P, Michael JS, Gotuzzo E, Tahirli R, Gler MT, Blakemore R, Worodria W, Gray C, Huang L, Caceres T, Mehdiyev R, Raymond L, Whitelaw A, Sagadevan K, Alexander H, Albert H, Cobelens F, Cox H, Alland D, Perkins MD:Feasibility, diagnostic accuracy, and effectiveness of decentralised use of the Xpert MTB/RIF test for diagnosis of tuberculosis and multidrug resistance: a multicentre implementation study.Lancet2011,
377:1495–1505.
9. Weyer K, Carai S, Nunn P:Viewpoint TB diagnostics: what does the world really need?J Infect Dis2011,204(Suppl 4):S1196–S1202.
10. Corbett EL, Bandason T, Duong T, Dauya E, Makamure B, Churchyard GJ, Williams BG, Munyati SS, Butterworth AE, Mason PR, Mungofa S, Hayes RJ:
Comparison of two active case-finding strategies for community-based diagnosis of symptomatic smear-positive tuberculosis and control of infectious tuberculosis in Harare, Zimbabwe (DETECTB): a cluster-randomised trial.Lancet2010,376:1244–1253.
11. Courtwright A, Turner AN:Tuberculosis and stigmatization: pathways and interventions.Public Health Rep2010,125(Suppl 4):34–42.
12. Barter DM, Agboola SO, Murray MB, Barnighausen T:Tuberculosis and poverty: the contribution of patient costs in sub-Saharan Africa–a systematic review.
BMC Public Health2012,12:980.
pulmonary tuberculosis and inadequate case finding in rural western Kenya.Am J Respir Crit Care Med2011,183:1245–1253.
14. Steingart KR, Henry M, Ng V, Hopewell PC, Ramsay A, Cunningham J, Urbanczik R, Perkins M, Aziz MA, Pai M:Fluorescence versus conventional sputum smear microscopy for tuberculosis: a systematic review.Lancet Infect Dis2006,6:570–581.
15. Steingart KR, Sohn H, Schiller I, Kloda LA, Boehme CC, Pai M, Boehme CC, Dendukuri N:Xpert(R) MTB/RIF assay for pulmonary tuberculosis and rifampicin resistance in adults (updated).Cochrane Database Syst Rev2014,
1:CD009593.
16. Vassall A, van Kampen S, Sohn H, Michael JS, John K, den Boon S, Davis JL, Whitelaw A, Nicol MP, Gler MT, Khaliqov A, Zamudio C, Perkins MD, Boehme CC, Cobelens F:Rapid diagnosis of tuberculosis with the Xpert MTB/RIF assay in high burden countries: a cost-effectiveness analysis.PLoS Med
2011,8:e1001120.
17. Soto A, Solari L, Gotuzzo E, Acinelli R, Vargas D, Van der Stuyft P:Performance of an algorithm based on WHO recommendations for the diagnosis of smear-negative pulmonary tuberculosis in patients without HIV infection.
Trop Med Int Health2011,16:424–430.
18. van Cleeff MR, Kivihya-Ndugga L, Githui W, Nganga L, Odhiambo J, Klatser PR:A comprehensive study of the efficiency of the routine pulmonary tuberculosis diagnostic process in Nairobi.Int J Tuberc Lung Dis2003,
7:186–189.
19. Steingart KR, Ng V, Henry M, Hopewell PC, Ramsay A, Cunningham J, Urbanczik R, Perkins MD, Aziz MA, Pai M:Sputum processing methods to improve the sensitivity of smear microscopy for tuberculosis: a systematic review.Lancet Infect Dis2006,6:664–674.
20. Cattamanchi A, Davis JL, Pai M, Huang L, Hopewell PC, Steingart KR:Does bleach processing increase the accuracy of sputum smear microscopy for diagnosing pulmonary tuberculosis?J Clin Microbiol2010,48:2433–2439. 21. Dimairo M, Macpherson P, Bandason T, Zezai A, Munyati SS, Butterworth AE,
Mungofa S, Rusikaniko S, Fielding K, Mason PR, Corbett EL:The risk and timing of tuberculosis diagnosed in smear-negative TB suspects: a 12 month cohort study in Harare, Zimbabwe.PLoS One2010,5:e11849. 22. Steingart KR, Sohn H, Schiller I, Kloda LA, Boehme CC, Pai M, Boehme CC,
Dendukuri N:Xpert(R) MTB/RIF assay for pulmonary tuberculosis and rifampicin resistance in adults.Cochrane Database Syst Rev2013,
1:CD009593.
23. World Health Organization:Guidelines for intensified tuberculosis case-finding and isoniazid preventive therapy for people living with HIV in resource-constrained settings.2011.
24. Shapiro AE, Golub J:A Systematic Review of Active Case-Finding Strategies in Risk Groups for Tuberculosis (TB) and the Relationship to the number Needed to Screen.2013. Report to WHO.
25. Ministry of Health Kingdom of Cambodia:Report National TB Prevalence Survey, 2002 Cambodia.Cambodia: National Tuberculosis Control Program; 2005. 26. Ministy of Health Department of Health Government of Myanmar:Report on
National TB Prevalence Survey 2009-2010.Myanmar: Ministry of Health; 2012. 27. Okada K, Onozaki I, Yamada N, Yoshiyama T, Miura T, Saint S, Peou S, Mao
TE:Epidemiological impact of mass tuberculosis screening: a 2-year follow-up after a national prevalence survey.Int J Tuberc Lung Dis2012,
16:1619–1624.
28. Pantoja A, Fitzpatrick C, Vassall A, Weyer K, Floyd K:Xpert MTB/RIF for diagnosis of TB and drug-resistant TB: a cost and affordability analysis.
Eur Respir J2012,42(3):708–820.
29. Kranzer K, Afnan-Holmes H, Tomlin K, Golub JE, Shapiro AE, Schaap A, Corbett EL, Lönnroth K, Glynn JR:The benefits to communities and individuals of screening for active tuberculosis disease: a systematic review.Int J Tuberc Lung Dis2013,17:432–446.
30. Boehme CC, Nabeta P, Hillemann D, Nicol MP, Shenai S, Krapp F, Jenny A, Rasim T, Robert B, Roxana R, Ana M, Martin J, O'Brien SM, Persing DH, Sabine R-G, Eduardo G, Camilla R, David A, Perkins MD:Rapid molecular detection of tuberculosis and rifampin resistance.N Engl J Med2010,
363:1005–1015.
31. World Health Organization:Policy Statement: Automated Real-time Nucleic Acid Amplification Technology for Rapid and Simultaneous Detection of Tuberculosis and Rifampicin Resistance: Xpert MTB/RIF System. [WHO/HTM/TB/2011.4].
Geneva, Switzerland: World Health Organization; 2011.
32. Dorman SE, Chihota VN, Lewis JJ, Shah M, Clark D, Grant AD, Churchyard GJ, Fielding KL:Performance characteristics of the Cepheid Xpert MTB/RIF test in a tuberculosis prevalence survey.PLoS One2012,7:e43307.
33. Lewis JJ, Charalambous S, Day JH, Fielding KL, Grant AD, Hayes RJ, Corbett EL, Churchyard GJ:HIV infection does not affect active case finding of tuberculosis in South African gold miners.2009,180:1271–1278. 34. Hogeweg L, Story A, Hayward A, Aldridge R, Abubakar I, Maduskar P:
Computer-aided detection of tuberculosis among high risk groups: potential for automated triage. Annual meeting of the Radiological Society of North America.2011.
35. Maduskar P, Muyoyeta M, Ayles H, Hogeweg L, Peters-Bax L, van Ginneken B:
Detection of tuberculosis using digital chest radiography: automated reading vs. interpretation by clinical officers.Int J Tuberc Lung Dis2013,
17:1613–1620.
36. van't Hoog AH, Cobelens FG, Vassall A, van Kampen S, Dorman SE, Alland D, Ellner J:Optimal triage test characteristics to improve the cost-effectiveness of the Xpert MTB/RIF assay for TB diagnosis: a decision analysis.PLoS One
2013,8:e82786.
doi:10.1186/1471-2334-14-532
Cite this article as:van’t Hooget al.:Choosing algorithms for TB
screening: a modelling study to compare yield, predictive value and diagnostic burden.BMC Infectious Diseases201414:532.
Submit your next manuscript to BioMed Central and take full advantage of:
• Convenient online submission
• Thorough peer review
• No space constraints or color figure charges
• Immediate publication on acceptance
• Inclusion in PubMed, CAS, Scopus and Google Scholar
• Research which is freely available for redistribution