R E S E A R C H A R T I C L E
Open Access
Spatial and temporal patterns of diarrhoea
in Bhutan 2003
–
2013
Kinley Wangdi
1,2*and Archie CA Clements
1Abstract
Background:To describe spatiotemporal patterns of diarrhoea in Bhutan, and quantify the association between climatic factors and the distribution and dynamics of the disease.
Methods:Nationwide data on diarrhoea were obtained for 2003 to 2013 from the Health Information and Management System (HIMS), Ministry of Health, Bhutan. Climatic variables were obtained from the Department of Hydro Met Services, Ministry of Economic Affairs, Bhutan. Seasonal trend decomposition was used to examine secular trends and seasonal patterns of diarrhoea. A Bayesian conditional autoregressive (CAR) model was used to quantify the relationship between monthly diarrhoea, maximum temperature, rainfall, age and gender.
Results:The monthly average diarrhoea incidence was highly seasonal. Diarrhoea incidence increased by 0.6% (95% CrI: 0.5–0.6%) for every degree increase in maximum temperature; and 5% (95 Cr I: 4.9–5.1%) for a 1 mm increase in rainfall. Children aged <5 years were found to be 74.2% (95% CrI: 74.1–74.4) more likely to experience diarrhoea than children and adults aged≥5 years and females were 4.9% (95% CrI: 4.4–5.3%) less likely to suffer from diarrhoea as compared to males. Significant residual spatial clustering was found after accounting for climate and demographic variables.
Conclusions:Diarrhoea incidence was highly seasonal, with positive associations with maximum temperature and rainfall and negative associations with age and being female. This calls for public health actions to reduce future risks of climate change with great consideration of local climatic conditions. In addition, protection of <5 years children should be prioritize through provision of rotavirus vaccination, safe and clean drinking water, and proper latrines.
Keywords:Time series analysis, Spatial analysis, Bayesian analysis, Diarrhoea, Bhutan
Background
Diarrhoea is associated with high childhood morbidity and mortality [1, 2] and claims two million lives each year in developing countries [3]. It is the second leading cause of death in children <5 years old, and World Health Organization (WHO) estimates around 760,000 children <5 years die each year from this disease [4]. About 88% of diarrhoea-associated deaths are attribut-able to unsafe water, inadequate sanitation, and insuffi-cient hygiene [5, 6].
Unsafe water can be associated with the changes in metrological factors such as flooding, temperature, hu-midity, and rainfall [7, 8]. The increased water level as a result of annual flooding can contaminate water sources
by transporting pathogens [9], triggering waterborne dis-eases including diarrheal outbreaks [10, 11]. Diarrhoea has been reported to demonstrate strong seasonal variation related to climate [12–14]. Increased diarrheal disease re-putedly associated with climate change has been reported [15, 16]. In places with water scarcity, use of rain water as a source of domestic and drinking water might contribute to diarrhoea occurrence as a result of contamination by human and industrial wastes [17–20].
Diarrhoeal disease continues to cause significant mor-bidity and mortality in Bhutan. Diarrhoea was ranked amongst the top ten diseases in terms of number of cases in the last 5 years [21–23]. In 2015, diarrhoea was the fifth common conditions with 51,593 reported cases [23]. The high burden of diarrhoea occurs despite increases in sani-tation with increased coverage of latrines and drinking water through rural water supply schemes (RWSS). In 2000, national coverage of sanitary latrines and piped * Correspondence:[email protected]
1Department of Global Health, Research School of Population Health, College
of Medicine, Environment and Biology, The Australian National University, Canberra, Australia
2
Phuentsholing General Hospital, Phuentsholing, Bhutan
water was 87 and 65%, respectively [24]; whereas by 2011, coverage of sanitary latrines and safe drinking water in-creased to 91 and 83%, respectively [25].
While the patterns of the climate–diarrhoea relationship have been described elsewhere in the world [11, 26], no investigation of such a relationship has been carried out in Bhutan. Additionally, no previous studies have been undertaken using spatiotemporal modelling approaches to identify spatial and temporal clusters of diarrhoea in Bhutan. Therefore, this paper aimed to: (i) describe sea-sonal patterns and temporal trends in diarrhoea, and (ii) identify local clusters of diarrhoea at district level and de-termine the association between climatic factors such as maximum temperature and rainfall and the spatiotempo-ral distribution of the disease.
Methods
Data source
In this study, nationwide data on diarrhoeal disease were obtained for 2003 to 2013 from the Health Information and Management System (HIMS), Ministry of Health, Bhutan. These data contain the diarrhoea cases reported by health centers through district health offices to the HIMS. The reported data were aggregated by age (<5 years or≥5 years) and gender. Population estimates used in this study were from the National Statistical Bureau (NSB) and the Office of the Census Commissioner of Bhutan [27, 28]. Climatic variables (temperature and rain-fall) for respective districts were obtained from the De-partment of Hydro Met Services under the Ministry of Economic Affairs, Bhutan.
Exploration of seasonal patterns and temporal trends The average monthly diarrhoea incidence, rainfall and temperature were calculated from the full time-series. These were plotted to show temporal patterns in rhoea and weather variables. The time series of diar-rhoea incidence was decomposed using seasonal-trend decomposition based on locally weighted regression to show: the seasonal pattern, the temporal trend and the residual variability. This method uses loess smoothing on sub-series of each season (i.e. month in this case) separately to estimate the seasonal pattern. The seasonal component is then removed from the time series prior to further smoothing to estimate the trend, leaving the residual values.
Data analysis
Initially, a preliminary Poisson regression of diarrhoea cases was undertaken to select covariates. Two climatic variables were entered as covariates, namely maximum temperature and rainfall, without a lag, and with 1 month and 2 month lag times. The covariates from the model with the lowest
Akaike’s information criterion (AIC) and Bayesian informa-tion criterion (BIC) were included in the final analysis.
Separate Poisson regression models were constructed in a Bayesian framework using the WinBUGS software, ver-sion 1.4.3 (MRC Biostatistics Unit 2008). The first model (Model I), assumed that spatial autocorrelation was not present in the relative risk of diarrhoea. This model was developed including temperature, rainfall, age (<5 and≥5 years) and gender as explanatory variables, and unstruc-tured random effect for districts; the second model (Model II) included the same explanatory variables and a spatially structured random effect; the final model (Model III), a convolution model, contained all of the components of the preceding two models.
The last model assumed that the observed counts of diarrhoea,Y, for ith district (i = 1..20) in the jth month (January 2003–December 2013) followed a Poisson dis-tribution with mean (μij), that is,
Yij∼PoissonðμijÞ logðμijÞ ¼logðEijÞ þθij
θij¼αþβ1Tempmaxijþβ2Rainfallij
þβ3Ageþβ4Sexþuiþsi
where Eij is the expected number of cases in district i,
month j (acting as an offset to control for population size) and θij is the mean log relative risk (RR); α is the
intercept, andβ1,β2,β3,andβ4the coefficients for
max-imum temperature, rainfall, age and sex, respectively; ui
is the unstructured random effect with mean zero and varianceσu2and si is the spatially structured random
ef-fect with mean zero and varianceσs2.
A conditional autoregressive (CAR) prior structure was used to model the spatially structured random effect. Spatial relationships between the districts were determined using an adjacency weights matrix. For two districts sharing a border, a weight of 1 was assigned, while for pairs of dis-tricts not sharing a border, a weight of 0 was assigned. A flat prior distribution was specified for the intercept, whereas a non-informative normal prior distribution was used for the coefficients. The priors for the precision of un-structured and spatially un-structured random effects were specified using non-informative gamma distributions with shape and scale parameters equal to 0.01.
(DIC) was calculated for model selection, where a lower DIC indicates a better model fit. In all analyses, an α-level of 0.05 was adopted to indicate statistical significance (as in-dicated by 95% CrI for relative risks (RR) that excluded 1).
Seasonality decomposition was carried out using the R statistical package, release 3.3.1. ArcMap software was used to generate the maps of spatial distribution of pos-terior means of the unstructured and structured random effects obtained from the three models.
Results
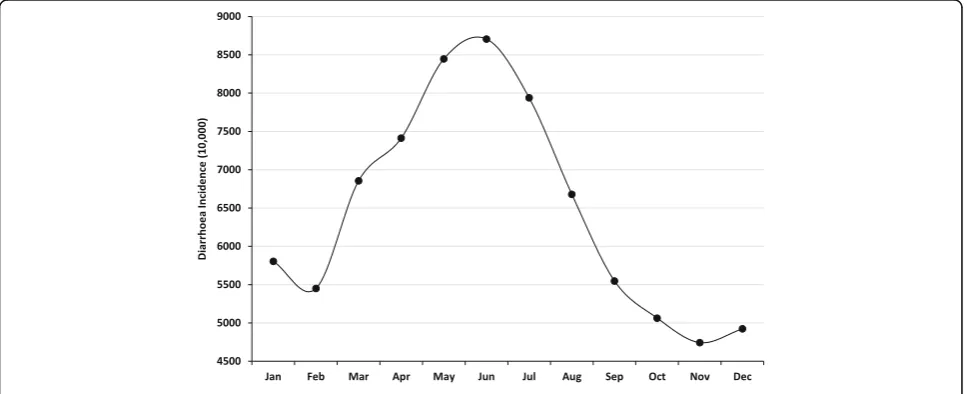
Exploration of seasonal patterns and temporal trends A total of 1,483,316 diarrhoea cases were notified to HMIS by different health centres of Bhutan from 1 January 2003 to 31 December 2013. The cases fluctuated during the study period, with the highest number of cases reported in 2009 followed by 2013 with 140,703 and 139,666 cases, respectively. Lowest numbers of cases were recorded in 2010 followed by 2011 with 129,369 and 129, 670 cases. In both sex less than 40% of cases were in chil-dren (<5 years). The monthly average diarrhoea incidence during the study period showed two peaks, with a small peak in January and a much larger peak in June. There was a lower incidence towards the end of the year from September–December, with the lowest reported incidence in November (Fig. 1).
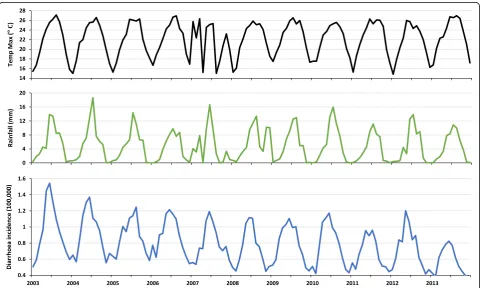
The seasonal patterns of rainfall, and maximum temperature showed warmer, wetter months in the middle of the year (June and July) and cooler, dryer months tra-versing the end of the year (November to February). The two hottest years were 2003 and 2013, while two wettest years were 2004 and 2007. The lowest rainfall was recorded in 2006 and 2013 respectively (Figs. 2 and 3).
The time-series decompositions of the diarrhoea case numbers show clear seasonal patterns with the major
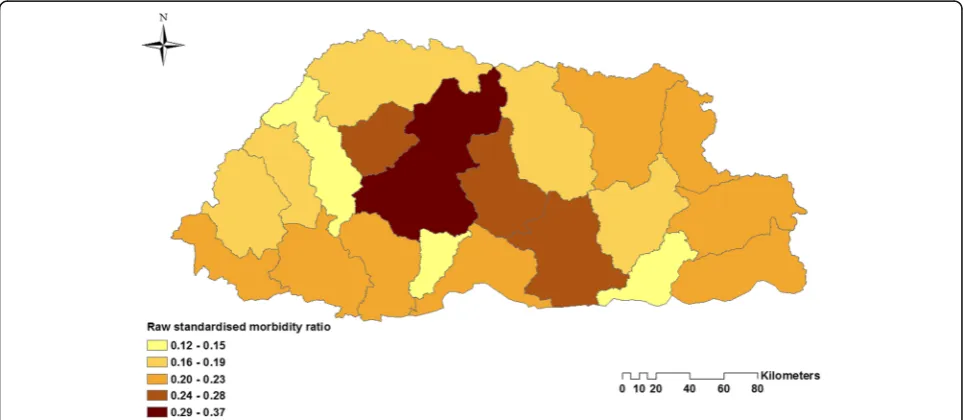
peak in June and a declining trend until 2013, but with a resurgence in 2014 (Fig. 4). The map of standardised morbidity ratios (SMR) by districts show that higher cases of diarrhoea is observed in the central part of Bhutan (Fig. 5).
Association between diarrhoea and climatic factors Models containing the climatic factors (maximum temperature and total rainfall) without a lag had the best fit, with lower AIC and BIC. Both maximum temperature and total rainfall for each district were significantly (p <0.0001) associated with the incidence of diarrhoea in the preliminary models (Table 1).
Spatio-temporal model
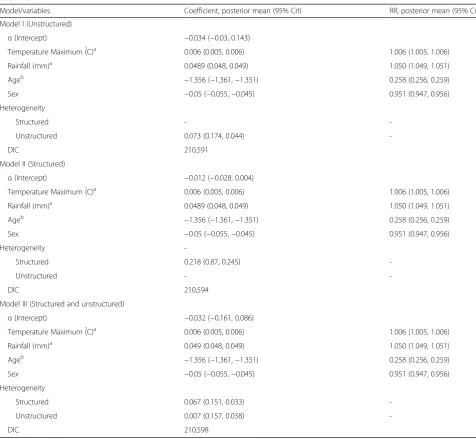
When the three models were compared using the DIC, Model I containing unstructured random effects had the best fit. In Model I, there was found to be an increase in diarrhoea cases by 0.6% (95% CrI: 0.5–0.6%) for every degree increase in maximum temperature; and an in-crease in diarrhoea cases of 5% (95 Cr I: 4.9–5.1%) for a 1 mm increase in rainfall. Children aged <5 years were found to be 74.2% (95% CrI: 74.1–74.4) more likely to experience diarrhoea than children and adults aged
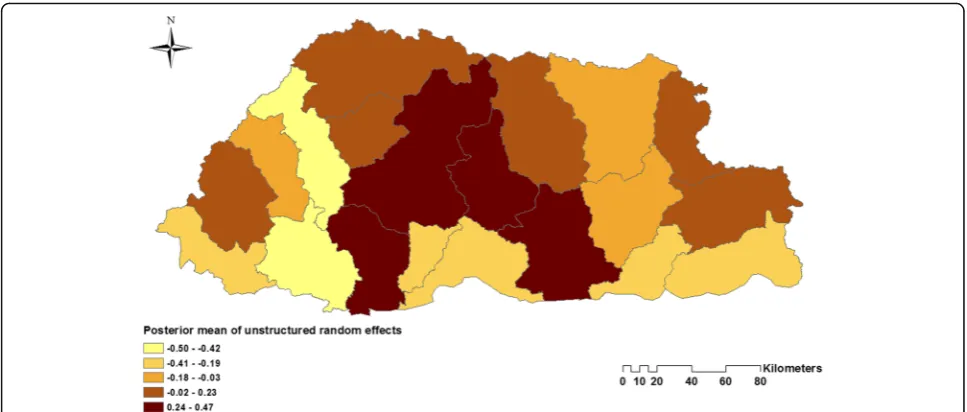
≥5 years; and females were found to be 4.9% (95% CrI: 4.4–5.3%) less likely to suffer from diarrhoea as com-pared to males (Table 2). The maps of the posterior means of the spatially unstructured random effects demonstrated little evidence of spatial clustering after accounting for the model covariates (Fig. 6, Additional file 1: Figure S1 and Additional file 2: Figure S2).
Discussion
This is the first study to explore spatiotemporal pat-terns of diarrhoea in Bhutan at the national level. The
[image:3.595.57.541.522.719.2]findings from this study showed clear seasonal patterns in diarrhoeal incidence with two peaks every year, December–January and the largest peak occurring in June, at the same time that temperature and rainfall demonstrate seasonal peaks. A study in the capital city Thimphu showed that rotavirus infection was highest during the winter-spring (December–April) season, while diarrhoea was highest during the summer (May–
July) [29]. Similar significant peaks of rotavirus were observed during the cold months in India [30].
There was positive association between climatic variable and diarrhoea cases and a negative association with increas-ing age and beincreas-ing female. There was no evidence of spatial clustering of diarrhoea risk after accounting for the covari-ates, suggesting that variability in rainfall and temperature explain much of the spatiotemporal dynamics of the disease. Fig. 2Monthly averages of rainfall (blue) and maximum temperature (black)
[image:4.595.59.540.86.280.2] [image:4.595.58.540.428.716.2]The use of time-series analysis can provide valuable in-sights into the seasonal patterns of diarrhoea transmission. The seasonality in the annual incidence of diarrhoeal dis-ease in Bhutan supports the role of climatic drivers, as have been implicated in other countries [31–33]. The positive re-lationships between diarrhoea and temperature and rainfall in our present study is broadly consistent with previous studies in Japan, China, Peru, Fiji, and Bangladesh [15, 18, 34–37]. The WHO and the Intergovernmental Panel on Climate Change (IPCC) have identified changes in the
incidence of diarrhoea as one of the most important future health effects of climate change [38].
The positive association between temperature and diarrhoea is biologically plausible given that higher tem-peratures promote the growth of bacteria, although some enteric viruses have been suggested to increase survival and transmission under lower temperatures [39]. Increased temperatures could lead to food poison-ing because food spoils easily in warmer weather [40]. Higher temperature can also lead to dietary and hygiene Fig. 4Decomposed total diarrhoea time-series. Data presented as incidence rates per 10,000 population
[image:5.595.58.540.86.330.2] [image:5.595.57.543.504.714.2]variations with increased demand for water, water short-ages and sub-optimal sanitation, which could facilitate transmission of bacteria and other pathogens.
Diarrhoea cases increased with the amount of rainfall in our study. There are a number of plausible explanation for this occurrence; firstly, the main source of drinking water in Bhutan is surface water from streams. Increased rainfall may affect levels of contaminates in the drinking water as had been reported elsewhere [17, 20, 37, 41]. This could be true for Bhutan because most water from the rural water supply scheme (RWSS) is not chemically treated as op-posed to water in urban settings. Secondly, increased rain-fall can cause flooding and changes in living environment. Floodwaters can foster the growth of many pathogens and lead to contamination of the food supply. Importantly, flood water can incapacitate the sewage system and in-crease transmission of diarrhoeal pathogens [42–44].
The risk of diarrhoea cases was lower in people aged
≥5 years in this study confirming diarrhoea is primarily a disease of children [45–48]. Rotavirus is the most common cause of diarrhoea among children <5 years of age globally [49, 50]. The underlying pathogens for diarrhoea was not reported in this study. However, a study in Thimphu district of Bhutan reported 22.3% of the stools were positive for rotavirus in children <5 years of age with diarrhoea [29]. Immunization against rotavirus in not routinely adminis-tered in children in Bhutan. Introducing immunization against rotavirus is likely to significantly reduce childhood diarrhoea. Other studies have reported significant reduc-tions in both diarrhoea deaths and diarrhoea-related hos-pital admissions following rotavirus vaccination [51, 52]. As in many other studies, females were found to be less likely than males to suffer from diarrhoea [53, 54], although this has not always been found to be the case elsewhere [55]. The risk of diarrhea in females being greater than males could be as a result of possible gender inequalities in health-care seeking and differential in the care of female children [56–59]. In addition, females are at a higher risk of other medical conditions such as irritable bowel syndrome that could lead to diarrhoea [60, 61].
[image:6.595.56.540.87.293.2]Whilst no residual spatial clustering was identified, high-incidence districts were Dagana, Trongsa, Wang-due, and Zhemgang. The levels of sanitation and access to safe drinking water in these districts were reported to be amongst the lowest in Bhutan [25] and poverty indi-cators for these districts are among the worst in the country [62]. Poverty and sanitation are an important determinants of diarrhoea risk [63, 64]. It would be worthwhile to explore these variables in models in the future, if there variables become available.
Table 1Covariate effects from preliminary models of diarrhoea incidence, Bhutan, 2003–13
Climatic variables RR 95% CI Pvalue AIC BIC
No lag
Temp max 0.996 0.995, 0.996 <0.0001 184,006.6 184,024.2
Rainfall 0.998 0.997, 0.998 <0.0001
Lag 1 month
Temp max 0.996 0.995, 0.996 <0.0001 184,760.8 184,778.4
Rainfall 0.998 0.998, 0.999 <0.0001
Lag 2 months
Temp max 0.998 0.997, 0.998 <0.0001 184,555.9 184,573.5
Rainfall 0.998 0.998, 0.998 <0.0001
[image:6.595.56.291.591.731.2]There are several limitations in this study. First, diarrhoea cases were not all laboratory confirmed. Second, age could not be stratified as <1 year and 1-4 years because surveil-lance data from 2003 to 2009 aggregated all diarrhea cases <5 years into one group. Third, people with mild forms of diarrhoea may not seek medical care and remain unre-ported and access to health care may vary across districts leading to differences in reporting of diarrhoea –the im-pact of reporting bias on observed spatiotemporal patterns is difficult to assess. Fourth, the underlying pathogens were not reported, which prevented examination of the dynamics of specific pathogens. Of note, other explanations for sea-sonal variation in diarrhoea also need to be considered,
such as temporal oscillations in host susceptibility due to changes in neuroendocrine function and immune response [65].
Conclusion
[image:7.595.57.534.106.545.2]In conclusion, incidence of diarrhoea in Bhutan was highly seasonal and strongly associated with local weather factors, including temperature and rainfall. This calls for public health actions to reduce future risks of climate change with great consideration of local climatic conditions. In addition, protection of <5 years children should be prioritize through provision Table 2Regression coefficients, RRs and 95% CrI from Bayesian spatial and non-spatial models of diarrhoea incidence, Bhutan, 2003–13
Model/variables Coefficient, posterior mean (95% CrI) RR, posterior mean (95% CrI)
Model I (Unstructured)
α(Intercept) −0.034 (−0.03, 0.143)
Temperature Maximum (̊C)a 0.006 (0.005, 0.006) 1.006 (1.005, 1.006)
Rainfall (mm)a 0.0489 (0.048, 0.049) 1.050 (1.049, 1.051)
Ageb −1.356 (−1.361,−1.351) 0.258 (0.256, 0.259)
Sex −0.05 (−0.055,−0.045) 0.951 (0.947, 0.956)
Heterogeneity
Structured -
-Unstructured 0.073 (0.174, 0.044)
-DIC 210,591
Model II (Structured)
α(Intercept) −0.012 (−0.028, 0.004)
Temperature Maximum (̊C)a 0.006 (0.005, 0.006) 1.006 (1.005, 1.006)
Rainfall (mm)a 0.0489 (0.048, 0.049) 1.050 (1.049, 1.051)
Ageb −1.356 (−1.361,−1.351) 0.258 (0.256, 0.259)
Sex −0.05 (−0.055,−0.045) 0.951 (0.947, 0.956)
Heterogeneity
-Structured 0.218 (0.87, 0.245)
-Unstructured -
-DIC 210,594
Model III (Structured and unstructured)
α(Intercept) −0.032 (−0.161, 0.086)
Temperature Maximum (̊C)a 0.006 (0.005, 0.006) 1.006 (1.005, 1.006)
Rainfall (mm)a 0.049 (0.048, 0.049) 1.050 (1.049, 1.051)
Ageb −1.356 (−1.361,−1.351) 0.258 (0.256, 0.259)
Sex −0.05 (−0.055,−0.045) 0.951 (0.947, 0.956)
Heterogeneity
Structured 0.067 (0.151, 0.033)
-Unstructured 0.007 (0.157, 0.038)
-DIC 210,598
a
District specific
b
of rotavirus vaccination, safe and clean drinking water, and proper latrines.
Additional files
Additional file 1: Figure S1.Spatial distribution of the posterior means of structured random effects for diarrhoea in Bhutan in Model II. (TIFF 2238 kb)
Additional file 2: Figure S2.Spatial distribution of the posterior means of random effects for diarrhoea in Bhutan in Model III. (a) Spatially unstructured random effects (b) structured random effects. (TIFF 2610 kb)
Abbreviations
AIC:Lowest Akaike’s information criterion; BIC: Bayesian information criterion; CAR: Conditional autoregressive; CrI: Credible intervals; DIC: Deviance information criterion; HIMS: Health information and management system; IPCC: Intergovernmental panel on climate change; NSB: National Statistical Bureau; RR: Relative risk; RWSS: Rural water supply schemes;
SMR: Standardised morbidity ratios; WHO: World Health Organization
Acknowledgements
We would like to than Ministry of Health, Bhutan for allowing us to use surveillance data to carry out this analysis. Our deepest gratitude goes to Department of Hydro Met Services under the Ministry of Economic Affairs, Bhutan for providing climatic variables.
Funding
None.
Availability of data and materials
The dataset and materials used for this study can be made available only upon the approval by the Ministry of Health and Ministry of Economic Affairs, Bhutan.
Authors’contributions
KW and ACAC conceived the overall study. KW undertook statistical analysis and interpretation of results and drafted the manuscript. ACAC assisted in statistical analysis, interpretation of results and was involved in the critical revision of the manuscript. Both authors read and approved the final manuscript.
Ethics approval and consent to participate
Administrative approval to use these dataset was provided by the Ministry of Health, Royal Government of Bhutan.
Consent for publication
Not applicable.
Competing interests
The authors declare that they have no competing interests.
Publisher’s Note
Springer Nature remains neutral with regard to jurisdictional claims in published maps and institutional affiliations.
Received: 31 March 2017 Accepted: 18 July 2017
References
1. Pruss A, Kay D, Fewtrell L, Bartram J. Estimating the burden of disease from water, sanitation, and hygiene at a global level. Environ Health Perspect. 2002;110(5):537–42.
2. Kosek M, Bern C, Guerrant RL. The global burden of diarrhoeal disease, as estimated from studies published between 1992 and 2000. Bull World Health Organ. 2003;81(3):197–204.
3. Fontaine O, Kosek M, Bhatnagar S, Boschi-Pinto C, Chan KY, Duggan C, Martinez H, Ribeiro H, Rollins NC, Salam MA, et al. Setting research priorities
to reduce global mortality from childhood diarrhoea by 2015. PLoS Med. 2009;6(3):e41.
4. Diarrhoeal disease. [http://www.who.int/mediacentre/factsheets/fs330/en/]. Accessed 19 Aug 2016.
5. Black RE, Morris SS, Bryce J. Where and why are 10 million children dying every year? Lancet. 2003;361(9376):2226–34.
6. UNICEF: Progress for children. 2006.
7. Charron D, Thomas M, Waltner-Toews D, Aramini J, Edge T, Kent R, Maarouf A, Wilson J. Vulnerability of waterborne diseases to climate change in Canada: a review. J Toxicol Environ Health A. 2004;67(20–22):1667–77. 8. Zhou X, Zhou Y, Chen R, Ma W, Deng H, Kan H. High temperature as a risk
factor for infectious diarrhea in shanghai, China. J Epidemiol. 2013;23(6): 418–23.
9. Harper SL, Edge VL, Schuster-Wallace CJ, Berke O, McEwen SA. Weather, water quality and infectious gastrointestinal illness in two Inuit communities in Nunatsiavut, Canada: potential implications for climate change. EcoHealth. 2011;8(1):93–108.
10. Curriero FC, Patz JA, Rose JB, Lele S. The association between extreme precipitation and waterborne disease outbreaks in the United States, 1948-1994. Am J Public Health. 2001;91(8):1194–9.
11. Schuster CJ, Ellis AG, Robertson WJ, Charron DF, Aramini JJ, Marshall BJ, Medeiros DT. Infectious disease outbreaks related to drinking water in Canada, 1974-2001. Can J Public Health. 2005;96(4):254–8.
12. Shah M, Kathiiko C, Wada A, Odoyo E, Bundi M, Miringu G, Guyo S, Karama M, Ichinose Y. Prevalence, seasonal variation, and antibiotic resistance pattern of enteric bacterial pathogens among hospitalized diarrheic children in suburban regions of central Kenya. Trop Med Health. 2016;44:39. 13. Wu J, Yunus M, Streatfield PK, Emch M. Association of climate variability and
childhood diarrhoeal disease in rural Bangladesh, 2000-2006. Epidemiol Infect. 2014;142(9):1859–68.
14. Xu Z, Hu W, Zhang Y, Wang X, Zhou M, Su H, Huang C, Tong S, Guo Q. Exploration of diarrhoea seasonality and its drivers in China. Sci Rep. 2015;5:8241. 15. Checkley W, Epstein LD, Gilman RH, Figueroa D, Cama RI, Patz JA, Black RE.
Effect of el Nino and ambient temperature on hospital admissions for diarrhoeal diseases in Peruvian children. Lancet. 2000;355(9202):442–50. 16. Pascual M, Rodo X, Ellner SP, Colwell R, Bouma MJ. Cholera dynamics and el
Nino-southern oscillation. Science. 2000;289(5485):1766–9.
17. Rinaldo A, Bertuzzo E, Mari L, Righetto L, Blokesch M, Gatto M, Casagrandi R, Murray M, Vesenbeckh SM, Rodriguez-Iturbe I. Reassessment of the 2010-2011 Haiti cholera outbreak and rainfall-driven multiseason projections. Proc Natl Acad Sci U S A. 2012;109(17):6602–7.
18. Singh RB, Hales S, de Wet N, Raj R, Hearnden M, Weinstein P. The influence of climate variation and change on diarrheal disease in the Pacific Islands. Environ Health Perspect. 2001;109(2):155–9.
19. Heyworth JS, Glonek G, Maynard EJ, Baghurst PA, Finlay-Jones J.
Consumption of untreated tank rainwater and gastroenteritis among young children in South Australia. Int J Epidemiol. 2006;35(4):1051–8.
20. Bhavnani D, Goldstick JE, Cevallos W, Trueba G, Eisenberg JN. Impact of rainfall on diarrheal disease risk associated with unimproved water and sanitation. Am J Trop Med Hyg. 2014;90(4):705–11.
21. Health Mo. Annual health bulletin 2014. Thimphu: Ministry of Health, Bhutan; 2014.
22. Health Mo. Annual health bulletin 2015. Thimphu: Ministry of Health, Bhutan; 2015.
23. Health Mo. Annual health bulletin 2016. Thimphu: Ministry of Health, Bhutan; 2016.
24. DHS. Annual health bulletin 2011.Thimphu: Ministry of Health and Education, Department of Health Services, Bhutan; 2011.
25. Health Mo. Annual health bulletin 2011. Thimphu: Ministry of Health, Bhutan; 2011.
26. Aramini J, McLean M, Wilson J, Holt J, Copes R, Allen B, Sears W. Drinking water quality and health-care utilization for gastrointestinal illness in greater Vancouver. Can Commun Dis Rep. 2000;26(24):211–4.
27. National Statistics Bureau: Dzongkhag population projection 2006–2015. 2008. 28. Office of the Census Commissioner: Results of Population & Housing, census
of Bhutan 2005. 2006.
30. Sarkar R, Kang G, Naumova EN. Rotavirus seasonality and age effects in a birth cohort study of southern India. PLoS One. 2013;8(8):e71616. 31. McCormick BJ, Alonso WJ, Miller MA. An exploration of spatial patterns of
seasonal diarrhoeal morbidity in Thailand. Epidemiol Infect. 2012;140(7): 1236–43.
32. Kelly-Hope LA, Alonso WJ, Thiem VD, Canh DG, Anh DD, Lee H, Miller MA. Temporal trends and climatic factors associated with bacterial enteric diseases in Vietnam, 1991-2001. Environ Health Perspect. 2008;116(1):7–12. 33. Alonso WJ, Acuna-Soto R, Giglio R, Nuckols J, Leyk S, Schuck-Paim C, Viboud
C, Miller MA, McCormick BJ. Spatio-temporal patterns of diarrhoeal mortality in Mexico. Epidemiol Infect. 2012;140(1):91–9.
34. Onozuka D. Effect of non-stationary climate on infectious gastroenteritis transmission in Japan. Sci Rep. 2014;4:5157.
35. Zhang Y, Bi P, Hiller JE, Sun Y, Ryan P. Climate variations and bacillary dysentery in northern and southern cities of China. J Inf Secur. 2007;55(2): 194–200.
36. Onozuka D, Hashizume M. Weather variability and paediatric infectious gastroenteritis. Epidemiol Infect. 2011;139(9):1369–78.
37. Hashizume M, Armstrong B, Hajat S, Wagatsuma Y, Faruque AS, Hayashi T, Sack DA. Association between climate variability and hospital visits for non-cholera diarrhoea in Bangladesh: effects and vulnerable groups. Int J Epidemiol. 2007;36(5):1030–7.
38. Walker CL, Rudan I, Liu L, Nair H, Theodoratou E, Bhutta ZA, O'Brien KL, Campbell H, Black RE. Global burden of childhood pneumonia and diarrhoea. Lancet. 2013;381(9875):1405–16.
39. Hallett TB, Coulson T, Pilkington JG, Clutton-Brock TH, Pemberton JM, Grenfell BT. Why large-scale climate indices seem to predict ecological processes better than local weather. Nature. 2004;430(6995):71–5. 40. Bentham G, Langford IH. Environmental temperatures and the incidence of
food poisoning in England and Wales. Int J Biometeorol. 2001;45(1):22–6. 41. Carlton EJ, Eisenberg JN, Goldstick J, Cevallos W, Trostle J, Levy K. Heavy
rainfall events and diarrhea incidence: the role of social and environmental factors. Am J Epidemiol. 2014;179(3):344–52.
42. Ding G, Zhang Y, Gao L, Ma W, Li X, Liu J, Liu Q, Jiang B. Quantitative analysis of burden of infectious diarrhea associated with floods in northwest of anhui province, china: a mixed method evaluation. PLoS One. 2013;8(6):e65112. 43. Siddique AK, Baqui AH, Eusof A, Zaman K. 1988 floods in Bangladesh:
pattern of illness and causes of death. J Diarrhoeal Dis Res. 1991;9(4):310–4. 44. Kolstad EW, Johansson KA. Uncertainties associated with quantifying climate
change impacts on human health: a case study for diarrhea. Environ Health Perspect. 2011;119(3):299–305.
45. Ahmed SF, Farheen A, Muzaffar A, Mattoo GM. Prevalence of diarrhoeal disease, its seasonal and age variation in under- fives in Kashmir, India. Int J Health Sci (Qassim). 2008;2(2):126–33.
46. Chowdhury F, Khan IA, Patel S, Siddiq AU, Saha NC, Khan AI, Saha A, Cravioto A, Clemens J, Qadri F, et al. Diarrheal illness and healthcare seeking behavior among a population at high risk for Diarrhea in Dhaka,
Bangladesh. PLoS One. 2015;10(6):e0130105.
47. Bryce J, Boschi-Pinto C, Shibuya K, Black RE. WHO estimates of the causes of death in children. Lancet. 2005;365(9465):1147–52.
48. Malek MA, Curns AT, Holman RC, Fischer TK, Bresee JS, Glass RI, Steiner CA, Parashar UD. Diarrhea- and rotavirus-associated hospitalizations among children less than 5 years of age: United States, 1997 and 2000. Pediatrics. 2006;117(6):1887–92.
49. Tate JE, Burton AH, Boschi-Pinto C, Parashar UD. Global, regional, and National Estimates of rotavirus mortality in children <5 years of age, 2000-2013. Clin Infect Dis. 2016;62(Suppl 2):S96–s105.
50. Parashar UD, Gibson CJ, Bresee JS, Glass RI. Rotavirus and severe childhood diarrhea. Emerg Infect Dis. 2006;12(2):304–6.
51. do Carmo GM, Yen C, Cortes J, Siqueira AA, de Oliveira WK, Cortez-Escalante JJ, Lopman B, Flannery B, de Oliveira LH, Carmo EH, et al. Decline in diarrhea mortality and admissions after routine childhood rotavirus immunization in Brazil: a time-series analysis. PLoS Med. 2011;8(4):e1001024. 52. de Palma O, Cruz L, Ramos H, de Baires A, Villatoro N, Pastor D, de Oliveira
LH, Kerin T, Bowen M, Gentsch J, et al. Effectiveness of rotavirus vaccination against childhood diarrhoea in El Salvador: case-control study. BMJ. 2010; 340:c2825.
53. Siziya S, Muula AS, Rudatsikira E. Correlates of diarrhoea among children below the age of 5 years in Sudan. Afr Health Sci. 2013;13(2):376–83.
54. Melo MC, Taddei JA, Diniz-Santos DR, Vieira C, Carneiro NB, Melo RF, Silva LR. Incidence of diarrhea in children living in urban slums in Salvador, Brazil. Braz J Infect Dis. 2008;12(1):89–93.
55. Tornheim JA, Manya AS, Oyando N, Kabaka S, O'Reilly CE, Breiman RF, Feikin DR. The epidemiology of hospitalization with diarrhea in rural Kenya: the utility of existing health facility data in developing countries. Int J Infect Dis. 2010;14(6):e499–505.
56. Campbell JD, Sow SO, Levine MM, Kotloff KL. The causes of hospital admission and death among children in Bamako, Mali. J Trop Pediatr. 2004; 50(3):158–63.
57. Mitra AK, Rahman MM, Fuchs GJ. Risk factors and gender differentials for death among children hospitalized with diarrhoea in Bangladesh. J Health Popul Nutr. 2000;18(3):151–6.
58. Diouf K, Tabatabai P, Rudolph J, Marx M. Diarrhoea prevalence in children under five years of age in rural Burundi: an assessment of social and behavioural factors at the household level. Glob Health Action. 2014;7:24895. 59. Das SK, Nasrin D, Ahmed S, Wu Y, Ferdous F, Farzana FD, Khan SH, Malek
MA, El Arifeen S, Levine MM, et al. Health care-seeking behavior for childhood diarrhea in Mirzapur, rural Bangladesh. Am J Trop Med Hyg. 2013; 89(1 Suppl):62–8.
60. Herman J, Pokkunuri V, Braham L, Pimentel M. Gender distribution in irritable bowel syndrome is proportional to the severity of constipation relative to diarrhea. Gend Med. 2010;7(3):240–6.
61. Lee SY, Kim JH, Sung IK, Park HS, Jin CJ, Choe WH, Kwon SY, Lee CH, Choi KW. Irritable bowel syndrome is more common in women regardless of the menstrual phase: a Rome II-based survey. J Korean Med Sci. 2007;22(5):851–4. 62. NSB. Bhutan poverty Assessmnet 2014. Thimphu: Narional Statistics Bureau,
Royal Government of Bhutan; 2014.
63. Amugsi DA, Aborigo RA, Oduro AR, Asoala V, Awine T, Amenga-Etego L. Socio-demographic and environmental determinants of infectious disease morbidity in children under 5 years in Ghana. Glob Health Action. 2015;8:29349. 64. Genser B, Strina A, dos Santos LA, Teles CA, Prado MS, Cairncross S, Barreto
ML. Impact of a city-wide sanitation intervention in a large urban centre on social, environmental and behavioural determinants of childhood diarrhoea: analysis of two cohort studies. Int J Epidemiol. 2008;37(4):831–40. 65. Dowell SF. Seasonal variation in host susceptibility and cycles of certain
infectious diseases. Emerg Infect Dis. 2001;7(3):369–74.
• We accept pre-submission inquiries
• Our selector tool helps you to find the most relevant journal
• We provide round the clock customer support
• Convenient online submission
• Thorough peer review
• Inclusion in PubMed and all major indexing services
• Maximum visibility for your research
Submit your manuscript at www.biomedcentral.com/submit