Rochester Institute of Technology
RIT Scholar Works
Theses
Thesis/Dissertation Collections
2001
To investigate the reasons for moisture ingress in
ready to drink mixes
Rahul N. Eklahare
Follow this and additional works at:
http://scholarworks.rit.edu/theses
This Thesis is brought to you for free and open access by the Thesis/Dissertation Collections at RIT Scholar Works. It has been accepted for inclusion
in Theses by an authorized administrator of RIT Scholar Works. For more information, please contact
ritscholarworks@rit.edu
.
Recommended Citation
To Investigate
The
Reasons
For
Moisture Ingress In
Ready
To Drink Mixes
By
Rahul N. Eklahare
A Thesis
Submitted
to the
College
ofApplied Science
andTechnology
Rochester Institute
ofTechnology
in
partialfulfillment
ofthe
requirementsfor
the
degree
ofMASTER OF SCIENCE
Department
ofPackaging
Science
COLLEGE OF APPLIED SCIENCE AND TECHNOLOGY
ROCHESTER INSTITUTE OF TECHNOLOGY
ROCHESTER, NEW YORK
CERTIFICATE OF APPROVAL
M.S. DEGREE THESIS
The M.S. Degree thesis ofRahul Eklahare has been examined and approved by the thesis
committee as satisfactory for the thesis requirements for the Master of Science Degree
Fritz Yambrach
Date
Michael Bayusik
Tide
ofThesis
:To Investigate The
Reasons
For
Moisture
Ingress In
Ready
To
Drink Mixes
Acknowledgements
I
wouldlike
to
expressmy
sincere gratitudeto
Professor
Fritz
Yambrach for
his
guidanceand patience
during
the
research ofthis thesis.
He
has been
aterrific
source ofmotivationto
me.A
specialthanks to
Mr. Mike Bayusik
ofOntario Foods
whogave me anopportunity
to work onthis
project.He
providedallthe
support andencouragementto
carry
outthe tests
andresearchwork.I
wouldalsolike
to thank
Professor
Deana Jacobs
to
have
provided allthe
assistancethat
I
Abstract
The
objective ofthis
study
wasto
determine
the
reasonsfor
moistureingress in ready
to
drink
mixes.The
containersfor
this
product were supposedto
be
moistureresistant.However,
after a certain periodit
wasobservedthat the
productinside
wasproneto
caking
andlump
formation
due
to
moistureingress.
The
dimensions
ofthe
containers were compared withthe
actualdimensions
andthe
containers wereexposed
to
acceleratedaging
to
simulate alonger
duration
of shelflife.
Several
recommendations were madefor
newdesign
of containers which werealsoContents
Page
Introduction
1
Problem
andits
setting
3
Ready
to
Drink Mixes
4
Sub
problems7
Approach
to
Statistical Analysis
8
Hypotheses
1 1
The
Package
12
Testing
ofthe
First
Hypothesis
13
Accelerated
Aging
18
Test Set up
21
Results
23
Charts
25
Conclusion
33
The
Packaging
Line Environment
34
Recommendations
for
further
study
36
Bibliography
i
List
ofTables
Table 1
-Old Container
Dimensions
14
Table 2
-New Container Dimensions
1 7
Introduction
Business in
the
late
20thCentury
andthe
21stCentury
is
not restrictedto
manufacturing
products andselling
them to customers;
it
is
focused
moretowards
satisfying
the
customers'needs and
desires. Customer
is
aking
of sortswithdifferent brands
ofproducts ofthe
sametype
chasing him in every
market, store,
mallandshopping
center.Customer
satisfactiondrives
companiesto
striveto
maketheirproductsbetter
and cost
less. Companies invest
thousands
ofdollars in
developing
quality
parameters,
quality
controls etc. which would ensure cost reduction and costcontrol
in
the
long
run.Increased
competitionhas
led
to
reductionin
prices andlower
margins.Business for
mostindustries is based
onlow
margins andhigh
volumes.Companies
cannot affordinefficiencies
andlosses
during
the
entireproductionand
distribution
process orthe
supply
chain.For
products whichhave
a restricted shelflife
and canbe
subjectedto
spoilage with
inefficient
handling,
companieshave
to
ensurethat the
productsaresoldwithin
the
specifiedtimeframe
and are not spoiltin
thesupply
chain.However,
in
real worldbusiness,
losses do
occur,
spoilagedoes
occur,
customers
tend
to
getdefective
goods and to salvagetheir
reputationcompanies
have
to
acceptthe
sales returnsandbear losses. These
losses
runin
to
millions ofdollars
annually.They
affectthe margins andin
some casesthe
bottom
line
ofmany
organizations.plays a
very
important
rolein
the
marketing
aspect as well asthe
productsafety
anddurability
aspect.There
is
probably
not a single producttoday
whichisn't
packaged and sold.Packaging
has
animportant
roleto
play
in
maintaining
the
quality
ofthe
productstill
they
reachthe
customers.Packaging
for food
products,
pharmaceuticals and medicaldevices
is
one ofthe
mostchallenging fields
today
andis
responsiblefor
maintaining the
shelflife,
safety
andquality
ofthese
products.Packaging
minimizes orin
somecases eliminates product spoilage
due
to moisture, microorganisms,
light,
temperature,
gasesin
the atmosphere,
dust,
insects
and rodents.It is
easierto
investigate
spoilagein
afood
or pharmaceutical producttoday
by
first
investigating
the
packagefor any inefficiencies. If
the
packageis
found
to
be
inefficient,
modifications canbe
made andthe
problemis
solved.If
the
packageis
found
to
be
perfect, then
along
process ofinvestigating
the
product,
its manufacturing
process,
its
composition and environmenthas
tobe
undertaken.
In
mostcases,
however,
the
problemis
the
package andthe
problemis
solvedin
the
initial
stageitself.
The study here focused
on asimilarissue
where acompany
had
been
affectedby
sales returnsdue
to apparent spoilage of a product.The study
was anattempt
to
investigate
the
package ofthe
product as a possible reasonfor
that
spoilage.This study
was restrictedto the
initial
stage ofinvestigating
the
packageonly
and notthe
product.The
following
chapters give adetailed
description
ofthe
problemandthe
steps carried outin
the
investigation
ofthe
package.
Several
tests
and results obtainedare alsoincluded
for
the
benefit
of the reader.The
last
chapterdeals
on scopefor further
research and on areasThe Problem
andIts
Setting
The
producthere
was aready
to
drink
mix whichessentially
consisted of sugar.Sugar
is
hygroscopic
and proneto
moisture absorption andhas
to
be
packaged properly.The
product was manufactured, packaged andthen
distributed
to
various retail outlets acrossthe
country.The
distribution
environments as well asthe
region-specific environmentsfor
retail variedconsiderably
acrossthe
country.There
were regions ofhigh
humidity
wherethe
productwas proneto
moisture absorptionby
moistureingress
throughthe
package while
there
werelow
humidity
regions wherethere
wouldbe
little
or no moisture absorptionthrough the
package.In
certain casesthe
climatic conditions variedconsiderably
during
distribution
andthe
product was exposedto
varying
conditions over a certain periodtill
it
reached the retail shelf.The
container was supposed tobe
moisture resistant.However it
wasfound
that
over a certainperiod, there
waslump
formation
ofthe
sugardue
to
moisture
ingress
which was not acceptable to consumers andresultedin large
scale sales returns.This
meantthat the container,
designed for
moisture resistance wasn'tas effective.The study
was carried outto
investigate
the
reasonsfor
moistureingress
Ready
to
Drink
Mixes
The ready
to
drink
mixes are a class ofdry
products which containonly 1-3%
moisture and
have
e.r.h. valuesbelow 20%
andin
somecasesbelow 10%. The
humidity
of ambient airis
rarely
in
this
low
range and such productstend to
absorb moisturefreely
from
the
airsurrounding
them.
These
products are of porous nature andhave
ahigh
surfaceto
weightratio,
thereby
increasing
the
hygroscopicity.
The
uptake ofmoisturebeing
so rapidthat packaging
shouldbe done
in
an environmentwhere alow
relativehumidity
is
maintained.These
products are also susceptible to oxidativedeterioration
and mustbe
packagedin
containers which areimpermeable
to
water vapor and oxygen.If
these
products are
inadequately
packaged,
they
cake(form
lumps)
and will not reconstitutein
mostcases,
and can alsolose
much oftheir
volatileflavoring
components.Several
studieshave been
conducted onpackaging for hygroscopic
productsand moisture
ingress
through
containers.The
reasons attributedto this
are :1)
Dimensional
instability. Improper cap
andbottle
assembly.2)
Material
selectionfor cap
andbottle.
3) Manufacturing
process ofthe
cap
andbottle.
4)
Machine
variations.5)
Humid
conditionsatthepackaging line. No
special caretaken to
makethe
packaging line
more efficientfor packaging
of such moisture sensitive products.i)
Moisture
absorptionin
Snack
foods
andBakery
productshas been
ofconcern and several studies
have been
undertakento
investigate
the
reasonsfor
moistureingress
through the
package.A study
by
'Food Product
Design'-Weeks
Publishing
Company
andauthored
by
Kimberlee J. Burrington
whois
the
whey
applications program-Faulty
sealsin packaging
(including
MAP)
resultin
areducedshelflife due
to
moisture absorption.
Proper
meansto
testthe
integrity
ofthe
package atthe
packaging line
is
important.
The
article statesthat
'water
migrationis
adifficult
processto
controlin
abaked
product,
especially
when productspossessing different
moistures andavailable water are
being
combined'
and
this
canonly be
controlledby
binding
ofwaterand goodpackaging.ii)
2000 North
Carolina Flue-Cured Tobacco Production Guide NC State
University by
M.D. Boyette
Extension
Specialist,
Department
ofBiological
and
Agricultural
Engineering
Measuring
andControlling
Moisture in
Cured Tobacco
Cured
tobacco
is hygroscopic. Hygroscopic
materialshave
a physicalaffinity
for
moisture.In
tobacco,
this
moistureis
absorbedfrom
the
watervaporin
the
air
surrounding
the
leaf. The
absorption of waterby
cured tobaccoleaves
is
acomplex process and
is dependent
onmany biological
and physicalfactors.
Biological
factors include
the
properties ofthe
leaf
that
vary
withvariety,
cultural
practices,
stalkposition,
and weather.The Physical factors
include
ordering
temperature
andhumidity,
airvelocity
aroundthe
surface ofthe
leaf,
and
quantity
and arrangement oftheleaves.
The
article statesthat
:1)
therate ofmoisture absorptionincreases
withincreasing
relativehumidity
2)
moisture absorption rates alsoincrease
dramatically
withincreasing
temperature
Different
methods ofdrying
have been
suggestedfor preserving
tobacco
but
the
important
pointhere
is
the
importance
ofmaintaining
environmentalfactors for
preservation ofhygroscopic
products atevery
stage.iii)
A study
by
Pittsburgh
Corning
FOAMGLASfor
Hershey
Creamery
moisture absorption
in
cold storage.It
highlights
the
following
important
points :Materials
with poordimensional stability
or whichlack in
compressivestrength,
would resultin
the
insulation
systemcompressing
underload,
warping,
orexpanding
andcontracting
andeventually causing distortion. This
distortion may
resultin
watervapor or water penetration.Thus reliability
of materialsis
animportant
considerationin
designing
Sub-problems
The
following
sub-problems resultedfrom
the
abovediscussion:
1)
To
determine
whetherthe
dimensions
ofthe
containers were as perthe
specifieddimensions
and withinthe tolerances
2)
To
evaluate moistureingress
through the
package system(consisting
ofthebody
andthe
cap)
Approach
to
Statistical Analysis
There
was an attemptin
this
researchto
deviate from
the
classic quantitativeapproach of statistical analysis
to
a qualitativeapproach.The
approach ofthis
research was such thatit
was morefocused
towards
apass and
fail
analysis whichled
to
anothertest
which wasagain subjectedto
apassor
fail
analysis and so on.The methodology involved
was called asNegative
Case Analysis
orAnalytic
Induction.
Analytic
induction is
a method ofdata
analysisdescribed
by
Florian
Znaniecki
(1934)
who namedthe
method and systematizedmany
ofthe
associated
ideas. Analytic induction
canbe
contrasted withdefining
andusing
terms
in
advance of research.Instead,
definitions
ofterms
are consideredduring
hypotheses
that areto
be
tested.
Inductive,
ratherthan
deductive,
reasoning
is
involved.
This
allowsfor
a modification of concepts andrelationships
between
concepts,
which occursthroughout the
process ofdoing
research,
withthe
goal of mostaccurately representing
the
reality
ofthe
situation.
The
goal of researchis making
universal statementsthat
may
needto
be
modified
later if
exceptions arediscovered,
but ultimately
can reflectfairly
exhaustive
knowledge
ofwhatis
researched.This
is essentially
a process ofrevising hypotheses
withhindsight. As
the
researcherdevelops
ahypothesis
orexplanation
through
aninductive
process such asthe
constant comparativemethod,
additionalfield data
are generated and putto
the
test
ofthe
hypothesis. If
the
newdata
confirmthe
hypothesis,
it becomes
stronger.But
if
some aspect of
the
newdata disconfirms
the
hypothesis,
or relatesto
it
The
analystkeeps considering
newdata,
andrevising
the
hypothesis,
untilthere
are no more negative casesto
accountfor.
Ultimately,
negative caseanalysis results
in
ahighly
confident statement about aphenomenon, onethat
even approaches universalcoverage.
To
summarizethe
abovediscussion,
Analytic
Induction
Approach
to
Qualitative Research
involves
the
following:
Define
aHypothesis
Collect
additionaldata
to
testfit
ofthe
hypothesis
Redefine
questions or reformulatehypothesis
based
onfurther data
collection andanalysis
The
approachto
Negative Case Analysis (Graphical
Representation)
Define
Hypothesis
V
Collect Data
ir
Test
data for
successorfailure
ofhypothesis
k.M
1r
Does
data
approve
hypothesis ?
NO
Revise Hypothesis
Collect Data
w w
i
res
r_
Test
with moredata
r i
Hypothesis
is Stronger
I
Highly
confident statementaboutaphenomenon
Hypotheses
The
sub problemsdefined
earlierlead
to the
following
hypotheses
which areto
be
testedone afterthe
other.The failure
of onehypothesis leads
tothe
next sub problem andfurther
research
has
to
be
carried outto test
the secondhypothesis
until thereis
aconfirmation
to the
hypothesis.
However,
if
thefirst hypothesis is
asuccessorthere
is
astep
taken to
correctthe problem which confirmsthe
acceptance ofthe
first
hypothesis,
further
researchis
carried out to makethe
argumentsstrongerand
ultimately
to
resultin
a more efficient and refined approach.1st
Hypothesis
(Null)
:There
is
no significantdifference
between
the actualandspecified
dimensions
2nd
Hypothesis
(Null)
:There
is
no significant moisture absorptionby
theDessicant
3rd
Hypothesis
(Null)
:There
are nolimitations
in
the
Packaging
Line
Environment
andtheCapping
Process.
The Package
The
containerfor
the
ready
to
drink
mix was anHDPE blow
moldedbottle
with an
injection
moldedPP
cap.Previous
studieshave
shownthat
injection
molded containerstend to
be
dimensionally
accurate andthere
is
no significant variation.The injection
molding
processis
reliable and maintainsdimensions
as perthe
desired
tolerances.
A
few
caps were measured as perthe
drawing
dimensions
and werefound
to
be
stableand withinthe tolerance
limits.
However,
onthe
otherhand
the
blow molding
processis
challengedby
several
factors
that
greatly
affectthe
quality in bottle blow molding
process;
important among
them
being
the
presence of condensationduring
molding.The
condensationis
causedby
high
humidity
andis
thenumber one concernamong bottle blow
molders.Lewis Ferguson
(Chairman,
Blow
Molding
Division,
SPE)
in his book 'Blow
Molding
Design
Guide'has laid down
several rulesfor
extrusionblow
molding
ofHDPE
and one rule statesthat
abrupt changesin
the cross-section and profile shouldbe
avoided.Also,
it is
mentionedthat
HDPE
containersshrink
slowly
and changesizefor many hours
aftermolding.In
designs
wheredimensional stability is
ofimportance
the
moldhas
to
be
rotated and volumecontrol
inserts have
to
be
employedto
displace
the
difference
in
size.HDPE
is
moreprone
to
heat
warping.Testing
ofthe
first Hypothesis
Dimensions
of a sample size of32 bottles
showed seriousdimensional
instability,
especially in
the
areas supposedto
impart
the
requiredhermetic
seal and moisture resistance.
The
table
no.1
showsthe
observeddimensions.
Factors
responsiblefor
the
inaccuracy
weredue
to
:1)
An improper
mouth oropening
of the container -the
opening
wasunsupported and prone
to
warping
aftermolding resulting in
anoblong
opening.
On capping
there
was roomfor
moistureingress
andthis
contributed
the
mostto
the
problem.2)
Abrupt
changesin
the
cross-section-technically
this
was undesirable.TABLE 1
:Critical Dimensions
oftheContainers
(Shaded
portionsindicate
that
dimensions
are outoftolerance
limits)
T Dimension E Dimension Mouth O.D. Mouth I.D. Wall Thickness
Com. No.
3.5O8,,(+/-0.01")
3.368"(+/-0.01")
2.76"(+/-0.01") 2.67"(+/-001") 0.045"+/-0.01" 0.791" 11
3.51?
3.507 3.48 3,339 3.315 3.328 2.795 2.72 2.762 2.69 2.7 2.65 0.044 0,8> 2 3.484 3.499 3.47 3.319 3.348 3.338 2.752 2.752 2.774 2.73i
2.67 2.642 0.034 0.79 3 3.482 3.465 3.478 3.364 3.337 3.3 2.755 2.772 2,74 2.738 2.658 2.69 0.038 0.79<4 3.466 3.484 3.476 3.332 3.345 3.328 2.76 2.772 2.74 2.73 2.668 2.66 0.038 0.79i
5 3.468 3.47 3.48 3.33 3.36 3.3 2.77 2.79 2.762 2.658 2.672 269 0.038 0.80.'
6 3-52 3.5 3.5 3.37 3.326 3.343 2.752 2.79 2.745 2.7 2.69 2.668 0.036 0.81::
7 3.522 3.478 3.477 3.395 3.38 3.346 2.8 2.712 2.71 2.65 2.7 2.67 0.039 0.79<
8 3.48 3.462 3.48 3.372 3.368 3,32 2.79 2.72 2.77 2.72 2.65 2.66 0.042 0.791
9 3.48 3.45 3.476 3.354 3.338 3.328 2=79 2.724 2.74 2.7 2.668 2.69 0.038 0.79'
10 345 3.42 3.478 3.335 3.36 3.338 2.754 2.77 2.765 2.671 2.669 2.66 0.039 0.79]
11 3.484 3.516 3.478 3.371 3.342 3.345 2.7 2.76 2.742 2.672 2.65 2.6 0.038 0.80J
12 3.484 3.46 3.47 3.364 3.348 3.328 2.79 2.772 2.762 2.66 2.67 2^4 0.036 0.81
13 3.492 3.499 3.476 3.36 3.395 3.336 2.79 2,78 .776 269 2,71 2.66 0.038 0.794
14 3.498 3.486 3.48 3.35 3.3J 3.343 2.758 2.76 2.76 2.677 2.68 2.6? 0.045 0.J
15 3.508 3.5 3.458 3.352 3.36 3.343 2.74 2.77 2.762 2.69 2.677 2.66 0.036 0.83
16 3.53 3.512 3.448 3.377 3.368 3.328 2.8 2.795 2.715 2.7 2.73 2.69 0.038 0.81J
17 3.49 3.5 3.476 3.36 3.37 3.328 2.74 2.76 2.77 2.7 2.66 2.68 0.036 0.81
18 3.472 3.499 3.47 3.342 3.31 3328 2.775 2.76 2.765 2.69 2.7 2.67 0.034 o.8o;
19 3.498 3.478 3.48 3.37 3.348 3343 2,8 2.742 2.68 2,7 2-69 0.038 0.79"
20 3.46 3.47 3.422 3.36 3.38 3.32 .775 2.77 2.8 2.67 2.68 2.6-9 0.038
0.79<
21 3.48 3.498 3.5 3.354 3.37 3.336 2.77 2.78 2.742 Z69 2.68 2.69 0.039 0.J
22 3.47 3.49 3.462 3.35 3.37 3.348 2.77 2.77 2.76 2.66 2.27 2.666 0.038 0.8Q2
23 3.48 3.5 3.478 3.35 3.342 3.343 2.76 2.762 2.745 2.69 2.7 2.65 0.038 0,812
24 3.492 3.46 3.47 3.336 3.368 3.328 2.75 2.76 2.71 2.69 2.7 Z652 0.038 0.792
25 3.52 3.5 348 3.33 3.36 3.338 2.75 2.77 2,745 2.68 2.69 2.68 0.038 0.791
26 3.5 3.48 3.448 3.37 3.35 3.338 2.72 2.74 2.71 2.668 2.69 2.67 0.036 0.796
27 3.501 ; 3,52 3.558 3.38 .3.393.343 2.78 2.762 2.778 2.66 2.67 2.68 0.037 0.796 28 3.48 3.485 3.476 3.39 3.37 3.343 2.754 2.76 2.742 2.69 273 2.652 0.04 0.796
29 3.48 3.476 3.47 3.364 3.366 3.346 2.79 ?.8 2.77 2-S9 2.63 2.642 0.042 0.805
30 3.468 3.478 3.48 3.348 3.36 3345 2.77 2.76 2.765 2.678 2.66 2.668 0.038 0.8!
31 3.48 3,47 3.438 3.36 3.37 3.338 2.78 2.77 2.762 2.67 2.68 2.66 0.036 0,81
32 3.475 3.48 3.476 3.385 3.39 3343 ...2.78 2.775 2.756 2.69 2.67 2.685 0.038 0.796
?
I
Under Dimension
0
I
Over
Dimension
Note:
1)
The Measurements
weretaken
withthe
help
ofCallipers
calibratedin Inches
2)
All
containers are notperfectly
round.They
areoblong in
shape.Hence diameter
obtained at onepointmay
notbe the
same whendimensions
aretaken
again3)
Wall
thicknessesaredifferent
4)
Most
ofthe dimensions don't
matchthespecifications5)
The
weightsweretaken ona normal mechanicalweighing
scale and allcontainersweigh0.15lbs
6)
The
top
surfaceis
quiteroughonmostofthe
containersThe opening
ofthe
mouthis
shownbelow
:Please
referto the
Appendix for
actualdrawing.
This
observation provedthat the
first
sub problemwas valid.This
negatedthe
first hypothesis. As
perthe
Analytic induction
technique two
pointsevolved :1)
Change
the
design
ofthe
opening
ofthe
containerandtest
for Hypothesis
1
again2)
Test
the
existing
containerfor
secondhypothesis along
withthe
new oneto
get a comparisonofdata
Based
onthis
limitation
corrective changes were madein
the
design
ofthe
container and a new moldwas
developed considering
the
important
technical
factors
andlimitations
ofthe
blow molding
process.The
new containerhad
almostthe
samedesign
with provisionfor
the
samecaps
to
be fit
onit.
But
the
opening
ofthe
mouth was alteredto
suitthe
processand
to
maintainthe
tolerancesasdesired.
The opening
ofthe
mouth ofthe
new containeris
shownbelow
Please
referto the
Appendix for
actualdrawing
A
sample size of50
newbottles,
allfrom different molding
lots,
was studiedfor
dimensional accuracy
andthe
results wereextremely
good withonly
onebottle
notconforming
to
the
desired
specifications.Hypothesis 1
in
this
case [image:24.533.160.381.94.188.2]was satisfied.
The
nexthypothesis had
to
be
tested to
strengthenthe
argument.Table No. 2
lists
the
important dimensions
ofthe
newcontainers.Solving
the
first
sub-problemwas not sufficientto
confirmthat the
problem ofmoisture
ingress
was solved andproduction runs couldbegin. The
containerswere not studied
for
moistureingress
and thepackaging line
was also notobserved.
It
wasnecessary
to evaluate the sameto
preventany
problemsin
future
whichcouldbe
attributedto those
factors
and notthe
containers.The discussions
that
follow lead
to
atesting
ofthe secondhypothesis
onboth
the
containerdesigns.
Table
NO. 2
E Dimension T Dimension Container 2.693+/-0.015 3.368+/-0.015 3.508+/-0.015
1 2.708 3.362 3.5
2 2.694 3.362 3.502
3 2.704 3.37 3.5
4 2.708 3.368 3.494
5 2.708 3.352 3.5
6 2.694 3.37 3.5
7 2.696 3.356 3.502
8 2.708 3.372 3.499
9 2.706 3.371 3.496
10 2.708 3.362 3.494
11 2.703 3.356 3.496
12 2.707 3.368 3.497
13 2.706 3.371 3.5
14 2.705 3.371 3.494
15 2.708 3.357 3.51
16 2.707 3.353 3.5
17 2.7 3.362 3.5
18 2.708 3.362 3.5
19 2.706 3.363 3.5
20 2.7 3.362 3.498
21 2.708 3.37 3.498
22 2.698 3.353 3.5
23 2.698 3.358 3.5
24 2.698 3.37 3.499
25 2.708 3.358 3.493
26 2.71 3.364 3.492
27 2.708 3.371 3.493
28 2.702 3.37 3.492
29 2.703 3.371 3.498
30 2.706 3.352 3.496
31 2.708 3.353 3.498
32 2.708 3.362 3.5
33 2.702 3.364 3.5
34 2.703 3.353 3.51
35 2.702 3.358 3.494
36 2.698 3.378 3.497
37 2.701 3.362 3.494
38 2.707 3.37 3.497
39 2.708 3.362 3.494
40 2.708 3.355 3.497
41 2.706 3.371 3.498
42 2.707 3.372 3.5
43 2.703 3.353 3.494
44 2.703 3.364 3.5
45 2.708 3.353 3.499
46 2.708 3.355 3.5
47 2.693 3.355 3.493
48 2.706 3.38 2.493
49 2.708 3.371 3.5
50 2.708 3.372 3.498
Note:
1)
Wall Thicknesson eachsideobservedto be0.5"2)
The'H'Dimensionswere not possibleto
takeaccurately.However
they
arebetween 1.76 to 1.78 inchesand arewithinthe tolerances [image:25.533.53.480.40.673.2]Accelerated
Aging
The
nextstep
involved
the tests
for
moistureingress using desiccant
andwithout
the
actual product.The
test
was an acceleratedaging
test
wherethe
containers were subjected
to
atemperature
of90F
and90%
Relative
Humidity. The
tests
were carriedoutin
ahumidity
chamber.Samples
ofboth
the
old as well asthe
new reviseddesigns
were subjectedto these tests to
determine
amount of moistureingress
for
a specific period of time whichwould
be
usedto
predictthe
shelflife
ofthe
product.The
food
industry
and medicaldevice
industry
has
been
involved
in
techniques to
predict shelflife
of polymerbased devices. Developers
ofpolymer
based food
package and medical products need waysto
ensure aproduct
life up
tofive
or six years.Real
time
testing
is
impractical,
thus
indicating
the
needfor
acceleratedaging
techniques.
The
best
known
technique
for predicting
the
propertiesusing
accelerated storagedata is
the
Arrhenius
equation.Accelerated aging
canbe defined
as aprocedurethat
seeksto
determine
the
response of a
device
or material under normal usage conditions over arelatively
long
time,
by
subjecting
the
productfor
a much shortertime to
stresses
that
are more severe or morefrequently
appliedthan
normalenvironmental oroperational stresses
(Karl J. Hemmerich).
The
Arrhenius
equationdescribes
that
therates ofchemicalreactions,
withinthe
limits
ofcertainrestrictions,
increase
withtemperature.This
equation saysthat
log
rate(InK)
is
proportionalto the
inverse
absolutetemperature
(1/T)
multiplied
by
the
reaction'senergy
of activation(Ea)
divided
by
R,
the
universalgas constant :
In
KT
=A
x
Ea/RT
orKT
=A exp
(EJRT)
The
ratios ofthe
rates attwo
different
temperatures
yieldsthe
Arrhenius
shiftfactor
A(T)
=Km/KTL
=exp
(Ea /R(1/TL
-1/TH)
where
Km
andKn
arethe
rates atthe
higher
andlower
temperatures andTH
and
TL
arethe
higher
andlower
temperatures
in Kelvin.
Accelerated
aging
is based
on athermodynamic
temperature
coefficientformulated
by
Von't Hof
that
states"for every 10 degree C rise in
temperaturethe rate of chemical reaction will double."
For
polymers whichhave
been
previously
characterized,
a simplifiedapproachfor
acceleratedaging is based
on
conducting
testing
at a single acceleratedtemperature
and thenemploying
this
rule.Typically
Qio=2
i.e.
the
reaction ratedoubles
withevery 10C rise in
temperature
abovethe
use orstoragetemperature
(Karl J. Hemmerich).
However,
this
formula
wasbased
on ratekinetics
of a single chemicalreaction;
not to packages with variouskinds
of materials.So,
the
direct
extrapolation of
this
theory
to
theaging
ofpackaging
materialsis
to
be
usedwith caution.
But
the
industry
andthe
FDA
believe
the
theory
is
usefulin
defining
andjustifying
acceleratedaging
test
programs.General
Test
Protocol
Guidelines
A
number of miscellaneousfactors
mustbe
consideredin conducting
anaccelerated-aging study,
regardlessofthe
accelerated-aging
protocolemployed
(General
Aging Theory
andSimplified Protocol
for Accelerated
Aging
ofMedical Devices
-Karl J. Hemmerich
www.
devicelink.
com/mpb/archive/98/07/002
.html)When
establishing
the
accelerated-aging
protocol,
the
environmentalconditions selected should not represent unrealistic
failure
conditionsthat
would never occur under
real-time,
ambient-agedconditions.For
example,
where
there
is
evidencethat
anaging
effect occursonly in
the
presence ofheat,
one should performaging
underconditions of storage oruse only.Proof
testing
can serve as a substitutefor destructive
testing.Proof
testing
requires all samples
to
be
tested
atthe
end of eachtest
interval
to
aspecified
failure
point,
then
returnedto
the
aging
environmentfor
continued exposure.
This
method,
however,
is only
applicable whenthe
selection of proof-testvalues
does
not weaken orcompromisethe
productproperties
being
examined.When
use ofany accelerated-testing
model produces anonlinearplot, this
may be
anindication
that
multiple chemicalreactions,
complex reactionsofa second or
third order,
orautocatalyticreactions areoccurring
atsome,
but
notall, test temperatures.
In
these cases,
elevatedtemperatures
may
negatively distort
the
performance ofthe
material atoperating
or storageconditions.
Under
suchcircumstances,
one should considerperforming
aging
under conditions ofstorageoruse(ambient).
When
possible,
acceleratedtesting
shouldbe
employedtesting
ofthe
device
or material athigh
stressfor
a short period oftime
in
orderto
deduce
the
dominant failure
mode.Based
onknowledge
ofthe
principaldegradation
mechanisms and stresses on or withinthe part,
a significantenhancement
in
test-plan
efficiency
canbe
achievedthrough the
use ofexcessive environmental stresses such as
heat,
oxygen,
chemicals,
orradiation.
Often,
radiationis
the
best
stressorto use,
sincethe
degradation
pathways areoften similar
to those
induced
by
heat
oroxygen.Irradiating
a product at100
kGy
(10
Mrd)
or morebefore
initiating
aformal
test
program can often root out
the
product's "Achilles' heel" and allowfor
improved
targeted test
design.
All
test
units should consist of products constructed ofthe
samecomponents and subassemblies andmanufactured
by
the
sameprocesses,
methods,
and procedures asthose
usedfor
routine production.Test
Setup
The
old and new containers weretaken to the
packagefilling
facility.
A
measured amount of
desiccant
wasfilled
in
the
bottles
priorto
capping.24
bottles
ofthe
newdesign
were capped onthe
packaging line
with acapping
torque
of25-30 lbs. 21 bottles
ofthe
olddesign
were also capped onthe
packaging
line.
Another 24
containers ofthe
newdesign
werehand
capped.The
desiccant
wasblue
in
color andhad
aproperty
ofturning
pink onmoisture absorption.
This desiccant
was selected sothat
it
couldgive avisualindication initially.
Several limitations
were observed atthe
packaging line
which wouldbe
discussed
later
whilediscussing
thethird
hypothesis.
After
completion ofthis,
the
containers were weighedindividually
on anelectronic
weighing
scale,
which gave anaccuracy
ofup
to
2 decimal
places.The
containers were marked withthe
weightbefore
the
acceleratedaging
test
and numbered
for identification.
The
containers were placedin
threedifferent
corrugatedcartons,
a) The first
one with
the
new containers which were machinetorqued
b)
The
second onewith
the
new containershand
torqued
andc) The
third
one withthe
oldcontainers machine
torqued.
The
three
cartons werethen
placedin
ahumidity
chamber at90F
and90%
relative
humidity
for 7 days. The
containers weretested
onceonthe
third
day
to
observeany
increase in
weight andto
notethe
readingsto
enableto
determine
rate ofincrease
perday
for any future study
relatedto this
product.Humidity
chambers are usedto
simulate a wide range of environmentalconditions or
to
maintain a consistent environmental condition.Desiccant
dehumidifiers
are usedfor
controlled pull-down ofhumidity
orfor
maintaining
a constanthumidity
for
long
periods of producttesting
andresearch or storage.
Results
Table No. 3
shows adetailed
observation ofincrease
in
weights andtime
oftests
etc.The
following
points were observed :Just 5
containersfrom
the
oldlot
maintainedthe
weightthey
had
initially
i.e.
did
not absorbany
moisture,
whilethe
remaining
16
containersshowed a considerable
increase in
weightas canbe
seenfrom
the
table.A
careful observation of the
increase in
weights showsthat
the
rate ofincrease
wasbetween 0.02%
to0.08% in
one week which wasvery high.
The
new containers which were machinetorqued
werehighly
consistentwith
their
weights andthere
was noincrease in
the
weight exceptfor
onewhich
had
anincrease
by
0.015%
whichwasnegligible.The
new containers which werehand
torqueddid
not show a consistentresult with about
25%
showing
anincrease
in
weightfrom 0.023%
to
0.055%
which washigh.
The
graphsthat
follow
show a visual adaptation ofthe
moisture gain.Moisture
gainfollows
alinear relationship
andin
most casesthe
slopeis
the
same.An
estimate of moisture gain after a period of2
months canbe
made
by following
the
line
graphasthe
increase
in
moistureis going
to
be
linear. Most
chartsfor
the
old container show aninitial
constant weightand a sudden slope
toward
anincrease
of weight.Graphs
for
oldcontainers
11
to
14
show a constantincrease
in
weight and areterribly
outof
dimensional
tolerances
also.There
are chartsshowing
some variation observed onthe
new containersalso.
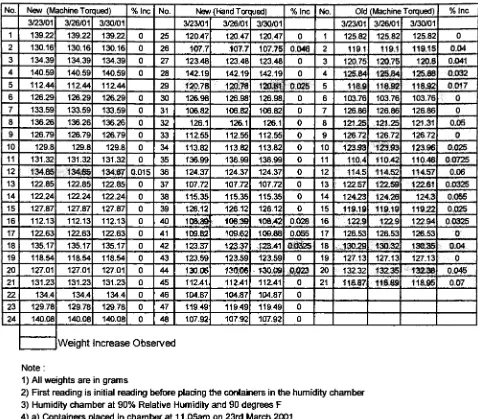
Table No. 3
No. New (Machine
Torqued)
% Inc No. New (HandTorqued)
% Inc No. Old(MachineTorqued)
%Inc 3/23/01 3/26/01 3/30/01 3/23/01 3/26/01 3/30/01 3/23/01 3/26/01 3/30/011 139.22 139.22 139.22 0 25 120.47 120.47 120.47 0 1 125.82 125.82 125.82 0 2 130.16 130.16 130.16 0 26 107.7 107.7 107.75 0.046 2 119.1 119.1 119.15 0.04 3 134.39 134.39 134.39 0 27 123.48 123.48 123.48 0 3 120.75 120.75 120.8 0.041
4 140.59 140.59 140.59 0 28 142.19 142.19 142.19 0 4 125.84 125.84 125.88 0.032 5 112.44 112.44 112.44 29 120.78 120.78 120,81 0.025 5 118.9 118.92 118.92 0,017 6 126.29 126.29 126.29 0 30 126.98 126.98 126.98 0 6 103.76 103.76 103.76 0
7 133.59 133.59 133.59 0 31 106.82 106.82 106.82 0 7 126.86 126.86 126.86 0 8 136.26 136.26 136.26 0 32 126.1 126.1 126.1 0 8 121.25 121.25 121,31 QJ0S 9 126.79 126.79 126.79 0 33 112.55 112.55 112.55 0 9 126.72 126.72 126.72 0
10 129.8 129.8 129.8 0 34 113.82 113.82 113.82 0 10 123.93 123.93 123.96 0.025 11 131.32 131.32 131.32 0 35 136.99 136.99 136.99 0 11 110.4 110.42 110.48 0.0725 12 134.85 134.85 134.87 0.015 36 124.37 124.37 124.37 0 12 114.5 114.52 114.57 0.06 13 122.85 122.85 122.85 0 37 107.72 107.72 107.72 0 13 122.57 122.59 122.61 0.0325 14 122.24 122.24 122.24 0 38 115.35 115.35 115.35 0 14 124.23 124.26 124.3 0,055 15 127.87 127.87 127.87 0 39 126.12 126.12 126.12 0 15 119.19 119.19 119.22 0,025 16 112.13 112.13 112.13 0 40 1 08.38 108.39 108.42 0.028 16 122.9 122.9 12254 0.0325 17 122.63 122.63 122.63 0 41 109.82 109.82 109.88 0.055 17 126.53 126.53 126.53 0
18 135.17 135.17 135.17 0 42 123.37 123J37 123.41 0.0325 18 130.29 13032 130.35 0.04
19 118.54 118.54 118.54 0 43 123.59 123.59 123.59 0 19 127.13 127.13 127.13 0
20 127.01 127.01 127.01 0 44 130.06 130.06 130.09 0.023 20 132.32 132.35 132.38 0.045 21 131.23 131.23 131.23 0 45 112.41 112.41 112.41 0 21 118.87 118.89 118.95 O.07 22 134.4 134.4 134.4 0 46 104.87 104.87 104.87 0
23 129.78 129.78 129.78 0 47 119.49 119.49 119.49 0 24 140.08 140.08 140.08 0 48 107.92 107.92 107.92 0
Weight Increase
sObsejrvecNote:
1)
Allweightsareingrams2)
First reading is initial reading before placingthecontainersin thehumidity
chamber3) Humidity
chamberat90% RelativeHumidity
and90 degrees F4)
a)Containers
placedinchamber at11.05amon23rd March 2001b)
Containers
removedat1 1,05amon26th March2001 for firstweightreading,inat1 1.40c)
Containersremovedat1 1.10amon30thMarch 2001 forfinal
weightreading
5)
Capsmachinetorquedat25-30lbs
(Observed to bea sufficienttorque)
6)
HandTorqued
containershadatorquerange of13lbs to 28lbsWeight
Increase for
Old Containers
which wereMachine Torqued
Weight Increase for Old Container No. 2
Readings
E
3
sz g>
"3
Weight Increase for Old Container No. 3
-Seriesl
Readings
Weight
Increase for Old Container No. 4
125.89
125.88
g-125.87
2
125.86to 125.85
g
125.84125.83
125.82
Seriesl
Readings
Weight
Increase for Old Container No. 5
118.925
118.92
F
118.915
3
+*118.91
O)118.905
118.9
118.895118.89
-SerieslReadings
Weight Increase for Old Container No. 8
121.32 121.3
?
121.28
O)121.26
s
121.24 121.22 -SerieslReadings
Weight Increase for
Old Container No. 1 0
110.5
110.48
?
110.46
3
110.44
CD110.42
CD110.4
110.38
110.36
Weight Increase for
Old Container No. 1 1
-Seriesl
Readings
Weight Increase for Old Container No. 12
1 14 *iR
114 ^R
/
"E
114.54-3
S
114.52
-.5?
'3> 1 1 4 *^
y^
|
?
Seriesl
114 4R
-?"^
i
1144fi
r
j
1 2
3
Readings
199fi9
-Weight Increase for Old Container No. 13
122.61
-
g-122.6
-122.59
-o>
122.58
-|
122.57
-122.56
-100 <^ #>^ ?Seriesl ^^ IZZ.uD i1
2
3
Readings
Weight Increase for Old Container No. 14
124.32
124.3
?
124.28
3
124.26
Ol124.24
5
124.22
124.2
124.18
-SerieslReadings
Weight Increase for Old Container No. 15
119.23 -i 119.22
E
119.213
119.2 O)|
119.19
119.18
119.17 -Seriesl ReadingsWeight Increase for Old Container No. 1 6
Weight Increase for New
Containers
which wereHand Torqued
Weight Increase for
New
Container
No. 26
-Seriesl
Readings
Weight Increase for New Container No. 29
120.82
-i
120.81
-"E
120.8
-3
120.79
-'3
ion7R .
-s
\
s
''
Seriesl
f
*1 on 77 -
j
ion 7R
..1
1
1
2
3Readings
Weight
Increase for New Container No. 40
108.43
-1flR AO
^_______^ .
____.,
IUO.4^
"E
108.41-3
108.4
-D)|
108.39
-_^ ?
Seriesl
? * TUo.oo-108.37
-, , ,1 2 3
Weight
Increase
for New
Container
No. 41
109.9
109.88
E
109.86
3
109.84 O)|
109.82
109.8
109.78
Readings SerieslWeight Increase for New Container No. 42
123.42 -i 123.41 -123.4 2 123.39 ra 123.38
I
123.37 123.36123.35
SerieslReadings
130.1-130.09
-Weight Increase for New Container No.
<''.. ;
'
'''- -'C:.-'--""-;'
14
E
130.08
-3
y^
130.07
-D)
|
130.06-? ; _*____- ,
? aenesi
130.05
-130.04
-, ,
1
1 2
3
Readings
Weight Increase for New
Container
which wasMachine Torqued
Weight
Increase
for New Container No. 12
1 ^4 87^
134.87
-"= 1T4 Rfi^ -
f
2
134.86
-"Si I'M. RW
-/
. :? Seriesl
"5
> I^J. R^
-1^ R4^
-1^J. RA
-1 2 3
Readings
Moisture
absorptionin
some cases starts rightin
the
beginning
andthen
stops whilein
some casesit doesn't
startinitially
but
startslater.
There
is
nouniformity
observedin
this
phenomenon.This
canbe
attributed
to the
following
:a)
Initial
absorption mightbe due
to
presence of moisturein
the
inner
environmentandafter a certain pointof
time
it
mightbe reaching
asaturationpoint
to
stop further
absorptionb)
Late
start of absorption mightbe due
to
steady ingress
after apointof
time
andfurther ingress
and absorption.c)
Self
release of capsover a certain period couldalsobe
areasonfor
late
start of moistureingress.
Test
ofhypothesis
2
for
the
new containers was a success.However,
the test
was negativefor
the
old containers.Another
variableintroduced
during
the
tests,
whichhadn't been
consideredin
the
sub problems as well asthe
definition
ofhypotheses
wasthe
importance
ofthe
capping
torque.
The
tabulated
readings provedthat
a uniform machinetorque
onthe
new containers was more efficientthan the
hand
torque
onthe
new containers.
This
provedthe
importance
of a specificcapping
torque
necessary
to
prevent moistureingress.
Conclusion
The
failure
ofthe
first
two
hypotheses
onthe
old containers provedthat
the
approach
taken
during
this
researchwas correct and recommendationfor
the
new
design
was appropriatein
solving
the
problem of moistureingress.
The
success ofthe
first
two
hypotheses
onthe
new containers solvedthe
first
two
sub problems asfar
asthe
containerlimitations
were concerned.This
alsosolved
the
problem of moistureingress
and preventedany caking
ofthe
mixesattheretailshelf.
It
is
also safeto
concludethat
onthe
basis
ofvisualdata
asdepicted from
the
graphs, the
moistureingress
over a certainperiod oftime
canbe
estimatedto
determine
the
shelflife
ofthe
product.This
is
because
there
is
alinear
relationship followed. Literature has lot
ofinformation pertaining
to the
linear
increase
ofmoistureingress,
however
it has been
provedby
the tests
on apractical platform.
Some important
observations atthe
packaging
line
necessitatedthe
needto
test the third
hypothesis
also.This
would resultin
along
term
solutionfor
the
problemofmoisture
ingress.
The
Packaging
Line Environment
In
the
Analytic Induction
process ofstatistical analysisin
this
researchthe
third
hypothesis pertaining
to the
packaging line
environmenthad
to
be
tested.However,
adetailed
study
onthis
wasbeyond
the
scopeofthis
projectObservations
atthe
Packaging
Line
It
took
typically
75
secondsfor
abottle
to
travel on a conveyorfrom
the
filling
line
to the
capping line.
However,
adelay
or stoppage ofconveyorincreased
this
time to
120
secondsalso.Desiccant left
open atthe
packaging line
turned
pinkin
colorin
aduration
of
120
secondsindicating
presence of moisturein
the
environment.A
changein
color after120
secondsimplied
that
absorption of moisturestarted earlier.
There
musthave been
a certain percentage of moistureabsorption
in
the
drink
mixesbetween
the
filling
andcapping lines.
There
was notest
carried out atthe
packaging line
to
estimatethe
percentageof absorption of moisture and
time
required.Also,
it
wasvery difficult
to
determine
whetherthe
moistureabsorbedby
the
productin
the
packaging line
contributed
to
caking
ofthe
productin due
course.Considering
that the
productis
a class ofdry
products andtends to
absorbmoisture
readily
severalprecautionshave
to
be
taken
atthe
packaging line.
To
preventany
moisture absorption atthe
packaging
line,
hygroscopic
products such as powders
have
to
be
processedin
humidity
controlledenvironments.
The
pharmaceuticalindustry
produces millions and millions ofpills,
tablets,
capsules each year.
This involves
the
processing
ofhygroscopic
powders also.Dehumidification
is
usedto
prevent moisture regainfor
powder processing,pneumatic
conveying
ofbulk
materials etc.FDA
guidelines and regulationshave
the
impact
oflaw
concerning the
manufacturing,
package and storage conditionsfor
pharmaceutical products.This
data
canbe
usedto
improve
theefficiency
ofthe packaging
line for
this
product.
Part 212
ofthe
CFR
cites a temperature of72F
(+/-3F)
and arelative
humidity
of30-50%
for manufacturing
areas.Since
personnel aregowned, the
roomtemperature
is
often specified as68F.
Make-up
airis
required to replace exhausted air andis
usually
the
largest load factor. It is
recommendedthat
makeup
airbe dehumidified before mixing
with returnair.Recommendations
for further study
Test
the
packaging
line
environmentto
acquiredata
to
carry
out ananalysis and
to test
for
otherinefficiencies
Study
the
new containersfor
alonger
shelflife
simulationto
generatedata
for
a quantitative statistical analysisStudy
the
importance
ofcapping
torque
on containers meantto
preventmoisture
ingress
or provide a moisturebarrier.
Study
the
rate of selfrelease of caps
from
the
container andits
contributionto
moistureingress
afteracertainperiod.
Bibliography
1.
Understanding
Blow
Molding
:Lee,
Norman
C,
1934
-Hanser
Gardner Publications
2.
Blow
Molding
Design Guide
:Lee,
Norman
C,
1934
-Hanser Gardner Publications
3. Active
Food
Packaging
:London
:Blackie Academic &
Professional,
1995
4.
Packaging
Materials
andContainers
:Paine,
Frank
Albert
-Glasgow Leonard hill
5.
Food
Plas
:Plastics
in
Food
Packaging
-Foodplas Conference
-Technomic
Pub,
Pa
6. A
Handbook
ofFood
Packaging
:Paine,
Frank Albert
-Glasgow Leonard hill
7.
Food
andDrug Packaging
Journal
:1993
8.
A
Review
ofEquipment
Aging Theory
andTechnology,
EPRI
Report
NP-1558,
Franklin Research
Center,
September 1980
9.
Shelf
Life
ofMedical Device
:Clark
GS,
FDA
(DSMA)
report,
April 1991
Website
url's :1
. www.devicelink.com/mpb/archive/98/07/002.html2.
www.pira-partners.com3.
www.foamglas.com