R E S E A R C H A R T I C L E
Open Access
The effects of patient education programs
on medication use among asthma and
COPD patients: a propensity score
matching with a difference-in-difference
regression approach
Nazmi Sari
1*and Meric Osman
2Abstract
Background:Adherence to medication is one of the critical determinants of successful management of chronic diseases including asthma and chronic obstructive pulmonary disease (COPD). Given that poor adherence with self-management medication is very common among asthma and COPD patients, interventions that improve the use of chronic disease management medications for this patient group have potential to generate positive health outcomes. In an effort to improve asthma and COPD care, the Lung Association of Saskatchewan has implemented an intervention by providing access to effective and high quality asthma and COPD education for both patients and health care professionals along with increasing access to spirometry.
By evaluating the impacts of this intervention, our purpose in this paper is to examine the effectiveness of spirometry use, and asthma and COPD education in primary care setting on medication use among asthma and COPD patients.
Methods:At the time of the intervention, the Lung Association of Saskatchewan has not assigned a control group. Therefore we used a propensity score matching to create a control group using administrative health databases spanning 6 years prior to the intervention. Using Saskatchewan administrative health databases, the impacts of the intervention on use of asthma and COPD medications were estimated for one to four years after the intervention using a difference in difference regression approach.
Results:The paper shows that overall medication use for the intervention group is higher than that of the control group. On average, intervention group uses more asthma and COPD drugs. Within the asthma and COPD drugs, this intervention creates a persistent effect over time in the form of higher utilization of chronic
management drugs equivalent to$157 and$195 in a given year during four years after the intervention. Conclusions:The study suggests that effective patient education and increasing access to spirometry increases the utilization of chronic disease management drugs among asthma and COPD patients. This type of interventions with patient education focus has potential to save healthcare dollars by providing better disease management among this patient group.
* Correspondence:[email protected]
1
Department of Economics, University of Saskatchewan, S7N5A5 Saskatoon, SK, Canada
Full list of author information is available at the end of the article
Background
Adherence to medication is one of the critical determi-nants of successful management of most chronic diseases including asthma and chronic obstructive pulmonary dis-ease (COPD). Studies, however, repeatedly emphasize that non-adherence to medication, especially non-compliance with self-management medication, is very common among asthma and COPD patients [1–3]. As an attempt to im-prove medication adherence, health outcome, and quality of life, various interventions that target asthma and COPD patients have been implemented [4–10]. Main goal of these interventions was to educate patients about all aspects of the disease, teach them coping skills to avoid triggers, and to train the patients in medications with spe-cific emphasis on doses, frequency of administration, and possible side effects.
As shown in some studies recently reviewed in a Cochrane review [11], patient education interventions improve medication adherence, decrease emergency de-partment (ED) visits, and hospital admissions. For in-stance, Bruzzese et al. show that an education based intervention implemented in a New York City school en-vironment substantially reduces healthcare utilization among adolescence [5]. The result of this randomized control trial shows that the intervention participants ex-perience a 28 % reduction in acute medical visits, a 49 % reduction in ED visits, and a 76 % reduction in hospitaliza-tions compared to adolescence receiving usual care. While there are other studies reviewed in this Cochrane review also showing similar results [4, 12], Farber and Oliveria [10], and Bailey et al. [6] show that patient education pro-grams targeting this patient group have no impact on health care utilization measured by ED visits and hospitalization. In addition to ED visits and rate of hospi-talizations, Farber and Oliveria also examine the impact of the intervention on medication [10]. They find that the intervention group uses more (about one dispensation) asthma controller medication compared to the control group. There are also other studies indicating the impact of patient education interventions on medication use for management of asthma and COPD. In a school-based intervention for urban adolescents, Bruzzese et al. [5] re-port that the students in the intervention group relative to the control group reported significantly greater use of con-troller medication, and more confidence to manage their asthma. Subsequent studies also report that patient educa-tion program resulted in significantly better controller ad-herence and long acting beta agonist adad-herence, improved steroid inhaler compliance and higher cumulative control-ler medication dose [4, 7, 9, 10, 13].
As a body of literature indicates, inappropriate or insuffi-cient medications among patients with chronic conditions can result in several negative consequences including treat-ment failure, unnecessary and more intensified therapy,
costly diagnostic procedures and complications and hospitalization. Hence effective asthma and COPD man-agement with consistent use of self-manman-agement medica-tions not only decreases emergency care, and unscheduled doctor visits, but also improves quality of life, and reduces productivity losses and disability leaves (for a review of this literature see Nieuwlaat et al. [11]).
In an effort to improve asthma and COPD care and health outcomes, the Lung Association of Saskatchewan has implemented an intervention by providing access to effective, and high-quality asthma and COPD education for both patients and health care professionals along with increasing access to spirometry to increase early detection of these diseases. For this purpose, the Associ-ation has placed spirometry and the Certified Respiratory Educators (CREs) (certified healthcare professionals with specific focus on asthma and COPD care) in selected family physician offices in 2007. The objective of the intervention was to educate patients in managing their diseases.
By evaluating the impacts of the intervention con-ducted by the Lung Association, our purpose in this paper is to examine the effectiveness of spirometry use, and asthma and COPD education in primary care setting on medication use among asthma and COPD patients. Our results show that overall medication use for the intervention group is higher than that of the control group. On average, the intervention group uses more asthma and COPD drugs. Within the asthma and COPD drugs, the intervention with its patient education focus creates a persistent effect over time in the form of higher utilization of chronic management drugs (i.e. inhaled steroids (also known as inhaled corticosteroids), long acting beta agonists) while it has no effect for the utilization of other drugs.
Methods
Overview of the intervention
Each patient visit started with spirometry administration and continued with one hour patient education conducted by the CREs. Each session included training and informa-tion regarding the pathophysiology of the disease, medica-tions and inhaler techniques, environmental control for asthma, and coping skills. The intervention was patient oriented with a special focus on the needs of the patients. In order to meet the specific needs, it was tailored based on the needs of a corresponding patient. For instance, if the patient was a smoker, more time has been devoted to explain smoking cessation programs.
At the end of each session, patients have consulted with the physician for any change in medications and an action plan afterwards. Office/phone follow-ups within four weeks following the session were also scheduled for all patients. While phone follow-ups were around 15 min, office follow-ups were expected to last for about an hour. However, the duration of office follow-ups varied depending on the needs of the patient. Similarly, patients also had a chance to consult with the physician after the follow-up session. Certified educators were available to meet with the patients depending on the need and request by the patients after the first follow-up.
Data source and intervention sample
Several data sets from the Saskatchewan health adminis-trative databases were used for our analysis. An additional file shows the description of each database in more detail (see Appendix Table A.1. in Additional file 1). The out-come variables (i.e. prescription drug cost and use) were created using the Prescription Drug Plan Historical Claims (PDP) that includes details on prescription drug related in-formation such as quantity of drug dispensed, date of dis-pensing, cost, type and name of the drugs with their drug identification numbers. Additional databases such as the Discharge Abstract Database (DAD) for patients’ hospitali-zations, the Medical Services Billing Claims Data (MSB) for the physician visits, the Personal Health Registration System (PHRS) for patient demographics and location of residence, and Vital Statistics Registry for death informa-tion were utilized in this study.
All of the files can be linked with each other using the encrypted unique identifier (encrypted provincial health number) that are provided in each data set for all resi-dents in the province. The Lung Association recorded the provincial health number for intervention partici-pants and this was converted to the encrypted form using the same algorithm applied for encryption in all other databases. The common identifier was then used to obtain records for the intervention participants from the Saskatchewan administrative health databases.
The ethics approval for this study has been obtained from the University of Saskatchewan Biomedical Research
Ethics Board under Bio # 10–180. The patients gave free and informed consent for linkage of data collected directly from them (i.e., that they were participants in the CRE program) and the administrative health data about their utilization.
There were 271 patients participated to the interven-tion in 2007. We restricted the interveninterven-tion sample to the patients with health care utilization data available through the Saskatchewan administrative health data-bases. Among 271 patients in the initial sample, we dropped 28 patients due to missing de-identified health number, and 13 patients with Registered Indian status since there are no prescription drug data available for them. We also excluded 15 patients as they did not live in this health region during the pre-intervention period. We also excluded 9 patients who died during the study period. In addition, 13 patients who did not use any physician services or were younger than seven in the baseline year were also dropped. Finally, we further excluded 8 patients for which no match were found in our propensity score matching strategy. As a result, the final intervention sample used in our intervention effect estimations consists of 185 individuals1.
Outcome variables
By following Kuwornu et al. [14], and HQC [15], we categorized the drugs under three groups (chronic management, acute, and other unclassified drugs). We grouped the drugs that are only used for chronic man-agement (i.e. to control and improve symptoms) under
chronic management drug group (i.e. inhaled steroids (also known as inhaled corticosteroids), long acting beta agonists (LABA), anticholinergic, and xanthine). The drugs that are only used for acute exacerbations were identified under acute drugs (i.e. short-acting beta-agonists (SABA), antibiotics). Following the study conducted by HQC [15], other asthma drugs that are not classified in chronic management or acute drugs by Kuwornu and his colleagues [14] were grouped under
unclassified asthma drugs.
The cost of drugs is recorded in the databases in nom-inal terms. In order to compute the real prescription drug costs, we used 2002 as the base year, and adjusted the cost using the Saskatchewan Consumer Price Index for health and personal care commodity group.
Other variables
demographic variables along with their descriptions are presented in the additional file (see Appendix Tables C.1-C.4 in Additional file 1).
Statistical analysis Propensity score matching
In order to estimate the effects of the intervention on the use of chronic disease management and acute drugs, one needs to compare the outcomes between intervention par-ticipants and comparable non-parpar-ticipants. Although we have the intervention group exposed to the intervention, no control group was assigned when the intervention was conducted by the Lung Association. To deal with this shortcoming, we constructed a control group using a pro-pensity score (PS) matching strategy [18–20]. The purpose of the matching is to identify individuals that have similar characteristics to the intervention participants except for the intervention status.
Before estimating the propensity scores based on a rich set of covariates in a probit specification, we restricted the potential control group using key characteristics of the intervention group such as age and geographical location and data availability prior to the intervention. For this pur-pose, we restricted the potential control to the sample that includes only individuals who used any physician services during 2006, and who lived in the same health region with the intervention participants prior to the implementation of the intervention. We defined the period before the intervention from April 2001 to December 2006. The time period was chosen based on the availability of the data. We dropped individuals who died at any time since April 2001. We also constrained the sample to the indi-viduals aged seven to ninety-six in 2006. Given that we have no prescription drug information available for people with Registered Indian status, we also dropped them from the analysis.
Following this stratification, we estimated a probit model to compute propensity scores. These scores were estimated for each remaining individual in the risk set using a probit model with a long list of baseline character-istics including the baseline outcome variables as well as health status measures such as comorbidity indicators for 19 conditions. These details are presented in the online appendix to this paper (see Appendix Table B.1. in Additional file 1). All statistical analysis outlined in this and next sub-sections were employed using Stata (ver-sion 12), and SAS (ver(ver-sion 12) software programs.
There are various propensity score matching tech-niques used in the literature (for a review see Austin [21], Dehejia and Wahba [22]. The simplest one is the nearest neighbor matching in which an intervention unit is matched with a unit from the potential control that has the closest propensity score to the corresponding intervention unit. In the case of multiple matches, the
tie is broken by a random draw. Even though this approach requires the propensity scores to be the closest between the intervention and matched control units, it has potential to create considerable bias. When we use it with replacement, the nearest neighbor matching can limit the number of matched controls which in turn may result in small sample bias. If it is used without replace-ment, then the quality of matched controls could be poor due to possible large differences in the propensity scores between the intervention unit, and the corre-sponding matched control [22].
In an effort to deal with these shortcomings, caliper (ra-dius) matching is used as an alternative in the literature. This technique is simply an extension of the nearest neighbor matching that is developed to avoid the small sample bias, and the potential bias due to possible large differences in the propensity scores. This approach con-structs the matched control units whose propensity scores are within a tolerated distance from the propensity score of the respective intervention unit. Formally the matched setM(i) for intervention unitiis defined as;
M ið Þ ¼ pjj jjpi−pjjj<r
n o
ð1Þ
where subscriptsi andjstand for the intervention and control units, respectively. The equation above denotes that all control units with estimated propensity scores,
pj, fall within a radius r from the intervention unit i’s
propensity score, pi, are matched to the intervention
uniti.
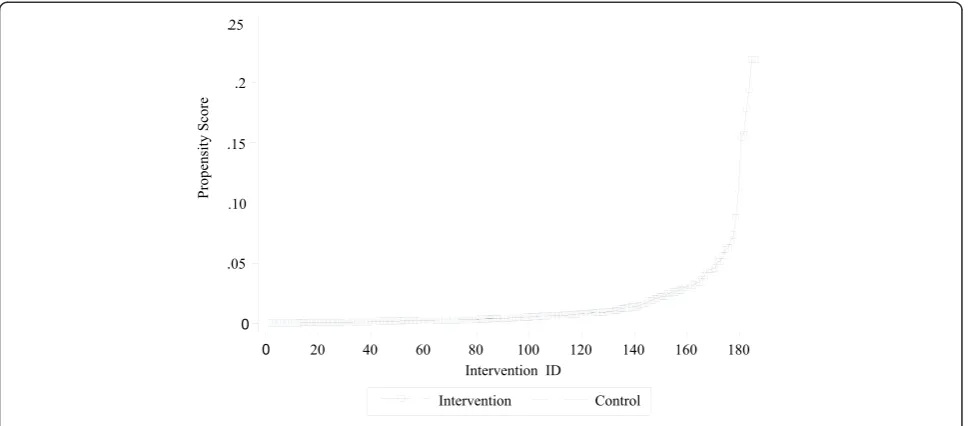
In our study, we used a with replacement radius matching using a radius of 0.005. This is the smallest radius frequently used in the literature [23]. Given that there can be multiple control units within the specified radius, there are more than one match for each inter-vention unit. In order to deal with unlimited number of matches, we restricted the maximum number of matched controls for each intervention unit at 10. All potential controls with an estimated propensity score falling within a specified radius defined above were matched with the respective intervention unit. In the case of multiple matches due to identical propensity scores after nine successful matches, the tie was broken by a random draw among the last group of matched control units with identical propensity scores. We removed the rest of potential control units if their pro-pensity scores were away from the tolerated distance from the propensity scores of any intervention units.
number for the intervention units. As there are multiple matches for individuals in the intervention group, the mean propensity scores of matched controls for the cor-responding intervention unit, and the propensity score of each intervention unit are illustrated in the figure. The figure shows that the propensity scores for both groups are almost identical implying that both groups have the same propensity score distribution.
In order to assess the quality of matching based on observed characteristics as well as to understand the baseline values for outcome variables, we presented the baseline characteristics between the control and inter-vention groups. Table 1 shows the summary statistics for main variables with a mean difference test between the groups. As indicated in the table, the two groups have similar characteristics at baseline; the mean differences for each covariate between two groups are not statisti-cally significant at 5 % significance level.
Regression framework to estimate the intervention effect In order to estimate the effect of the intervention on use of chronic management asthma and COPD medications, we used a combined matching and a difference in differ-ence (DID) regression approach rather than a matching estimator alone to estimate the intervention effect. An advantage of the combined matching-DID approach is that it relies on relatively weaker assumptions compared to the matching estimators alone. In the case of match-ing estimators, the estimated intervention effect relies on the independence assumption between the exposure to the intervention and potential health outcome upon
controlling the relevant covariates [24]. One way to vio-late this assumption would be through unobservable fac-tors affecting the selection to the intervention that in turn affects health outcome. The combined matching-DID approach removes any remaining, even after match-ing, time-invariant systematic differences between the intervention and control units. Although the combined approach eliminates any time invariant unobserved dif-ferences, it cannot provide a solution to any bias due to a change in health status for either group after the matching. One important health status indicator would be the new health conditions and comorbidities that are developed after the matching. With a combined matching-DID approach, we controlled for several comorbidities developed any time after the baseline as defined below:
yi¼αþβIiþγDiþδxiþεi ð2Þ
where subscriptistands for individuals who are either in intervention or control groups.
The dependent variable, yi=Yi1−Yi0, denotes the
change in outcome variableY before and after the inter-vention. In order to capture time variant differences between the intervention and control units, we used changes in the number of chest imaging services provided, physician consultation via telephone, non-clinical phys-ician services (i.e. health teaching/counseling regarding patient’s treatment), and physician services received with provisional codes before and after the intervention. In addition, we used a matrix of indicator variables, Di, for
[image:5.595.57.542.89.302.2]several new conditions and comorbidities developed any time after the baseline.
In order to determine the intervention effects, we are specifically interested in estimating the coefficient of the indicator variable, Ii, that identifies the intervention
group. As a result, the model above was estimated separ-ately for each year after the intervention to obtain one to four year intervention effects. We summarized main results for the intervention effect in the next section. The full results for each outcome variable are presented in the additional file (see Appendix Tables D.1-D.4, and G.1-G.4 presented in Additional file 1).
Results
We examined the intervention effect on cost and dispen-sation of medications by type of the prescription drugs. For each outcome variable, we estimated model (2) for each year in order to identify the intervention effect in the corresponding year. Table 2 presents a summary result for the cost of prescription drugs within one to four years after the intervention while Table 3 presents the same information for drug dispensations.
[image:6.595.56.539.100.392.2]Each column in Table 2 presents the intervention effect for the corresponding year. As shown in the table, overall drug cost for the intervention group is higher than that of the control group. On average, intervention group spends more on prescription drugs primarily due
Table 2Summary results for the intervention effect on annual
cost of prescription drugs
2008 2009 2010 2011
Asthma/ COPD drugs
192.6(0.00) 192.2(0.00) 204.9(0.00) 156.6(0.00)
Asthma/ COPD chronic management
164.5(0.00) 178.5(0.00) 195.5(0.00) 157.1(0.00)
Asthma/COPD acute drugs −
6.45 (0.41) −10.4 (0.18) −6.09 (0.48) −8.5 (0.40)
Other asthma drugs (unclassified)
34.6 (0.06) 24.1 (0.18) 15.5 (0.35) 8.03 (0.60)
Other drugs −2.6 (0.97) 51.4 (0.53) 168.2 (0.15) 109.1 (0.38)
All drugs 190.0(0.04) 243.6(0.02) 373.2(0.01) 265.7 (0.06)
[image:6.595.305.539.565.707.2]Note: The numbers in parentheses show thep-values for the statistical significance of the estimated coefficient for the intervention effect.P-values for statistically significant results are shown in bold
Table 1Baseline comparisons for main outcome variables
Intervention Control p-values for mean
difference test
Mean SD Mean SD
Physician services
Cost (average cost in dollars/year) 559 550 549 670 0.83
Prescription drug cost (average cost in dollars/year)
Asthma/COPD drugs 228 436 170 416 0.08
Asthma/COPD chronic management 149 354 110 335 0.13
Asthma/COPD acute drugs 62 104 50 115 0.18
Asthma drugs (unclassified) 17 123 10 65 0.23
Other drugs 841 1331 877 2789 0.86
Total drugs 1069 1490 1047 2840 0.92
Prescription drug dispensations (average count/year)
Asthma/COPD drugs 5.2 7.44 4.1 7.09 0.06
Asthma/COPD chronic management 2.0 4.59 1.4 3.84 0.06
Asthma/COPD acute drugs 2.9 3.82 2.5 4.24 0.18
Asthma drugs (unclassified) 0.27 1.38 0.20 1.07 0.41
Other drugs 19.6 24.67 17.8 25.81 0.36
Total drugs 24.8 27.23 21.9 27.84 0.18
Hospital services (average count/year)
Inpatient admission 0.10 0.36 0.08 0.35 0.63
Length of stay 0.59 2.44 0.39 2.46 0.29
to asthma and COPD related drugs. However, there is no difference in the use of acute care asthma and COPD drugs. This change is primarily driven by the chronic management drugs.
The intervention creates a persistent effect over time in the form of higher utilization of chronic management drugs. In particular, Table 2 shows that the effect on the annual cost of chronic management drugs within one to four years following the intervention is between $157 and $195. As compared to the cost for chronic manage-ment drugs at the baseline, this effect is quite substantial. It implies that the intervention increases the cost by more than 100 % of the baseline cost for chronic management drugs of the intervention group.
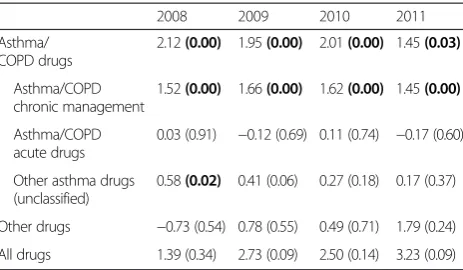
We observe the same pattern over the same time period when we assess the dispensation of chronic man-agement drugs in average number of annual prescription filled. As shown in Table 3, the intervention increases the dispensation of chronic management drugs. The effect varies from 1.4 to 1.6 prescription filled in a given year. This overall effect on chronic management drugs clearly indicates that the use of chronic management medications substantially increases with the intervention even four years after the intervention. For any other types of drugs, there is no evidence that the intervention has any impact on cost or number of prescription drug utilization.
Discussions
Administrative health databases provide a unique oppor-tunity to follow patients across multiple years and observe their drug dispensations. By comparing the intervention participants with a comparable control group we examined the impact of intervention on medi-cation use, and other health care service utilization.
Our results suggest that intervention participants have consistently used more chronic management drugs dur-ing four consecutive years followdur-ing the intervention. This finding related to the long-term sustainability of the intervention is an important contribution to the literature as previous studies reported that the initial increase in the use of chronic management drugs started to decrease after the active intervention period [4]. While we showed that intervention increases the use of chronic disease management drugs, it does not have any statistically significant effect on number of hospitaliza-tions, length of hospital stays, and cost of physician visits. We presented a summary table showing these additional findings (see Appendix: Table 4). This implies that the intervention may generate saving since it is ex-pected that patients who can manage their diseases bet-ter, are more likely to require fewer resources when hospitalized. Given that an average cost of an inpatient visit is $2,938 for asthma and $6,514 for COPD patients [25], even a small difference in required resources dur-ing inpatient treatment generates substantial net savdur-ings for the healthcare system.
As indicated earlier, a body of literature shows that better asthma and COPD management reduces unsched-uled health care use [5, 13, 26]. Therefore, the patient education intervention studied in this paper may also generate an additional saving by reducing emergency care visits. The Canadian Institute for Health Informa-tion (CIHI) estimates that the average cost for a single asthma related emergency department visit is $205 while the average cost of a COPD related visit is $275 [25]. Our results suggest that the incremental cost of the intervention in the form of higher utilization of chronic management drugs is lower than the average cost of one emergency visit for this patient group. This implies that the intervention would create net saving if, on average, less than one emergency department visit per patient is avoided even if it has no impact on other health out-comes. However, emergency department data are not available for this study to directly measure whether emergency utilization decreases. Due to limitations in data availability for emergency care visits, and intensity of inpatient care for the study participants, we cannot examine these issues. These additional questions deserve further research.
[image:7.595.58.290.110.245.2]In addition to the limitation mentioned above, there are other shortcomings of administrative health data-bases. For instance completeness and quality of admi-nistrative databases can be considered as another limitation. In our case, drugs administered in hospitals and over the counter purchases are not captured in the PDP database. As smoking cessation drugs are available over the counter, we are unable to fully capture the im-pact of these drugs on patient behavior regarding the
Table 3Summary results for the intervention effect on drug
dispensations in counts
2008 2009 2010 2011
Asthma/ COPD drugs
2.12(0.00) 1.95(0.00) 2.01(0.00) 1.45(0.03)
Asthma/COPD chronic management
1.52(0.00) 1.66(0.00) 1.62(0.00) 1.45(0.00)
Asthma/COPD acute drugs
0.03 (0.91) −0.12 (0.69) 0.11 (0.74) −0.17 (0.60)
Other asthma drugs (unclassified)
0.58(0.02) 0.41 (0.06) 0.27 (0.18) 0.17 (0.37)
Other drugs −0.73 (0.54) 0.78 (0.55) 0.49 (0.71) 1.79 (0.24)
All drugs 1.39 (0.34) 2.73 (0.09) 2.50 (0.14) 3.23 (0.09)
use of other asthma and COPD drugs. These limitations need to be taken into consideration when interpreting the results documented in this paper.
Conclusion
In this paper, we examined the effects of Lung Association’s intervention on asthma and COPD medications using propensity score matching and regression analysis. Our results show that the intervention improves medication use, especially for those that are used for management of asthma and COPD. The effect is significant and per-sistent during the study period covering four years after the intervention. However, there is no observed inter-vention effect on use of asthma and COPD acute care drugs, other asthma drugs, or utilization of other drugs which are not related to asthma and COPD. Our main result shows that the intervention increases the chronic management drug costs by about $157 to $195 in any year during the study period. The same pattern for dispensations of chronic management drugs were also observed in this study. Based on our findings, we con-clude that an education program for asthma and COPD patients has potential to improve patients’ health out-come by increasing the use of chronic management medications.
Endnote 1
At the time of the intervention, the researchers of this paper were not part of the team conducting the inter-vention. Therefore they have not performed any power analysis to determine the sample size.
Appendix
Our additional results indicate that the intervention does not have any statistically significant effect on number of hospitalizations, length of hospital stays, and cost of physician visits. These findings are summarized in Table 4 below.
Additional file
Additional file 1:There is an online appendix uploaded in pdf format with a file name ofHSR_Online_appendix.It presents the full results from our empirical analysis including a brief description of databases used in this paper. (PDF 856 kb)
Abbreviations
CIHI:Canadian Institute for Health Information; COPD: Chronic obstructive pulmonary disease; CREs: Certified Respiratory Educators; DAD: Discharge Abstract Database; ED: Emergency department; DID: Difference-in-difference; MSB: Medical services billing claims data; PDP: Prescription Drug Plan Historical Claims; PHRS: Personal Health Registration System; PS: Propensity score.
Competing interests
The authors declare that they have no competing interests.
Authors’contributions
Both authors participated in all aspects of the research including manuscript writing and revisions. Under the direct assistance from NS, MO performed the computations and data work at HQC. NS led the research tasks related to empirical framework, study design, and manuscript writing. Both authors read and approved the final manuscript.
Acknowledgements
This project was funded by the Mathematics of Information Technology and Complex Systems (MITACS) and the Lung Association of Saskatchewan. We thank them for financial support. We also thank for in-kind support of the Saskatchewan Health Quality Council (HQC) in providing a portion of Meric Osman's time to contribute to the conduct of this study. The research has been conducted using administrative databases. While the analyses are based on data from the Saskatchewan Ministry of Health at HQC, the opinions expressed here do not represent the views of the Ministry or HQC. We received detailed feedback from Gary Teare for this manuscript, and would like to thank him for his insightful comments.
Author details
1
Department of Economics, University of Saskatchewan, S7N5A5 Saskatoon, SK, Canada.2Saskatchewan Health Quality Council, Saskatoon, Canada.
Received: 23 October 2014 Accepted: 11 August 2015
References
1. Spector S. Noncompliance with asthma therapy: Are there solutions? J Asthma. 2000;37(5):381–8.
2. Gamble J, Stevenson M, McClean E, Heaney LG. The prevalence of nonadherence in difficult asthma. Am J Resp and Critical Care Medicine. 2009;180(9):817–22.
3. Rand CS, Wise RA. Measuring adherence to asthma medication regimens. Am J Respir Crit Care Med. 1994;149(Supplement: Asthma Outcome Measures):S69–76.
4. Otsuki M, Eakin MN, Rand CS, Butz AM, Hsu VD, Zuckerman IH, et al. Adherence feedback to improve asthma outcomes among inner-city children: a randomized trial. Pediatrics. 2009;124(6):1513–21. 5. Bruzzese JM, Sheares BJ, Vincent EJ, Du Y, Sadeghi H, Levison MJ, et al.
Effects of a school-based intervention for urban adolescents with asthma. A controlled trial. Am J Respir Crit Care Med. 2011;183(8):998–1006. 6. Bailey WC, Kohler CL, Richards JM, Windsor RA, Brooks CM, Gerald LB, et al.
Asthma self-management: do patient education programs always have an impact? Arch Intern Med. 1999;159(20):2422–8.
7. Wilson SR, Strub P, Buist AS, Knowles SB, Lavori PW, Lapidus J, et al. Shared treatment decision making improves adherence and outcomes in poorly controlled asthma. Am J Respir Crit Care Med. 2010;181(6):566–77. 8. Gamble J, Stevenson M, Heaney LG. A study of a multi-level intervention
[image:8.595.57.290.587.717.2]to improve non-adherence in difficult to control asthma. Respir Med. 2011;105(9):1308–15.
Table 4Summary results for the intervention effect on
physician and hospital services
2008 2009 2010 2011
Average cost for physician services
2.02 (0.97) 10.68 (0.85) −16.7 (0.76) 72.2 (0.25)
Hospital services
Numbers of inpatient admissions
−0.06 (0.09) −0.01 (0.77) −0.01 (0.83) 0.08 (0.15)
Numbers of asthma/ COPD inpatient admissions
−0.02 (0.19) 0.01 (0.69) −0.01 (0.99) 0.01 (0.87)
Length of stay in number of days −
0.49 (0.14) −0.44 (0.19) −0.53 (0.31) 1.04 (0.28)
9. Khdour MR, Kidney JC, Smyth BM, McElnay JC. Clinical pharmacy-led disease and medicine management programme for patients with COPD. Br J Clin Pharmacol. 2009;68(4):588–98.
10. Farber HJ, Oliveria L. Trial of an asthma education program in an inner-city pediatric emergency department. Pediatric Asthma Allergy & Immunology. 2004;17(2):107–15.
11. Nieuwlaat R, Wilczynski N, Navarro T, Hobson N, Jeffery R, Keepanasseril A, et al. Interventions for enhancing medication adherence. Cochrane Database Syst Rev. 2014;11:Art. No. CD000011.
12. Jarab AS, Alqudah SG, Khdour M, Shamssain M, Mukattash TL. Impact of pharmaceutical care on health outcomes in patients with COPD. Int J Clin Pharm. 2012;34(1):53–62.
13. Zeiger RS, Heller S, Mellon MH, Wald J, Falkoff R, Schatz M. Facilitated referral to asthma specialist reduces relapses in asthma emergency room visits. J Allergy Clin Immunol. 1991;87:1160–8.
14. Kuwornu JP, Lix LM, Wang E, Osman M, Teare GF. A comparison of statistical models for analyzing episodes-of-care costs for chronic obstructive pulmonary disease exacerbations. Health Serv Outcome Res Methodol. 2013;13(2–4):203–18.
15. Health Quality Council (HQC). Breathing Easier: Opportunities to improve the quality of asthma care in Saskatchewan. Health Quality Council Research Report 2005 Available on request from [email protected].
16. Charlson ME, Pompei P, Ales KL, MacKenzie CR. A new method of classifying prognostic comorbidity in longitudinal studies: development and validation. J Chronic Dis. 1987;40:373–83.
17. Elixhauser A, Steiner C, Harris DR, Coffey RM. Comorbidity measures for use with administrative data. Med Care. 1998;36:8–27.
18. Leslie RS, Ghomrawi H. The use of propensity scores and instrumental variable methods to adjust for treatment selection bias, SAS Global Forum. 2008. Paper 336.
19. Rosenbaum PR, Rubin DB. The central role of the propensity score in observational studies for causal effects. Biometrica. 1983;70:41–55. 20. Stukel AT, Fisher ES, Wennberg DE, Alter DA, Gottlieb DJ, Vermeulen MJ.
Analysis of observational studies in the presence of treatment selection bias. JAMA. 2007;297:278–85.
21. Austin P. An Introduction to Propensity Score Methods for Reducing the Effects of Confounding in Observational Studies. Multivariate Beh Research. 2011;2011(46):399–424.
22. Dehejia RH, Wahba S. Propensity score-matching methods for nonexperimental causal studies. Rev Econ Stat. 2002;84(1):151–61. 23. Austin PC. Optimal caliper widths for propensity-score matching when
estimating differences in means and differences in proportions in observational studies. Pharma Stat. 2011;10:150–61.
24. Moreno-Serra R. Matching Estimators of Average Treatment Effects: a Review Applied to the Evaluation of Health Care Programmes. HEDG Working Paper Series: University of York; 2007.
25. Canadian Institute for Health Information. Disparities in Primary Health Care Experiences Among Canadians with Ambulatory Care Sensitive Conditions. Ottawa: CIHI Press; 2012.
26. Yoon R, McKenzie DK, Bauman A, Miles DA. Controlled trial evaluation of an asthma education program for adults. Thorax. 1993;48:1110–6.
Submit your next manuscript to BioMed Central and take full advantage of:
• Convenient online submission
• Thorough peer review
• No space constraints or color figure charges
• Immediate publication on acceptance
• Inclusion in PubMed, CAS, Scopus and Google Scholar
• Research which is freely available for redistribution