Rochester Institute of Technology
RIT Scholar Works
Theses Thesis/Dissertation Collections
5-1-2009
Reducing changeover times in a web offset
packaging environment
Prashanth Nagarajan
Follow this and additional works at:http://scholarworks.rit.edu/theses
This Thesis is brought to you for free and open access by the Thesis/Dissertation Collections at RIT Scholar Works. It has been accepted for inclusion in Theses by an authorized administrator of RIT Scholar Works. For more information, please [email protected].
Recommended Citation
Reducing Changeover Times in a Web Offset Packaging Environment
by Prashanth Nagarajan
A thesis submitted in partial fulfillment of the requirements for the degree of Master of Science
in the School of Print Media
in the College of Imaging Arts and Sciences of the Rochester Institute of Technology
May 2009
iii
Acknowledgement
I would like to thank Michelle Fontaine, Manager of Continuous
Improvement, at Amgraph Packaging Inc. (Norwich, CT) for providing me the
support I needed in completing a practical thesis. I had been particular about
working on a practical thesis and Michelle made sure this became a reality for
me.
I would like to express my gratitude towards my Primary advisor, Dr. Scott
Williams, and my Secondary advisor, Dr. Jack Cook, for providing me the
valuable and timely inputs I needed to make this a professional thesis.
Last, but certainly not the least, I would like to thank my family for always
iv
TABLE OF CONTENTS
LIST OF TABLES ... ix
LIST OF FIGURES...x
LIST OF EQUATIONS ... xi
Abstract ... xii
Introduction... 1
Problem Statement...2
Personal Interest of Study...3
Problems Currently Plaguing the Printing Industry...3
Increase in Raw Material Cost... 4
Increased Competition ... 4
Slowing U.S. Economy ... 5
Environmental Challenges ... 6
Objectives of this Research...6
Literature Review ... 7
Lean Manufacturing ...7
Definition of Lean... 7
History of Lean...10
Toyota Production System... 11
v
Tools of Lean... 14
5S ... 14
Value Stream Map (VSM)... 17
Product Family...18
Kaizen Event...18
Current State Map...19
Future State Map...21
SingleMinute Exchange of Dies (SMED) ... 21
Stages of SMED...23
Difficulty in Implementing Lean Manufacturing ...24
Implementing Lean within Printing Companies ... 25
Luminer Converting, Lakewood, NJ ...26
Associates Graphics Services (AGS) Wilmington, DE ...27
Tailored Label Products, Menomonee Falls, WI ...28
A1 Paper Stationery...29
Summary of Setup Reduction Performed in Printing Companies ... 31
Graphic Arts Division, Fountain Inn, SC ...31
Kappa Kraftliner AB, Sweden ...33
Summary of Setup Reduction Performed by Print Equipment Manufacturers... 34
Paper Converting Machine Corporation, USA...34
MAN Roland, USA...35
Valmet Rotomec, Italy...36
vi
Summary of Setup Reduction Performed by
NonPrinting Equipment Manufacturers ... 37
Manufacturer of Precision Engineered Tubing; North Branch, NJ ...37
Ingersoll Cutting Tool Co. (ICTC); Rockford, IL...39
Hypothesis Statements...41
Methodology ...42
Video Recording the Insert Changes ... 42
Creating an Excel Spreadsheet ... 43
Calculating the Process Cycle Efficiency... 44
Calculating the Possible Annual Savings... 45
Creating a 5S Team... 45
Conducting a 5S Event ... 46
Day 1 Sequence of Events...47
Day 2 Sequence of Events...48
Creating a SMED Team ... 50
Week 1: Initial Training and Orientation...51
Week 2: Analyze Insert Change and Separate Results into Internal, External, and Parallel...51
Week 3: Streamlining Activities ...52
Week 4: Perform Insert Change with Discussed Changes...53
Week 5: Standardize New Insert Change Procedure...53
vii
Results and Discussions...56
Building the Trust of Press Operators ... 56
Results of 5S event... 58
Before SMED Initiative ... 60
After SMED Initiative ... 64
Testing the Difference Between the Two Means of PCE ...68
Calculation of Annual Savings... 70
Summary and Conclusions...71
Recommendations for Further Research ... 73
Bibliography ...74
Appendix A ...80
Appendix A1...81
Appendix A2...82
Appendix A3...83
Appendix A4...84
Appendix A5...85
Appendix A6...86
Appendix B1...88
Appendix C...89
viii
Appendix C2 ...91
Appendix C3 ...92
Appendix C4 ...93
Appendix C5 ...94
Appendix C6 ...95
Appendix C7 ...96
Appendix D ...97
Appendix D1 ...98
ix
LIST OF TABLES
Table 1. Glossary of Lean Terms ... 9
Table 2. Translation of 5S terms ... 17
Table 3. Three-Day Kaizen Event Agenda... 19
Table 4. Summary of Luminer Converting... 27
Table 5. Summary of Associates Graphics Services ... 28
Table 6. Summary of Tailored Label Products ... 29
Table 7. Summary of A1 Stationery Products ... 30
Table 8. Summary of Graphic Arts Division ... 32
Table 9. Summary of Kappa Kraftliner ... 33
Table 10. Summary of PCMC ... 35
Table 11. Summary of MAN Roland... 36
Table 12. Summary of Valmet Rotomec ... 37
Table 13. Summary of Precision Tubing Manufacturer ... 39
Table 14. Summary of Ingersoll Cutting Inc. ... 40
Table 15. Improved Changeover times after SMED event... 66
x
LIST OF FIGURES
Figure 1. Summary of SMED process... 55
Figure 2. Comparison of Changeover times before and after SMED... 67
Figure 3. Comparison of PCE before and after SMED... 68
Figure 4. Stevens Press ... 81
Figure 5. Stevens Press Inserts ... 82
Figure 6. Value Stream Mapping Icons ... 83
Figure 7. Value Stream Mapping Current State ... 84
Figure 8. Value Stream Mapping Future State... 85
Figure 9. Fishbone Diagram... 86
Figure 10. Stevens 5S Results Display Chart ... 88
Figure 11. 5S Pre-Event Audit Form ... 90
Figure 12. 5S Post-Event Audit Form... 91
Figure 13. Weekly Housekeeping Inspection Checklist ... 92
Figure 14. Shadow Board... 93
Figure 15. Pneumatic wrench used for upper bolts on Stevens Press... 94
Figure 16. Spaghetti Diagram – Before SMED ... 95
xi
LIST OF EQUATIONS
Equation 1. Takt time ... 20
Equation 2. Process Cycle Efficiency (PCE) ... 45
xii
Abstract
The printing industry has been experiencing steadily rising costs and
declining profits, at times leading to the closing down, consolidation, or
restructuring of printing companies. Lean Manufacturing is an effective tool that
has helped several printing companies to overcome these rising costs by
reducing the cost of production and by improving productivity (Cooper, 2007).
This research identified methods to reduce setup times, leading to savings of
close to $60,000 annually on one press. The average setup time was reduced by
60%, from over two hours to less than one hour. The changes implemented on
one press could be standardized on the other two similar presses in the offset
department to provide annual savings of over $200,000.
The researcher worked with a packaging company for a period of six
months, during which time he worked on improving the changeover time on one
of the Stevens web offset presses. The method of study employed was called
Action Research, which involved direct interaction with employees of the
organization. The researcher used Process Cycle Efficiency (PCE) as a
parameter of success, which is measure of the value added time.
This research demonstrates that a Single Minute Exchange of Die (SMED)
event can be used successfully in reducing setup times on a Stevens web offset
1
Chapter 1
Introduction
Over the last two decades, there has been a global focus on the
importance of Lean Manufacturing. Lean Manufacturing can be defined as a
journey of continuous improvement by implementing innovative ideas to reduce
waste and increase productivity (Womack et al., 1990). Toyota Motor Corporation
chose to reduce wastes and increase productivity by continuous improvement
methods rather than capital investments (Raman & Stewart, 2007). Since that
time, many manufacturing industries have taken initiatives in implementing the
practice of Lean Manufacturing in their production lines.
Lean Manufacturing has now spread to the printing industry. A survey
conducted by the Printing Industries of America and Graphic Arts Technical
Foundation (PIA/GATF) concluded that 77% of American printing company
managers had heard of or have read about Lean Manufacturing. It further added
that 66% were familiar with the concepts and tools, while 40% were actually
using Lean Manufacturing to strengthen their business (PIA/GATF Conducts
2
Problem Statement
A packaging printer in Connecticut faced problems with the time spent on
changeovers and was hopeful the time could be reduced. The researcher worked
with the company for six months to reduce the changeover time. The press
studied was the Stevens web offset press (see Appendix A1). Stevens
Technology is an American manufacturer of Web offset presses based in Fort
Worth, TX. The Stevens press is a web offset press that produces roll-to-roll. The
press is used primarily for printing food-packaging products.
The circumference of the plate, blanket, and impression cylinder
determined the “repeat length” of the print order. The plate, blanket, and
impression cylinder together formed a system referred to as an insert (see
Appendix A2). The Stevens press came equipped with a feature that allowed for
changing the repeat length by changing the inserts on the press at every unit.
The different insert sizes used were 17.5”, 21”, 22.5”, 23.5”, 24”, and 26”. The
reason for using different insert sizes was to accommodate as many copies of a
product as possible within one repeat length. For instance, if a food pouch
measured a width of 4 1/2”, then five such food pouches would fit on a 22.5”
insert in the most economical manner with minimal waste.
The insert change was considered an overhead activity and the company
did not charge the customer for the time spent performing it. The events following
3
were charged to the customer, but the actual insert change was not. As a result,
the company wanted to reduce the time taken to perform an insert change.
Personal Interest of Study
The researcher comes from a family who owns a business in a similar line
to that of the company involved in this research. The aim was to learn as much
as possible during the implementation of this research, and to take the lessons
learned back to the family business.
Problems Currently Plaguing the Printing Industry
The Printing Industry worldwide has been facing problems pertaining to:
1. Increased cost of raw materials
2. Increased competition
3. Slowing economy
4. Environmental challenges
According to Kadlub (2008), the Printing Industry has been in the midst of
a transformation over the last decade. The evolution of new media such as
4 Increase in Raw Material Cost
The print market has been seeing a consistent increase in the price of
paper (Steinmetz, 2006). Printing companies are also seeing a larger variation in
the demand for print. The printing costs in China have increased as much as
40% since the beginning of 2008 (Page, 2008). Other factors to consider include
the price of oil, the currency fluctuation in the US dollar, and the new labor laws
in China.
In the US, paper mills are being accused of not doing enough to help
printers cut costs. The rolls produced by certain mills are defective, and then the
printers used these rolls. One of the recent problems included stone damage, in
which the end of the paper reel was dented and water damaged (Hooker, 2009).
Increased Competition
At one time, printers faced competition from other companies within the
same town or state. Competition has now become global. With countries such as
India, China, and the Philippines providing cheap labor, the cost of printed goods
has become very competitive (Delmontagne, 2008). The global recession has
exposed printing companies with poor business models in the UK. In a survey
conducted by Plimsoll Publishing, 310 of the leading 1000 printing companies in
the UK were in financial danger. Of these, 236 experienced falling profits, with
192 losing money. Further, the UK printing industry as a whole has overcapacity,
5
Cagle (2008) explains that, in spite of the rising cost of raw materials,
raising prices to the customer is unlikely to be successful. Ultimately, the low cost
producer prevails.
Slowing U.S. Economy
The middle of 2008 has seen a global recession that left no country
unaffected. The U.S. is amongst the worst of the affected countries. In particular,
the manufacturing and financial sectors are deeply affected. The fall of the
automobile industry has compounded issues for the printing industry. US
automakers comprise the single largest category within commercial printing,
accounting for as much as 12% of all advertising. Their spending in 2008 was
$15 billion, which was almost equal to 1999 figures; however, it was down from
$24 billion in 2004 (Bullock, 2008).
German press-manufacturing giant, Heidelberg, expects an operating loss
of close to EUR 40 million in 2008; down from a positive result of EUR 26 million
in 2007. Despite the success of Drupa in June 2008, the company still expects to
post losses due to the sluggishness of the world economy (Heidelberger, 2008).
In Germany, the printing industry grew by 2.5% in 2007, but by only 1.8%
in 2008. This drop in growth has been linked to the slowing economy, as
advertising accounts for a considerable portion of the printing industry. During
tough economic times such as these, corporate companies are cutting back on
6 Environmental Challenges
Companies such as Walmart and Toyota, who have a global image of
sustainability, expect their printers to be green as well (Rosenberg, 2008). This
not only requires a printing company to maintain green standards, but also work
with green suppliers.
A major benefit of digital printing is the reduced waste from setup and
overproduction. This advantage, however, is overshadowed by the problems
faced in de-inking, which is the process of removing inkjet toner printed on paper
so that it may be recycled (DeWitt, 2009).
While the problems faced by the printing industry cannot be completely
eliminated, following Lean Manufacturing practices can help reduce them.
Objectives of this Research
The main objective of this research is to prove that
Single-Minute-Exchange of-Die (SMED) can be used to reduce changeover times on a Stevens
Web Offset press. The researcher is also keen on using Process Cycle Efficiency
(PCE) as a parameter of success to determine if the changeover process can be
classified as lean. This parameter has not been used to measure the success of
7
Chapter 2
Literature Review
The literature review explains the history and basics of manufacturing and
reviews some of the commonly used tools. This section also reviews the work
culture at Toyota Motor Corporation and takes a look at some of the reasons
behind the company’s success.
Lean Manufacturing
“Everyone wants to be the Lance Armstrong of lean business these days”
(Hassler, 2008). Unfortunately, while Lean Manufacturing is easy to understand,
it is complex to implement (Domingo et al., 2007). The concept of Lean
Manufacturing (often referred to as Lean) is understood from its basic definition,
its history, and an examination of the ways in which it has been implemented.
Definition of Lean
Lean means “manufacturing without waste” (Taj, 2008). Rothenberg &
Cost (2004) have defined Lean as “a way to reduce buffers.” The term, Lean
Manufacturing, or Lean, was first used by Womack et al. (1990), in their book
The Machine that Changed the World. The term, Lean Manufacturing, describes
the type of production employed by Toyota in the 1950s. Lean deals with the
8
maximize profits. Lean Manufacturing has helped Toyota Motor Corporation
become a global giant (Alukal, 2007).
A Lean system focuses on providing a customer what he or she wants, at
the price they are willing to pay for it, and at the time they want it (Brown et al.,
2006). According to Taichi Ohno, one of the founders of the Lean culture at
Toyota, wastes account for 95% of all costs in a company (Comm & Mathasiel,
2005). Lean focuses on eliminating wastes or muda (Japanese for “waste.”)
The seven types of wastes according to Lean are classified as:
1. Rework – due to customer dissatisfaction
2. Overproduction – producing without reason
3. Over processing – spending too much time on the product
4. Transportation – unnecessary movement of goods
5. Inventory – high levels of stocked raw materials
6. Waiting – delayed set-ups
7. Motion – physical strains, such as walking, lifting, and bending
(Imai, 1986., Taj, 2008).
Lean is not restricted to just reducing waste. When compared to mass
production, Lean uses “half the human effort, half the space, half the time, half
9
activity performed that does not add value to the product as defined by the
customer is termed non-value added or waste (Comm & Mathasiel, 2005). Mass
producers can expect improvements to the extent of 90% reduction in
inventories, 90% reduction in lead time, 90% reduction in cost of quality, and
50% increase in productivity (Lathin & Mitchell, 2001).
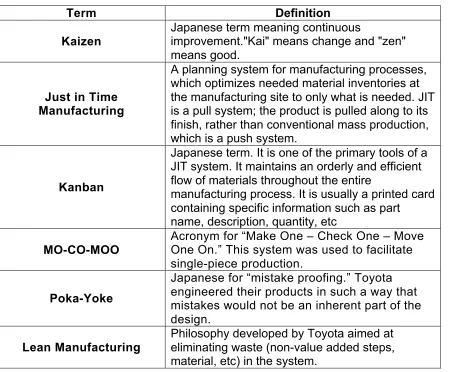
Table 1 gives a glossary of Lean terminology. For a more detailed
[image:21.612.105.554.331.703.2]glossary, refer Appendix D2.
Table 1. Glossary of Lean Terms
Term Definition
Kaizen
Japanese term meaning continuous
improvement."Kai" means change and "zen" means good.
Just in Time Manufacturing
A planning system for manufacturing processes, which optimizes needed material inventories at the manufacturing site to only what is needed. JIT is a pull system; the product is pulled along to its finish, rather than conventional mass production, which is a push system.
Kanban
Japanese term. It is one of the primary tools of a JIT system. It maintains an orderly and efficient flow of materials throughout the entire
manufacturing process. It is usually a printed card containing specific information such as part
name, description, quantity, etc
MO-CO-MOO
Acronym for “Make One – Check One – Move One On.” This system was used to facilitate single-piece production.
Poka-Yoke
Japanese for “mistake proofing.” Toyota engineered their products in such a way that mistakes would not be an inherent part of the design.
Lean Manufacturing
10
Toyota Production System (TPS)
The Toyota production system is a technology of comprehensive production management. The basic idea of this system is to maintain a
continuous flow of products in factories to flexibly adapt to demand changes. The realization of such production flow is called Just-in-time production, which means producing only necessary units in a necessary quantity at a necessary time. As a result, the excess inventories and the excess work force are naturally diminished; thereby achieving the purposes of increased productivity and cost reduction.
History of Lean
The concept of Lean first appeared in the 1920s when Henry Ford wanted
to adopt ways to make Ford car engines more fuel efficient in light of a global oil
crisis (Womack et al., 1990). This practice of Lean was later mastered by the
Toyota Motor Company when Taiichi Ohno, regarded widely as the Father of the
Toyota Production System (TPS), sent his engineer Eiji Toyoda to the Ford
Rouge Plant in the United States to study its system of manufacturing.
Toyoda returned to Japan and reported his observations of wastages at
the Ford Plant to Ohno. Ohno then worked towards strategizing a
waste-reduction module, which he started to implement at the Toyota Motor Company.
Thus, the Toyota Production System was born (Womack et al., 1990; Lean
11
Toyota Production System
The Toyota Production System (TPS) focuses on removing wastes from
within a process and making it “lean” (Lander & Liker, 2007). The essence of
TPS is to reduce batch-wise manufacturing and to produce in a “lean” manner, a
direct contrast to Ford’s method of mass production (Womack et al., 1990).
The disadvantages associated with batch production are:
1. Rising inventories equate to a drop in cash flow.
2. Large inventories occupy more floor space, thereby limiting the company’s
scope of expansion.
3. A company holding large inventories cannot adapt to a quick shift in
customer demand (Brown et al., 2006).
The importance of TPS came to the fore soon after the oil crisis in the
early 1970s. People started to notice that Toyota had not been as badly hit as
their competitors and that it took less time to recover (Lander & Liker, 2007).
Toyota focused on redesigning the Mass Production System and converted them
into U-shaped sub-assembly cells. The shop floor ultimately resembled smaller
manufacturing cells (Black, 2007). Other companies who tried to copy the TPS
did not meet with as much success. The main reason for this was that they were
trying to implement the concepts in a formulaic way that was never intended.
Toyota, on the other hand, believed in Continuous Improvement and constant
12
To quote one of the principles defined in The Toyota Way: “Create
continuous flow to bring problems to the surface. Create flow to move materials
and information fast, as well as to link processes and people together so that
problems surface right away” (Liker, 2004).
This principle explains the importance of moving the material faster
through the process, while linking the process with the people. This principle
demonstrates that simply getting rid of excess inventory is not enough to make
an organization Lean (Lander & Liker, 2007).
The formulation of the TPS followed certain design rules:
1. The first design rule calculated the Takt Time (TT) that was based on the
daily demands from the customer.
2. The second design rule was based on the MO-CO-MOO Principle. This is an
acronym for “Make One. Check One. Move One On”. In Lean terms, this is
also referred to as one-piece flow (Shingo, 1989).
3. The third design rule was to design manufacturing cells in such a way that the
processing time is less than the Necessary Cycle Time (NCT). The
Necessary Cycle Time, in turn, is slightly less than the Takt Time to provide a
margin of safety.
4. The fourth design rule applied to the Inventory Control System and
encouraged the “pull” system of functioning. This system was known within
13 Toyota House of Quality
Toyota developed their House of Quality as a derivative of the Quality
Function Deployment (QFD) developed by Mitsubishi in 1972. The foundation of
the house was that the product must reflect the customer’s requirements. This
meant the marketing, engineering, and manufacturing teams needed to work
together from the conception of the product (Hauser, 1988; Womack et al.,
1990). As an example, the house helped Toyota to improve the rust prevention in
their cars and improved their position from being the worst in the industry to the
best. They relied on customer feedback to overcome their problems (Hauser,
14
Tools of Lean
The tools of Lean that will be reviewed are 5S, Value Stream Mapping,
and Single Minute Exchange of Dies.
5S
While 5S is commonly referred to as only a “housekeeping” tool, it goes
beyond that. It is a workplace environmental hygiene that originated in Japan
(Douglas, 2002). It has also been defined as “an idea that reshapes the
workplace and provides a foundation for all improvement” (Patten, 2006, p. 57).
The five points originate from the following five Japanese terms, each starting
with the letter, “S” (Imai, 1986; Ho, 1999; Douglas, 2002):
1. Seiri (Sort) – This activity involves the segregating and discarding
of items no longer useful. It is important to differentiate between
what is essential and what is not (Patten, 2006). Ho (1999) stresses
the importance of a principle called “one-is-best,” which applies to
manufacturing, as well as to administrative workplaces. This
includes one set of tools, one set of stationery, one location for
storage of files, and so on.
2. Seiton (Set) – This activity involves the arranging and identification
of all useful items. A well-known expression of seiton is “A place for
15
is important to keep the workplace neat, it is also important to
arrange things in a manner that best serves the purpose
functionally (Patten, 2006).
3. Seiso (Shine) – This thought reflects the importance of keeping the
workplace clean and neat. For best results, seiso adherents
recommend implementing this culture of cleanliness into the daily
routine (Imai, 1986). According to Ho (1999), “Everybody is a
Janitor.” The culture in Japan, where the 5S originated, encourages
people to clean up after themselves. A challenge in Seiso is to
identify and to eliminate the root cause for the dirt, rather than to
repeatedly clean (Patten, 2006).
4. Seiketsu (Standardize) – This activity involves introducing
standards in every workstation. This includes supplies (such as
brooms, buckets, mops, rags, etc) for cleaning at every station.
Management must also allocate time at the end of every shift to
complete the cleaning tasks (Chapman, 2005). A popular way to
develop standards is by using the 5Ms, which is an idea borrowed
from Kaoru Ishikawa’s fishbone diagram (Refer Appendix A6
also)(Patten, 2006). The five Ms are:
I. Manpower
16
III. Materials
IV. Machines
V. Measurements
7. Shitsuke (Sustain) – This activity involves disciplining the
employees involved to maintain the achievements of the first 4Ss.
There is a need for constant motivation and a focus on continuous
improvement (Imai, 1986). The word, Shitsuke, originally comes
from the textile industry and refers to the tacking (guiding stitches)
used for the proper sewing of garments (Ho, 1999). The challenge
in implementing 5S is to do something even though it is known to
be difficult, rather than conduct periodic audits (Patten, 2006).
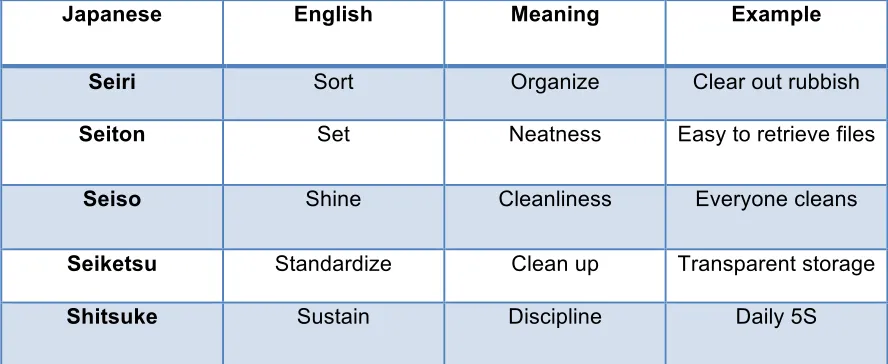
A sample 5S Audit Form is in found in Appendix C1. Table 2 gives the
English translation of the 5S terms and shows some examples of their
17
Table 2. Translation of 5S terms
Japanese English Meaning Example
Seiri Sort Organize Clear out rubbish
Seiton Set Neatness Easy to retrieve files
Seiso Shine Cleanliness Everyone cleans
Seiketsu Standardize Clean up Transparent storage
Shitsuke Sustain Discipline Daily 5S
Value Stream Map (VSM)
A value stream is a series of activities, both value-added and
non-value-added, designed to bring a product from raw material to the finished product
(Renfroe, 2007; Womack, 2006). The term, Value Stream Mapping (VSM) was
introduced in the Lean Enterprise Institute (LEI) workbook, Learning to See in
1998. Lian & Landaghem (2007, p. 3038) have defined VSM as “a mapping
paradigm used to describe the configuration of value streams.” The VSM
technique charts out a map showing how the product flows from start to finish.
Such a chart serves these two purposes:
1. It illustrates the product’s manufacturing life cycle by identifying each
18
2. It is a tool that can help enlighten managers who refuse to believe their
manufacturing techniques are “obese” and to show them the light of
Lean Manufacturing (Lovelle, 2001).
Product Family
A company may have hundreds of different products manufactured. In
cases like this, it is impractical to draw a VSM for each product. In these cases,
the products are grouped into product families. A product family is a group of
products passing through similar steps of manufacturing using similar equipment
within the organization (Womack, 2006).
Once the product family has been identified, the VSM activity can start. It
is important to conduct the VSM in a cross-functional team environment (Lovelle,
2001). A good team size consists of seven to ten people. A team of this size
ensures that there are enough members to walk the shop floor and conduct
interviews. It is not advisable to conduct a VSM with just one person, as there is
not enough cross-functional dialogue, and results may be biased (Manos, 2006).
Once the team has been created, a Kaizen (Japanese for “change for better”)
event begins, ideally for three days.
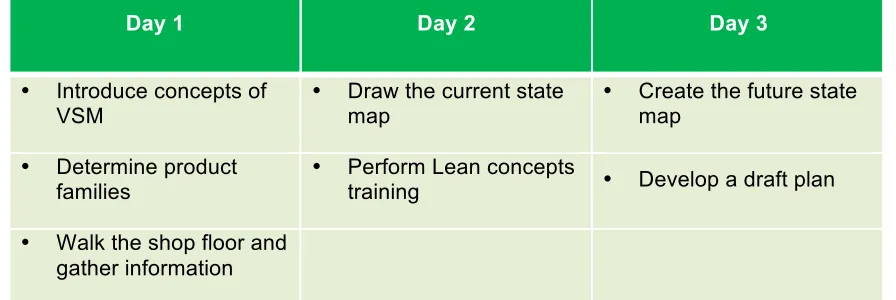
Kaizen Event
The course map for the three-day Kaizen event includes creating a current
state map, a future state map, and a draft plan for the implementation
19
Table 3. Three-Day Kaizen Event Agenda
Day 1 Day 2 Day 3
• Introduce concepts of
VSM •
Draw the current state
map •
Create the future state map
• Determine product
families •
Perform Lean concepts
training • Develop a draft plan
• Walk the shop floor and
gather information
As illustrated in the industry magazine Quality Progress (Manos, 2006),
simple symbols can be used to denote processes such as inventory and flow. A
finished VSM map illustrates where obvious wastes exist. These wastes include
movement of goods, overproduction, rework, or inventory. By studying the map, it
is easy to locate and to address the problem of waste. A list of commonly used
icons are shown in Appendix A3.
Current State Map
The current state depicts how the organization is functioning at present
(Manos, 2006). The team creates the current state map by walking through the
shop floor and collecting data from the operators. It is not advisable to create the
map from the confines of the office. The main objective to drawing the current
state is to determine if each process step satisfies these parameters:
• Valuable: The best way to determine the value of a step is to ask if the
20
• Capable: This parameter analyzes the degree to which the process
produces good quality every time.
• Available: The process must be capable of operating when the need
arises and not suffering from downtime.
• Adequate: Does the process have enough capacity to handle the peak
customer requirements?
• Flexible: The process must be capable of switching from one product
line to the next at a low cost (Womack, 2006).
The overall goal of VSM is to move from a batch-wise production to a
pull-based system where every process downstream has a requirement for the
products manufactured upstream (Lovelle, 2001). A sample current state map is
found in Appendix A4.
An important parameter in the creation of the current state is the takt time
of a process. Takt time is defined as the number of units required by the
customer in units of time (Womack, 2006). Takt is the German word for the baton
used by the conductor of an orchestra to control the speed and timing. Takt time
refers to how frequently a product needs to be manufactured in order to satisfy
customer demand (Manos, 2006).
The formula for Takt Time is shown in Equation (1).
€
Takt time =
Time available (per shift)
Customer demand (per shift)
…(1)21 Future State Map
Lovelle (2001) says that it is critical for a company to develop a future
state map to provide a blueprint for the company to approach its ideal lean state.
The future state indicates the changes required within a department to ensure a
continuous flow and takt time. Establishing a continuous flow and a pull system
ensures a dramatic reduction in throughput time and cost, and a significant
improvement in quality (Womack, 2006). A sample future state map is found in
Appendix A5.
Single-Minute Exchange of Dies (SMED)
Shigeo Shingo is considered the founder of Single-Minute Exchange of
Dies (SMED). He has helped numerous companies understand the importance of
SMED and is the reason behind Toyota’s success with Lean Manufacturing
practices (Shingo, 1983). In 1988, the Utah State University College of Business
established the Shingo Prize to promote Lean Manufacturing awareness and to
recognize companies who achieved world-class manufacturing practices (Richey,
1996). Some of the past recipients of the Shingo Award for Excellence in
Manufacturing (shingoprize.org) include:
• Boeing - Integrated Defense Systems (Defense)
• Autoliv (Airbags)
• The HON Company (Office Furniture)
22
• BAE Systems (Aerospace & Defense)
• Delphi Corporation (Mobile Electronics)
• Lockheed Corporation (Aerospace & Defense)
• Raytheon Missile Systems (Defense)
• Freudenberg - NOK (Elastomeric Seals & Molded Products)
• Johnson Controls (Automotive Supplier & Building Controls)
• O.C. Tanner Company (Employee Recognition Products)
Manufacturing companies, as well as researchers, often use Shingo’s
methodology for conducting SMED. One of the main reasons that companies are
interested in implementing SMED is the growing trend of producing smaller
batches with a larger variety of products (McIntosh et al., 2007). Shingo is an
expert at identifying the difference between value added and non-value added
processes. He describes as value added only as those processes converting or
transforming a product towards the customer’s needs and wants (The SMED
System For Reducing Changeover Times, 1988).
While printers often argue that their industry does not deal with dies
(Cooper et al., 2007), they would do well to consider a similar approach.
Especially with today’s hectic schedules and competitive environment, SMED
has assumed a larger importance. According to Peter Witzig, the Product
Manager for the Folding Carton Division of Bobst Group USA Inc., it is just as
important to use the right kind of tooling as it is to distinguish internal from
external activities (Witzig, 2006). SMED in the printing industry can include quick
23
The idea behind SMED is to reduce the two kinds of make-ready times
required to set up the press between jobs:
1. Internal Setup, which can be performed when the machine is not
running. This includes plate changing, blanket washing, and anilox
roller cleaning.
2. External Setup, which refers to stations that can be setup while the
machine is running. These include plate making, ink mixing, and
offline cleaning (Shingo, 1985; Leschke, 1997).
SMED has been known to work very well, with most printing companies
trying it reporting significant reductions in make-ready times. SMED can also be
applied to the binding areas (Renfroe, 2007).
Stages of SMED
There are three important stages in the implementation of SMED in any
industry:
1. Separating internal and external activities. This is the most
important step in the implementation of SMED because it helps
filter out the internal activities that actually need to be addressed.
This step also helps the workers understand that time is wasted
24
2. Converting internal to external setup. This involves a two-step
process in which:
a. The existing processes are analyzed to identify if any
external processes are wrongly being considered as internal,
and
b. Internal processes are studied in an attempt to convert them
to external processes.
3. Streamlining all aspects of the changeover. Finally, after the
internal activities have been identified, it is important to streamline
them to reduce the time the machine is not producing. For example,
Toyota managed to reduce the time taken for setting up their
bolt-maker from eight hours to fifty-eight seconds (Shingo, 1983),
Difficulty in Implementing Lean Manufacturing
In the J. Kenny article (2007), Tom Southworth of Southworth Consulting
pointed out that label printers have embraced Lean Manufacturing easier than
have other types of printers because of their large order sizes, quick turnarounds,
and frequent die changes. He says that most companies only “dabble with” the
concept of Lean management. Southworth refers to these people as Citizens
Against Virtually Everything (CAVEs).
25
1. Lean can only be successful after a company has addressed both the
organizational, as well as the technical, aspects of quality management.
2. Individuals fail to see the increased opportunities for participation and
autonomy, and end up feeling insecure.
3. The management often feels the employees should be disclosed
information only on a “need to know basis” (Lathin & Mitchell, 2001).
4. Companies are inclined to implement only selective aspects of the TPS.
To be successful, a company needs to put the entire system in place.
5. A company must be willing to stop what they are doing, analyze what is
not working, and accept that it is not working.
6. Employees need to feel encouraged and motivated when they contribute.
7. Managers have to be completely involved in the process of
implementation, training, motivation, and engaging the employees
(Hassler, 2008).
Implementing Lean within Printing Companies
The following are some companies who have undertaken Lean programs
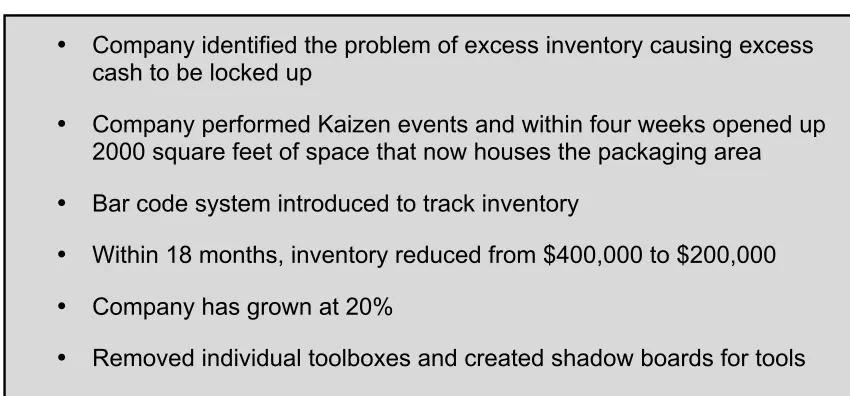
26 Luminer Converting, Lakewood, NJ
Luminer Converting is a part of the Luminer group and is an ISO-9001
certified printing and converting company specializing in high-quality labels and
promotional materials.
According to President Tom Spina (2007) this business had too much
inventory and too much cash outlay, and not enough money was being spent on
other things. The company attacked the inventory problem aggressively and
within four weeks, they removed four 30-foot dumpsters of waste materials. This
exercise opened up 2,000 square feet of floor space that eventually ended up
housing the packaging area. A bar code system was introduced to track the
inventory, so now every item can be traced on a computer.
The result of these exercises was large cash savings to the company. It
now pays its suppliers within 10 days; hence, they are eligible for discounts. In a
matter of 18 months, the inventory was reduced from $400,000 to less than
$200,000, which has allowed the company to grow 20%.
The company then focused on the press shop floor and removed
everybody’s toolboxes. All tools were mounted on a wooden board and labeled.
27
Table 4. Summary of Luminer Converting
Associates Graphics Services (AGS) Wilmington, DE
The 50,000 square foot plant of this commercial printer has been designed
to provide maximum flow and to streamline the flow of materials through the
plant. According to the Production Manager Bryan Taylor (2006), the facility was
designed to streamline the flow of jobs through it. Each press has a cutter and a
folder within a few steps, providing a direct flow of the work.
AGS designed a dual workflow system that helps monitor the
work-in-process materials. This system has increased productivity by more than 30%.
The company also gathers data regarding three important factors, including
press uptime, on-time percentages for jobs and estimates, and on-time
percentages for proofs.
• Company identified the problem of excess inventory causing excess
cash to be locked up
• Company performed Kaizen events and within four weeks opened up
2000 square feet of space that now houses the packaging area
• Bar code system introduced to track inventory
• Within 18 months, inventory reduced from $400,000 to $200,000
• Company has grown at 20%
28
As shown in Table 5, by practicing Lean, AGS has not only eliminated
wastes, but also improved the company’s quality, productivity, and sales
(O’Brien, 2006).
Table 5. Summary of Associates Graphics Services
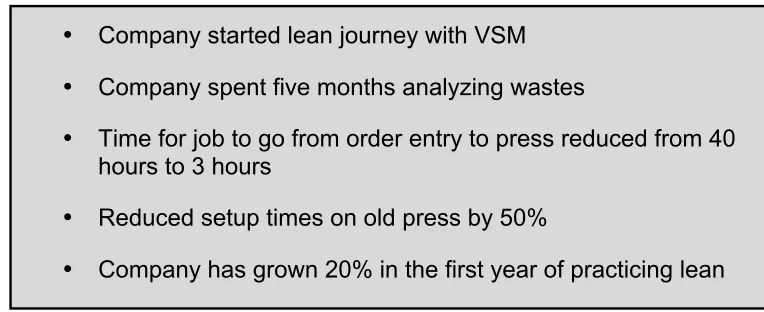
Tailored Label Products, Menomonee Falls, WI
Tailored Label Products started out their Lean program by creating a VSM
to accelerate order entry and to streamline the front-end processes. The
company spent five months analyzing wastes and identifying potential
bottlenecks. They measured the distance that a person needed to walk from one
workstation to another, the position of equipment, and the inventory. They also
computerized many manual processes. They also categorized their job orders
into groups so they would have a clearly defined method for each product.
The company grew 20% in the first year of practicing the Lean system. An
order typically taking close to 40 hours to process -- from the time the order was
placed to the time it was loaded onto the press -- now took only 3 to 4 hours.
According to the President of Tailored Label Products, Mike Erwin, VSM helped
• Factory designed to streamline flow and remove bottlenecks
• Company has created smaller manufacturing cells
• Dual workflow system that helps monitor work in process has increased
29
the company tremendously. Table 6 illustrates the company’s activities and
benefits.
The company had an old press that required extensive time for make-
ready and cleaning. Using VSM, they charted out the different wastes, such as
color-to-color wastes, idle time, and lost time between shifts. This helped them
[image:41.612.121.503.311.467.2]reduce setup times by half (Kenny, 2007).
Table 6. Summary of Tailored Label Products
A1 Paper Stationery
The group Managing Director, Tom Jones, kick started the Lean
Manufacturing program in 2005 with a two-day program. In the following year, the
company conducted two five-day programs. The main goals of these workshops
were to increase solid hours and to improve machine efficiencies.
The programs had the complete involvement of the production staff. Six
people participated in every program, and the remaining people were briefed on
• Company started lean journey with VSM
• Company spent five months analyzing wastes
• Time for job to go from order entry to press reduced from 40
hours to 3 hours
• Reduced setup times on old press by 50%
30
the events with presentations. One project was to reduce the make-ready of a
press using video. A Gantt chart containing about 150 operations was drawn,
and the manufacturing staff analyzed the diagrams. As a result of this exercise,
the make-ready time was reduced by 40%.
Jones feels that, as a result of these workshops, better engineering and
maintenance programs have been initiated, and the company has “learned a lot
of things that were not directly related to the program” (Ross, 2006). Table 7
illustrates the company’s activities and benefits.
Table 7. Summary of A1 Stationery Products
• Company started on lean to improve machine efficiencies
• Team of six people involved; all others constantly briefed on progress
• Video of press changeover was captured
• Gantt chart created analyzing 150 different activities performed
31
Summary of Setup Reduction Performed in Printing Companies
Various printing companies have tried to adopt Lean Manufacturing, but a
select few have been more successful than others in implementing quick
changeovers.
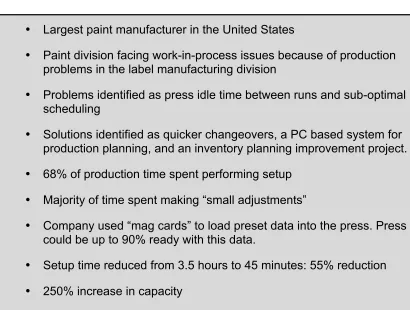
Graphic Arts Division, Fountain Inn, SC
Graphic Arts Division is the label manufacturing division of
Sherwin-Williams, the largest paint manufacturer in the United States, based in of
Cleveland, OH. The paint company was having considerable inventories of
Work-in-Process jobs because the label division was facing delays in production. The
problem did not lie with a lack of capacity at the printing division; rather it was a
combination of press-idle time between runs and sub-optimal scheduling.
Management decided to implement a three-pronged “get well” program that
involved quicker changeovers, a PC-based system for production planning, and
an inventory planning improvement project.
The quick changeover project realized that the most immediate
improvements. When the problem was analyzed, the team realized that 68% of
production time was spent performing setups. The team videotaped changeovers
and separated internal activities from the external ones. They realized that the
largest delays occurred in performing the small adjustments required to run the
job, such as ink and paper adjustments. The company solved this with the help of
32
press would be up to 90% close to ready, with only minor adjustments needed.
The company managed to reduce the average daily setup times from 3.5 hours
to 45 minutes -- a 55% reduction. This reduction also resulted in a 250%
increase in effective capacity. Table 8 illustrates the company’s activities and
[image:44.612.121.531.301.611.2]benefits.
Table 8. Summary of Graphic Arts Division
• Largest paint manufacturer in the United States
• Paint division facing work-in-process issues because of production
problems in the label manufacturing division
• Problems identified as press idle time between runs and sub-optimal
scheduling
• Solutions identified as quicker changeovers, a PC based system for
production planning, and an inventory planning improvement project.
• 68% of production time spent performing setup
• Majority of time spent making “small adjustments”
• Company used “mag cards” to load preset data into the press. Press
could be up to 90% ready with this data.
• Setup time reduced from 3.5 hours to 45 minutes: 55% reduction
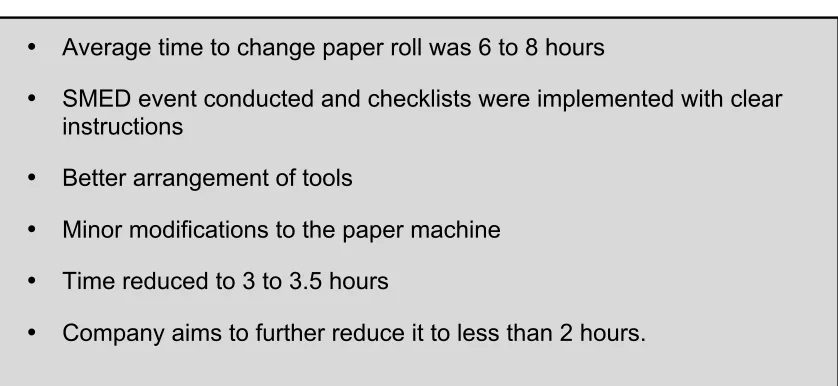
33 Kappa Kraftliner AB, Sweden
The employees at this Swedish paper mill used to take between 6 to 8
hours to change a paper roll on the paper machine. A SMED event was
conducted. Results of the event showed that waiting, which was viewed as a part
of the process, caused many of the delays. Measures taken as a result of the
analysis included checklists (which provided clear instructions to the operators)
better arrangement of work tools, and minor modifications to the paper machine.
As a result, the time taken to change the roll was reduced to 3 to 3.5 hours. The
aim is to reduce it to less than 2 hours (Lundberg, 2002). Table 9 illustrates the
[image:45.612.121.540.425.618.2]company’s activities and benefits.
Table 9. Summary of Kappa Kraftliner
• Average time to change paper roll was 6 to 8 hours
• SMED event conducted and checklists were implemented with clear
instructions
• Better arrangement of tools
• Minor modifications to the paper machine
• Time reduced to 3 to 3.5 hours
34
Summary of Setup Reduction Performed by Print Equipment Manufacturers
Print equipment manufacturers have found the need to perform SMED in
the manufacturing of their products, as well as in the engineering of their
products. The purpose of performing SMED is to be quick changeover-friendly so
that customers can reap the maximum benefits from purchasing their equipment.
Paper Converting Machine Corporation, USA
Paper Converting Machine Corporation (PCMC) introduced software
known as, PrintReady, in their 1m wide, eight- color VisionG Flexographic
printing press. This software helps the press achieve a safe, tool-free
changeover in less than 60 minutes. The press is designed to eliminate waste
and to provide energy efficiency. It is a gearless, low- maintenance design,
offering a compact footprint, and is CE certified. The press is able to remember
impression cylinder settings and sets them automatically, thereby saving up to
EUR100,000 annually (Less Than One Hour, 2008). Table 10 illustrates the
35
Table 10. Summary of PCMC
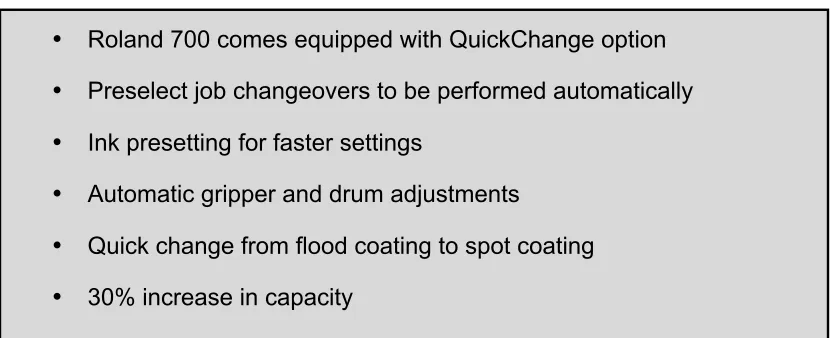
MAN Roland, USA
The Roland 700 press from MAN Roland comes equipped with
QuickChange options, which help reduce changeover time, thereby resulting in a
30% increase in capacity. The QuickChange feature enables job changeovers to
be pre-selected at the central console and to be performed automatically. As
shown in Table 11, its features include:
1. Ink pre-settings that ensure faster settings for subsequent jobs
2. Automatic transfer gripper and infeed drum adjustments for
substrates of different thicknesses
3. A setting for printers that need to often change from flood coating to
spot coating (More Capacity with Quick Change, 2006)
• New software called PrintReady that can help achieve quick
changeover in less than 60 minutes
• Press designed to eliminate waste and increase energy efficiency
• Press remembers impression cylinder settings and sets
automatically
36
Table 11. Summary of MAN Roland
Valmet Rotomec, Italy
With the CI 401 ES, Valmet Rotomec introduced a central impression
flexo press, offering an eight-color full-color changeover in just 15 minutes. It is a
driveless press that also features electronic shaft, online sleeve changing, and
automatic wash down systems, in addition to an automatic register control. The
press has also been fitted with a heavy duty dryer to improve drying performance
by 50% over other flexo presses (Valmet Introduces Rapid Change Over Flexo
Press, 2001). Table 12 illustrates the company’s activities and benefits.
• Roland 700 comes equipped with QuickChange option
• Preselect job changeovers to be performed automatically
• Ink presetting for faster settings
• Automatic gripper and drum adjustments
• Quick change from flood coating to spot coating
37
Table 12. Summary of Valmet Rotomec
Summary of Setup Reduction Performed by Non-Printing Equipment
Manufacturers
Lean Manufacturing concepts, including quick changeovers and SMED
have been gaining popularity in the manufacturing industries. A few non-printing
manufacturing companies where SMED principles have been successfully
implemented are reviewed here.
Manufacturer of Precision Engineered Tubing; North Branch, NJ
The facility features high-precision forming/welding that transforms
flat-coiled material into tubes. The company identified the need to reduce length mill
changeover times. All changeovers require modifying at least something on the
mill, while some changeovers require changing everything. A SMED team was
formed, consisting of machine operators and assistants, mechanics, engineers,
• New Central Impression (CI) eight color flexo press
• Changeover possible in 15 minutes
• Driveless press with electronic shaft, online sleeve changing, and
automatic washdown system
38
and managers concerned with the mill. Care was taken to include
representatives from every shift.
The first initiative was to isolate the “external” activities -- those that could
be performed prior to the machine stopping for the changeover. The team agreed
on preparing a SMED cart that would house all the tools required for the
changeover, so that the operators would not have to waste time on motion and
looking for tools. An order was created in which the activities must be performed.
The team discovered many of the activities could be performed in “parallel” (i.e.,
independent of another activity).
The changeover, which had previously taken 30 hours, was completed in
3.5 hours. Although additional people were used for the changeover, they were
not required for the entire changeover. In all, the four people completed the task
in 1.5 hours. The savings was 18.5 hours (Chaneski, 2008). Table 13 illustrates
39
Table 13. Summary of Precision Tubing Manufacturer
Ingersoll Cutting Tool Co. (ICTC); Rockford, IL
The company makes a wide range of indexable cutting tools and inserts.
With over 5000 different inserts manufactured on 15 different machines, there
were potentially over 75,000 different changeovers possible. Analyzing each of
these changeovers was virtually impossible. Instead, the products were grouped
into 60 product families.
The external consultants who were working with the company realized
that, in addition to reducing setup time, the company also needed to produce in
smaller lot sizes in order to receive the full impact of quick changeovers. Their
recommendation was to reduce the lot sizes from 10,000 to 500. Management
was given a proposal that asked for an investment of $20,000 to reduce setup
• Need to reduce length mill changeover times
• Cross functional SMED team formed; included representation from
all three shifts
• External activities identified and isolated
• SMED cart created housing all the tools used for changeover
• Parallel activities identified
• Additional people employed for new changeover
• Changeover time reduced from 30 hours to 3.5 hours
40
times by 50%. The reduction in setup times also meant a reduction in overtime
costs to the tune of $280,000 annually. The reduction in lot sizes also meant a
75% reduction in lead times and work-in-process. This improved the company’s
responsiveness to their customers, as well as their market share (Rehman &
[image:52.612.105.542.292.484.2]Diehl, 1993). Table 14 illustrates the company’s activities and benefits.
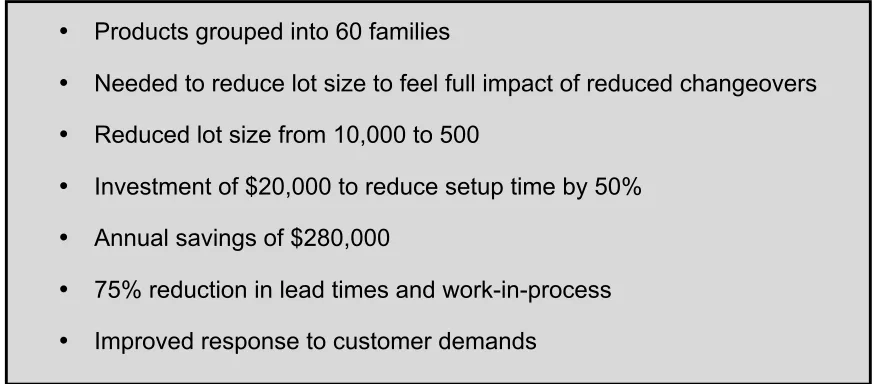
Table 14. Summary of Ingersoll Cutting Inc.
• Products grouped into 60 families
• Needed to reduce lot size to feel full impact of reduced changeovers
• Reduced lot size from 10,000 to 500
• Investment of $20,000 to reduce setup time by 50%
• Annual savings of $280,000
• 75% reduction in lead times and work-in-process
41
Chapter 3
Hypothesis Statements
The hypothesis statements were framed with the intention of verifying if
SMED does in fact help improve the PCE of a process.
Null Hypothesis Ho: Using SMED as a tool of lean does not help improve
the Process Cycle Efficiency (PCE) of changeovers on a web offset
press above 15%
€
PCE
≤
15
Alternate Hypothesis HA: Using SMED as a tool of lean helps improve the
Process Cycle Efficiency (PCE) of changeovers on a web offset press
above 15%
€
PCE > 15
The statistical testing of the null hypothesis will be done using the t-test at
42
Chapter 4
Methodology
The method of study employed was called Action Research. This involved
direct interaction with employees of the organization and required the researcher
to be actively involved in the implementation of projects.
Video Recording the Insert Changes
The filming of the insert changes was done using a Sony Handycam Video
Recorder. The researcher chose a position by the press that provided the best
coverage and the least amount of interference of all the activities that were
performed. The researcher’s intention was to be as inconspicuous as possible,
so as to prevent any interruption in the operator’s functions and to avoid the
operators feeling conscious of being filmed. A total of seven insert changes were
filmed:
• three on the first shift,
• two on the second shift, and
43
Care was taken in labeling the discs to avoid any confusion. The activities
filmed on Side A were mentioned on the front label, and the same was done for
side B. Notes, including the exact time that the insert change started and the time
that it finished, the job number, the number of helpers, and any activity that was
not caught on camera, were recorded in a separate book.
The recording began as soon as the press was stopped for a job and
continued until a sellable item to the customer was produced on the next job.
With the researcher’s intention of bringing the breaks to the attention of the crew,
the camera continued to record when an operator went on break during the insert
change process.
Creating an Excel Spreadsheet
After each insert change was filmed, the researcher reviewed the video
recording and charted the times for each activity. A time study chart was created
in Microsoft Excel XP, listing the time taken for each action and classifying
activities into value-added, non-value added, and non-value added but
necessary.
Value-added activities were defined as those activities the customer would
agree to be charged for. For example, the customer would agree to be charged
for the time taken to remove the old plate and insert the new plate, but not the
44
The non-value added activities were defined as those not necessary to the
insert change process (e.g. searching for tools, walking distances to acquire tools
or materials, etc).
The non-value added but necessary activities involve those activities that
the customer would not be willing to pay for, but are needed in order to perform
the insert change. In the example cited above, the act of undoing and
re-attaching the bolts during a plate change is non-value added but necessary in
order to complete the plate change.
A SMED analysis would help to identify ways to eliminate the non-value
added activities, and to identify ways to reduce the time spent on non-value
added but necessary activities. In turn, these changes would increase the
value-added portion of the entire insert change time and increase the Process Cycle
Efficiency (PCE) that was the parameter of success.
Calculating the Process Cycle Efficiency
The parameter used to calculate the success of the SMED program was
Process Cycle Efficiency (PCE). The PCE is a ratio that indicates the percentage
of time spent performing value-added activities. Equation (2) shows the formula
for calculating the PCE.
€
PCE% =
Value added time
45
Equation 2. Process Cycle Efficiency (PCE)
The objective was to calculate the PCE of the insert changes before the
SMED event and compare them with the PCE values from after the SMED event
to gauge the success of the event.
Calculating the Possible Annual Savings
By identifying the potential areas for time reduction, the researcher was
able to calculate the possible savings to the company as a result of implementing
SMED. The company uses a Management Information System called Globetek in
which the operators are required to record their respective activities on a keypad
and track the time spent on that activity. Based on the reports from the previous
two years (2006-07 and 2007-08) the researcher was able to calculate the total
number of hours spent on insert changes during the entire year. Based on the
machine hourly rate and the estimated reduction in insert change time, the
savings were calculated.
The insert changes prior to conducting SMED were termed as “baseline”
insert changes since they were used as the basis for conducting SMED.
Creating a 5S Team
A 5S event was planned as the first step to improving employee
involvement. The purpose of the 5S event was to encourage team building and to
46
included in the team to provide a fresh perspective. This person also served as
the note-taker and facilitator of the group. The final team was composed of these
seven members:
• Operators from the first and second shifts – 2
• Assistant operator from the third shift – 1
• Manager from the shipping department – 1
• Leads from the second and third shifts – 2
• Process engineer intern (the researcher) – 1
Conducting a 5S Event
By conducting a 5S event, the researcher attempted to ensure proper
accessibility of tools and to improve employee morale. Although the event was
called a 5S event, in reality, the activities were only done targeting these first 3Ss
(i.e., Simplify, Standardize, and Shine). The fourth and fifth Ss (i.e., Standardize
and Sustain) could be possible only after the first 3Ss had been maintained for
three to four weeks at least.
The event was conducted over two working days during the first shift; it
47 Day 1 Sequence of Events
2. A two-hour orientation and training on 5S and workplace visual
management took place.
3. A one-hour “Gemba” (Japanese for shop floor/workplace) walk involved
the team walking together through the workplace and taking pictures of
areas that required improvement.
4. The team returned to the meeting room and analyzed the pictures. The
team brainstormed to find solutions to the problems that were caught on
camera.
5. Sub-teams of two were created within the group, and different tasks were
assigned to different groups. The sub-teams identified the time it would
take to complete each of the sub-tasks within the eight hours that the
press was scheduled to be down.
6. Once the pictures were analyzed and tasks assigned, the team filled out a
“Pre-5S event audit sheet.” This audit sheet was the form that had been
used by the company in previous years; it had been compiled from a
variety of lean manufacturing books and websites. As mentioned earlier,
the activities targeted were only the first 3Ss; therefore, the pre-audit
48
7. The 5S team discussed each of the items on the audit sheet and decided
on scores as a team. A score of 5 for an item meant the item had no
violations, and a score of 0 meant the most violations. The maximum
score possible was 90.
8. The goal was set to double the initial audit score.
9. A wooden pallet was placed on the floor; any item that was not nailed
down onto the press was removed from its place and placed on the pallet.
10. The team took back only items that they had identified a permanent place
for. This exercise eliminated multiples of an item; in addition, it cleared
space.
11. Team 1 was assigned with the physical cleaning of the press and the
walls. Team 2 was assigned with labeling all the items that were on and
off the press. Team 3 was assigned the task of finding a permanent spot
for everything and to clearly demarcate the spot with marking tape/paint;
this included creating a shadow board of the tools used during the insert
change and the clear labeling of tools (see Appendix C4).
Day 2 Sequence of Events
1. Teams continued with their tasks from the previous day.
49
3. The teams did another walk of the Gemba and took pictures of the
improved workspace.
4. The teams gathered again in the meeting room and analyzed the new
pictures and discussed the improvements.
5. Tasks that could not be completed were re-visited and a 30-60-90 day
plan was created depending on the time needed to complete the
unfinished tasks
6. The teams discussed for an hour and drew out a housekeeping checklist
that would be used to maintain the workspace. Weekly audits would
evaluate the condition of the workspace
7. A team picture was taken with all the individuals who participated, and a
poster was created. This poster (refer Appendix B1) had a picture of the
team, the before- and after-pictures from the 5S event, notes highlighting
the achievement of the teams, and the two audit forms. This poster was
placed at the side of the press.
Once the 5S event was concluded, a different team was put together to
form a SMED team. The reasoning behind choosing a different team was to get
50
Creating a SMED Team
The researcher created a SMED team with help from the Manager for
Continuous Improvement and the Manager of the Offset Department. The
individuals were selected based on their level of enthusiasm and dedication, as
well as their ability to influence the decision-making of others around them. A
non-offset person was included in the team, as well, to provide a fresh
perspective. This person also served as the note-taker and facilitator of the
group. The SMED final team was composed of eight members:
• One operator from the first, second, and third shifts - 3
• Leads from the first shift - 1
• Operator from the Pre-press Department – 1
• Offset Department Manager – 1
• In-house Senior Process Engineer - 1
• Process engineer intern (the researcher) –1
In addition, the team was assigned a mentor who was the “lean champion”
of the organization. Although the mentor was not involved in each individual
project, he would provide the basic training