Rochester Institute of Technology
RIT Scholar Works
Theses
Thesis/Dissertation Collections
11-1-1999
Quantitation of yohimbine utilizing capillary
electrophoresis. Method development through
statistical design.
Jonathan Cooper
Follow this and additional works at:
http://scholarworks.rit.edu/theses
This Thesis is brought to you for free and open access by the Thesis/Dissertation Collections at RIT Scholar Works. It has been accepted for inclusion in Theses by an authorized administrator of RIT Scholar Works. For more information, please contactritscholarworks@rit.edu.
Recommended Citation
Quantitation
of Yohimbine
Utilizing Capillary Electrophoresis.
Method Development through Statistical Design.
Jonathan W. Cooper
Novembe~,
1999
Thesis
SUBMITTED IN PARTIAL FULFILLMENT OF THE REQUIREMENTS FOR THE
DEGREE OF MASTER OF SCIENCE
APPROVED:
Paul A. Craig
Project Advisor
G. A.
Takacs
Department Head
Rochester Institute of Technology
Rochester, New York 14623
Copyright Release Fonn
QUANTITATION OF YOHIMBINE UTILIZING CAPILLARY ELECTROPHORESIS.
METHOD DEVELOPMENT THROUGH STATISTICAL DESIGN.
I, Jonathan William Cooper, hereby grant pennission to the Wallace Library of the
Rochester Institute of Technology to reproduce my thesis in whole or in part. Any
reproduction will not be for commercial use or profit.
Date:
Iz/1/9~
I
ACKNOWLEDGEMENTS.
Iwould
like
to thank myadvisor, Dr. PaulCraig,
withoutwhomthis researchwould nothave been
possible. His continuing support and suggestion were essential towardsdriving
this project to completion, andhis faith in
my abilities allowed me to begin todiscoverand
develop
myownprofessionalinterests.
Many
thanks toDr. Carol Marchettifor
her
contributions to the statistical aspects of this study. Her enthusiasm andmotivation
helped
to turn a seeminglyimposing
statistical tool into aninteresting
andbeneficial
challenge, onethatIhopeothers willfollow my footstepstoward. Iwould alsolike
to extend my gratitude to JamesWesley
forhelping
direct the path of thisinvestigation,
and Dr. T. C. Morrill for his guidanceduring
my graduate career. I thankthe Rochester Institute of
Technology
Department ofChemistry
for
giving me theopportunity to earn this
degree,
as well as providing me with a solid educationalfoundation fromwhichIcanexpand.
I thankmy
family
for
theirunconditional love and understanding. These pastfew
yearshave
been challengingfor
all of usin
ways otherthan academic,but
somehow wehave
been able to maintain and even
develop
our unique relationships. As I complete thisproject and
look
toward thefuture,
there are alarge
number of uncertainties that I willACKNOWLEDGEMENTS.
I would
like
to thankmy advisor, Dr. PaulCraig,
without whomthis research would nothave been
possible. His continuing support and suggestion were essential towardsdriving
this project to completion, andhis faith
in my abilities allowed me to begin todiscover
anddevelop
myown professionalinterests.Many
thankstoDr. Carol Marchettifor
her contributions to the statistical aspects of this study. Her enthusiasm andmotivation
helped
to turn a seeminglyimposing
statistical toolinto
aninteresting
andbeneficialchallenge,onethatI hopeotherswillfollow my
footsteps
toward. Iwould alsolike
to extend my gratitude to JamesWesley
forhelping
direct the path of thisinvestigation,
andDr. T. C. Morrill for his guidanceduring
my graduate career. I thankthe Rochester Institute of
Technology
Department ofChemistry
for giving me theopportunity to earn this
degree,
as well as providing me with a solid educationalfoundation fromwhichI canexpand.
Ithank my
family
fortheir unconditional love and understanding. These pastfew yearshave
been challengingfor
all of us inways otherthan academic,but
somehow wehave
been able to maintain and even
develop
our unique relationships. As I complete thisproject and
look
towardthefuture,
there are a large number of uncertainties that I willTABLE
OF CONTENTS.
ABSTRACT
iINTRODUCTION
1Yohimbine
Background 1History
ofCapillary
Electrophoresis 4Theory
ofCapillary
Electrophoresis
7Modesof
Capillary
Electrophoresis 10Factorial Experimental Design 13
Summary
19Definitions 20
MATERIALS AND METHODS 23
Reagents 23
Instrumentation 24
Commercially
AvailableProducts 25Methods 27
ExperimentalDesign
27
PreparationofBuffers
for
Capillary
Electrophoresis
32Methodsof
Extraction
35Optimized Extraction
ofCommercial Samples
40Instrumental Methods
41RESULTS 44
Factorial Design
One
(Fractional)
44Factorial Design Two
(Full)
50Optimized Experimental Conditions 54
Commercially
Available Products 55DISCUSSION 59
Factorial Design One
(Fractional)
59FactorialDesign Two
(Full)
69Optimized Experimental Conditions 71
Commercially
Available Products 72Summary
72Future Work 73
REFERENCES 74
FIGURES.
Figure
1.Molecular
structure of yohimbine 2Figure 2. CE Schematic 7
Figure 3.
Capillary
wallinteractions
9Figure 4. Reverse
laminar
flowdiagram
10Figure 5. 'Plug-like'
flow diagram
10Figure 6. Designgeneratorsfor factorial designone 28
Figure 7. Run 13andRun 16
factorial design
one 46Figure 8. Run 2andRun 14factorial designone 47
Figure 9. Maineffects plot
Area(2)
48Figure 1 0. Run 1 5 andRun 1 6 factorial designone
49
Figure 1 1. Run 2 andRun 34
factorial design
one 50Figure 12. Run 5 andRun 7 factorialdesigntwo 52
Figure 13. Run 5 andRun 6 factorial designtwo 53
Figure 14. Run 1 andRun 5 factorial designtwo 54
Figure 15. Yohimbinecalibrationcurve 56
TABLES.
Table 1. 23
factorialexperimental design 14
Table 2. 25 factorialexperimental
design
16Table3. y4 fractionof
25
Table 4. Factor levels
chosenfor factorial design
one 28Table 5. Designmatrix
for factorial
design one 29Table 6. Factor
levels
chosenfor factorial design
two 31Table 7.
Design
matrixfor factorial design
two 31Table 8. Methods
for factorial
designone 42Table
9.Methods for factorial
designtwo 42Table 10. Method forcommercial analysis 43
Table 1 1. Descriptive statistics
for
factorial designone 44Table 12. pvalues of
factorial
designone 45Table 13. Descriptivestatisticsfor factorial designtwo 51
Table 1 4. pvaluesoffactorial designtwo 51
Table 15.
Commercially
availableproducts 55Table 16. Tenextraction conditions 56
ABSTRACT.
In an effort to combat the rising cost of
health
carein
the United Statesby
encouraging preventative and self-care, the
federal
government passed theDietary
Supplement
HealthEducation
Act of1994. This act essentiallyderegulated
the naturalproduct market allowing
herbs,
including
yohimbine, tobe
sold overthe counter withoutundergoing the same strict evaluation as a traditional synthetic
drug
candidate. As thefull
potential ofthesenaturalproductsis
realized,including
possibleharmfulside effects,a need arises
for
theidentification
and quantitation of the active components fromcommercial preparations.
Commercial samples were qualitatively and quantitatively analyzed for
yohimbine utilizing a capillary electrophoretic method optimized through statistical
design.
Calibration curves produced with this method routinely achievedR2
> 0.998.
Method reproducibility (n =
10)
and extraction efficiency (99.8% recovery) weredeterminedtobe sufficient. Itwas shownthata statistical designcould
limit
the amountof experimental runs while providing a significant amount of
information
aboutINTRODUCTION.
Yohimbine Background.
The West African tree
Yohimbe is located
in thelow
altitude,jungle
forestsenveloping southwestern Nigeria.
Growing
from 20 to 50feet
high,
this tall evergreenforest
treehas
glabrous,leathery
leaves
three tofive inches in
length with upcurvinglateral nervesthat
fade
out at the margins. Whiteflowers,
containing winged seeds, arearranged
in
umbel-like clusters attheends oftheshoots(1,
2). Itis
thecompoundsfound
inthe
bark
ofthis tree thathave
historically
drawnattentiontowards theYohimbe.Documentation of the
Bantu-speaking
peopledescribes
yohimbe as anaphrodisiac andstimulant
traditionally
usedduring
mating ritualsthat last upto 15 days.There are several methods ofpreparing yohimbe bark for use (2). A tea
is
preparedby
boiling
yohimbe bark shavings in waterforless
than fourminutes. Heatis
then turneddown,
allowing the brew to simmerfor
an additional 20 minutes. The shavings arestrained,andtheteaissipped onehour beforethedesiredeffects aretoberealized.
A method that leads to the effects in a shorter time after
ingestion involves
extractionofthebarkpowder witha
drinkable
alcohol. Aftera period ofeighthours,
thealcohol
is
strained and evaporated,leaving
a residue that canbe
snuffed or takensubcutaneously. Effects through this method are more pronounced, occurring within
twenty
minutes (2).The bark is reported to contain up to 6% yohimbine
(Figure
1),
along with anumber of similar indole alkaloids
including
yohimbenine,isoyohimbine
H,COOC
QH
[image:14.537.190.348.35.147.2]Yohimbine
Figure 1. Molecularstructure ofYohimbine.
the
form
of thehydrochloride is
also known as quebrachine,isolated
from the SouthAmerican evergreenQuebracho tree
(2, 3)
as well asfrom
Rauwolfia viridisleaves
(4),
Rauwolfia caffra root bark and seeds
(5),
Rauwolfia serpentina root(6),
Rauwolfiaoreogiton root
(7),
Rauwolfia volkensii root(7),
Rauwolfia vomitoria root(8),
andRauwolfiayunnanensis(9).
Yohimbine is the most
interesting
alkaloidfrom
these sources,having
gainednotoriety in a number of circles as an alternative medicine treatment. Suggested for
humanuse in
bodybuilding
as an alternative to anabolic steroids(1, 10),
yohimbinehas
been employed in veterinary medicine as an antagonist for anesthesia and sedation of
animals, as well as
for
the treatment of impotent stallions(11,
12). Classified as analpha-2-adrenergic
blocker,
this sympathomimeticindole-type
alkaloid alsodisplays
serotonin
inhibiting
properties(1,2). Inboth
humansand animals,yohimbine produces acomplex patternofresponsesthat includeanti-diuresis and central excitation, comprising
elevation ofblood pressure and
heart
rate, increased motor activity andirritability
(13).
Recent focus
has
beenconcerned withtheaphrodisiacproperties and use of yohimbine asThe marketing of yohimbine
falls
under theDietary
Supplemental HealthEducation
Act(DSHEA)
of1994,
a governmental efforttolimit
the skyrocketing cost ofUnited
States health
care thathas
essentiallyderegulated
the natural product market.Natural
products are not strictly evaluated pre-market as a synthesizeddrug
candidatewould
be,
and tend todraw
scrutiny only when adverse effects are noted as a result ofconsumer use.
Regulatory
action toward another natural product with central nervoussystem stimulant properties, ephedrine, arose only after toxic
levels
were witnessedclinically
(36,
37). These complications may be due to the inherent properties of thesources
from
which these natural products areharvested,
namely vegetation. Alkaloidquantitiesfromtwo
distinct
plantsmay be different from differentregions,quantitiesmaybe different betweentwodistinctplantsinthesameregion, orquantitiesmay
be
differentbetween
two leavesonthesametree. Apreparation of naturalproductsmayin
turnhavevarying concentrations between
batches,
betweenbottles,
and even between pills in thesame
bottle for
this reason. Thisis animportantconsiderationforacompoundthathas
asmall range between a therapeutic dose and toxic
dose,
when product variance couldmeanthedifference between lifeanddeath.
Asthe drawbacksoftheDSHEAareeventuallyrealized and attention
focuses
ondose
reproducibility, qualitative and quantitative characterization of many naturalproducts,
including
yohimbine,will gainimportance. Efforts have thusfar been
reportedtoward the identification and quantification of yohimbine
in
commercial products andbiological fluids utilizing fluorescence
(6),
ultra-violetspectroscopy(UV) (5-8),
infrared
spectroscopy
(IR) (7, 8),
nuclear magneticresonance spectroscopy(NMR)
(8),
thin-layermass spectroscopy
(GC/MS)
(8, 13),
gas-liquid chromatography(GLC)
(5),
liquid
chromatography
(LC)
(40),
andhigh-performance
liquid
chromatography(HPLC)
(6, 13,
39-44). There
have been
no reportedinvestigations
of yohimbine utilizing capillaryelectrophoresis, a technique that
is
swiftly gaining prominence in the analyticallaboratory.
History
ofCapillary
Electrophoresis.Inthe 1930's Arne Tiselius developed the first moving
boundary
electrophoresismethodutilizinganopenU-shapedquartzcolumn. Proteinmixtures in freesolution were
partially resolved as abutting bands detected
by
ultraviolet absorbance (45).However,
this pioneering technique had
drawbacks
that included large sample volumes, and anincomplete separationoftheproteins.
Investigation ofimproved anticonvective media in subsequent
decades directed
the
focus
toward zone electrophoresis. Polyacrylamide gels,developed in
thelate
1960's,
contain stacking and resolving buffer systems that yield native protein andsodium dodecyl sulfate
(SDS)
boundprotein separations (46). Knownas polyacrylamidegel electrophoresis
(PAGE)
andSDS-PAGE,
these techniques continue to givehigh-resolution separationsasimportanttoolsin biochemical characterization.
Around the time PAGE was designed to separate proteins on the
basis
of chargeor size, an investigation was underway to
develop
a separationbased
on proteinisoelectric points. Isoelectric
focusing (IEF)
employs a gel containing animmobilized
deprotonated
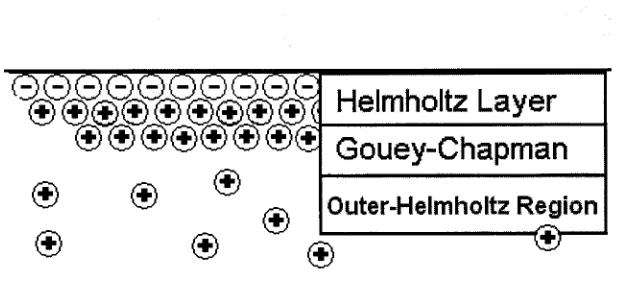
(50). Hydratedbuffer
cations coordinateto the anions atthe capillary wallto
form
the rigidHelmholtz
layer,
and the mobile Gouey-Chapmanlayer
to completeelectroneutrality
(Figure
3). Adrop
in
negative potential, describedby
the zetapotential,characterizes the Gouey-Chapman
layer:
the magnitude of wall negative charge isdirectly
proportionaltolayer
thickness. Whilethisregion extendsonlyafewnanometersbeyond
the Helmholtzlayer,
itis
the mobile cations contained within that generatebulkelectroosmotic
flow.
Mobile hydratedcationsoutnumbermobileanionsinthis area,Helmholtz Layer
|
Gouey-Chapman
Outer-Helmholtz
Region
Figure3. Interactionsatthecapillarywallthatfuelelectroosmotic
flow. Notshown:hydratedanionsinthediffuse layer (Outer-Helmholtzregion).
resulting in a net
flow
toward the cathode under an applied voltage.Immediately
uponthe application of voltage, cations in this layer will have a greater velocity then the
remainderofthe capillary cross section. The resultantflow profile may
have
a paraboliccharacter asthe electrophoretic mobility ofcations inthe
diffuse
portion ofthe capillaryare partially shielded
by
coordinated mobile anions with an opposite pe.This
phenomenon would appear similartoalaminar
flow
profiletowards the anode,but in fact
[image:17.537.105.415.262.405.2]'plug-}
Figure 4. Reverse laminar flowdiagram
like'
flow is
obtained at any cross sectional areabeyond
the Helmholtz plane, as thispulling force
is
uniformforthelengthofthecapillary. Cationflow
nearthecapillarywallinside
the rigid Helmholtz layer approaches zero, resulting in the accepted depiction ofelectrically driven flow (Figure 5).
r
]
p.
+|
>
h
T_
, ,:- *
Figure 5.'Plug-like'electroosmoticflow
Modesof
Capillary
Electrophoresis.The term capillary electrophoresis describes the
family
of separation techniquesbased
onthe mobility differences of charged species under an applied voltage.Mention
shouldbe givento the variations onthis empirical analytical technique that
have
gained [image:18.537.113.424.402.476.2]popularity toward specialized analysis. A summary of the notable techniques and
applications
follows.
Capillary
ZoneElectrophoresis
(CZE).Capillary
zone electrophoresisis
theelectrophoretic separation ofions
inabuffer
solution under an applied voltage.
Micellar Kinetic
Capillary Chromatography
(MEKC).Upon the addition of anionic surfactant molecules above a critical micelle
concentration
(CMC),
hydrophobic
tails ofthese molecules coordinate, exposing theirhydrophilic heads and assuming a spherical shape characteristic of a micelle. These
micelles
have
a ue toward the anode. Analytes inthiselectrophoretic system are furtherresolved on the basis of
hydrophobicity
asinteraction
with the micellesdelays
theobservedmigration.
Capillary
Gel Electrophoresis (CGE).The capillary
is
loadedwith agel, such as polyacrylamide, commonly employedin
PAGE. Analytes are then separated based on charge to size ratio under an appliedvoltage. This technique
has
a high resolving powerfor
proteins, peptides, and aminoacids.
Capillary
IsoelectricFocusing
(CIEF).
An electrolyte
containing
a mixture of ampholytes and sampleis
loaded onto thecolumn.
When
voltageis
applied, the ampholytes migrate to form a continuous pHgradient
in
thecapillary.Analytes
migrateto thelocationoncapillarythatcorrespondstotheir pi. Thevoltageisremoved, and capillarycontentsare elutedpastthedetectorunder
an applied pressure.
Capillary
Isotachophoresis (CITP).This
is
a movingboundary
electrophoretic technique. The sample plugis
introduced after a
leading
electrolyte with mobility faster than the fastest analyte, andbefore a
terminating
electrolyte of slowermobility than the slowest analyte. Compoundsare resolved withinthe sampleplugasitmigratestowardthedetectionwindow.
Capillary
Electrochromatography
(CEC).CEC is acapillaryelectrophoretic techniqueutilizing acapillary packed with one
ofanynumber ofstationaryphases used in HPLC. This technique can employpressure,
voltage, oracombinationofthe two asthe
driving
separationforce. This isuseful intheseparation ofcharged analytes that differ
in hydrophobicity.
Theinvestigation
ofthistechnique has aided
in
the advancement ofmicro-HPLC systems, as pumptechnology
advances.
Factorial Experimental Design.
Recently,
statistical experimentaldesigns have been
increasingly
employed as auseful option
in
analytical methoddevelopment.
A factorial designis
equipped toaddress several major experimental concerns
for
which the traditional One Factor at aTime
(OFAAT)
trialand errordevelopment
techniqueis
not suited(52).Jointeffects or
interactions
aretheeffectthat the simultaneous variationoftwo ormore experimental parameters will
have
on response. These effects can only beidentified and studied
by
the correlative change ofthe selectedfactors.
The OFAATmethod
involves
systematically optimizing one experimental variable, whileholding
allother variables constant. The method is then optimized for a second variable, again
keeping
all other variables constant. Subsequent variables are investigated in the samemanner. To evaluatejointeffects withthis
design,
it is necessary to reevaluate variableoneupon optimizationofvariable
two,
then thereevaluation of variabletwowithchangesin variable one, eventually moving through all variables
in
this systematic approach.Clearly,
the number of experimental runs would quicklybecome
exhausting as thenumber ofinvestigatedvariablesincreased.
A factorial experimental design allows for the systematic
investigation
ofjoint
effects
by
enablingastatisticalanalysistointerpretthesignificanceoffactor
levels,
whilelimiting
the number ofexperimental runs needed. Thisdesign
is useful when expense,quantityofmaterialortimeare
limited,
as experimentnumbers aresignificantlyreduced.There are several software programs that are capable of
handling
the complexcalculations to analyze data from a factorial
design,
but it is useful to understandhow
thesevaluesarecomputedtoemploythis technique.
development
ofthe methodfor synthesizing
ampholyte mixturesfor
high-resolution IEFin
1969,
still a separationtechniquefound
inthemodernbiochemistry laboratory
(47).O'Farrell
combinedIEFwithSDS-PAGE in
the1970's,
creatingtwo-dimensionalelectrophoresis, a technique capable of resolving more than 50 components in each
direction.
Utilizing
anisoelectric
point separation followedby
an electrophoreticseparation
in
the perpendiculardirection,
several thousand compounds canbe
isolatedwiththis approach(48).
During
thelate
1970's,
thefamily
of gel electrophoretic techniques gainedacceptancein
biochemistry
laboratories,
openingdoors
for investigationofprotein-basedbiopharmaceuticals.
Meanwhile,
high performanceliquid
chromatography(HPLC)
wasgaining notoriety as an analytical tool in pharmaceutical and chemical laboratories.
Along
withhighresolution, HPLC offeredease ofautomation,andexcellent quantitativeprecision for the determination of low molecular weight compounds and
industrial
polymers (49). As gel techniques were applied in an industrial setting, their detection
limitations and inherent
lengthy,
involved
preparation proceduresdid
not comparefavorably
to the swift and reliable chromatographic techniques employed at the time.This prompted pharmaceutical and bioanalytical chemists in these
fields
to turn theirattentionto HPLC for biomolecule characterization as protein, peptide, and nucleic acid
chromatographic mediabecame available
during
theearly1980's,
(50).
A strong environmental awareness movement occurred in the
1980's
as thebiotechnology
field broadened. Thisinvolved
a chain of events effectivelyincreasing
waste disposalcosts. Amain analyticaltoolatthis
time,
HPLC,
routinelygenerateslarge
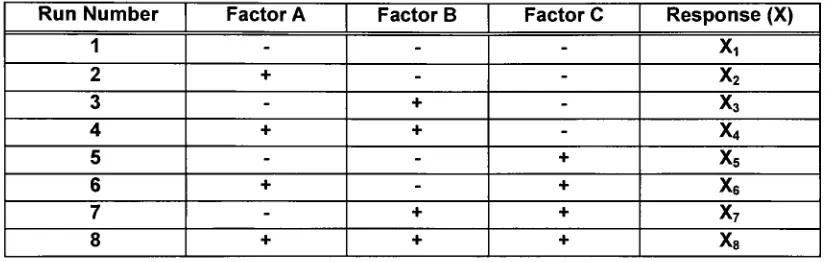
Consider
the case of afull
factorial
2k= 23
design:
variation ofthree
factors (k
=3)
at twolevels.
For example; the effect oftemperature (factor A:25,
37),
pressure(factor B: 1 atm, 3 atm), and wavelength(factor C: 300 nm, 500 nm) on photosynthesis
by
a newlydiscovered
algae. An experimental run chart is assembled and completed, [image:23.537.55.470.228.359.2]recording theresponse (Table 1). Therearefoursets ofexperimentalruns where factor
Table 1. 23
Factorialexperimentaldesign. Threefactors
(A,B,C)
attwolevels: low(-)
andhigh (+).Run Number Factor A Factor B FactorC Response
(X)
1 - -
-X,
2 + -
-x2
3 - +
-x3
4 + +
-x4
5 - - +
x5
6 + - +
x6
7 - + +
x7
8 + + +
x8
A
is
varied asfactors
B andC remained constant. Runs 1 and2,
where Achanges whileB andC areboth negative:Runs 3 and
4,
where Bis
positive, and C isnegative: Runs 5and
6,
where B is negative and C is positive: Runs 7 and8,
where B and C are bothpositive.
Therefore,
theeffect offactor Acanbe describedthroughEquation 2.Effect A=
((X2-XQ
+(X4-X3)
+(X6-X5)
+(Xg-X?))
4Thenumber generateddescribestheeffectofmoving froma
low
toahigh level
inA,
regardlessofthe levels ofB andC. Thiscalculationcanbe
completedfor
each ofthefactors
employedinafactorial designtodeterminetheireffect(52).
Joint
effects arehandled in
a similar manner. Forthis analysis, thedesign has
twopairs of
data
points with a variation ofA;
one atthehigh
level ofB,
the other at the lowlevel,
while C remains constant. Halfofthedifference
ofthese two pairs isthevalue oftheAB
interaction (Equation
3).Effect Aat positiveB=
((X
-X7)
+(Xfi
-Xs))
2Effect AatnegativeB=
((X*
-X,)
+(X,
-X^)
2Effect AB=((Effect A
atpositive
B)
-(Effect Aat negative
B))
32
Scheme 1.
This calculation can be completed for each factor of interest to
determine
themagnitude of joint effects.
Utilizing
computer software in thehandling
of theseequations
dramatically
lowersanalysistimefor
thisas well asalarger
model.Dueto the number offactorsthataffect a separation in
Capillary
Electrophoresis,
a factorial design presents an
interesting
choicefor
athoroughly
systematic methoddevelopment. Separation voltage,
temperature,
buffertype,
buffer pH,buffer ionic
strength, column
length,
organic modifier concentration,injection
type,
andinjection
setpoints are nine relevant factors. To investigate the main and
interaction
effects ofthese ninefactorswitha
full
factorialdesign,
k=9,
and29
or 512 runs would
be
needed.It
is
possibletolowerthis number, utilizingafractionalfactorial design
(55,
56).Fractional
Factorial Design.
There are several advantages to utilizing a fractional factorial design when the
numbers of experimental variables
in
afactorial
investigation are large. There islittle
loss
ofinformation
whilesignificantly
lowering
the length of experimentation(52,
53).Considerthe
design
of a2s
[image:25.537.72.469.223.690.2]factorial
experiment(Table 2). This investigationwouldTable 2. 2 Factorialdesign.(Fivefactorsattwolevels,centerpoints excluded).
Run Factor A Factor B Factor C Factor D FactorE Response
(X)
1 - - -
-^
2 + - - -
-x2
3 - + - -
-x3
4 + + - -
-X4
5 - - + -
-x5
6 + - + -
-Xe
7 - + + -
-x7
8 + + + -
-X8
9 - - - +
-x9
10 + - - +
-X10
11 - + - +
-X11
12 + + - +
-X12
13 - - + +
-X13
14 + - + +
-X14
15 - + + +
-X15
16 + + + +
-X16
17 - - - - +
X17
18 + - - - +
X-I8
19 - + - - +
X19
20 + + - - +
X20
21 - - + - +
X21
22 + - + - +
X22
23 - + + - +
X23
24 + + + - +
X24
25 - - - + +
X25
26 + - - + +
X26
27 - + - + +
X27
28 + + - + +
X28
29 - - + + +
X29
30 + - + + +
X30
31 - + + + +
X31
32 + + + + +
X32
requirethe collection of
32 data
points.Generating
afractional
factorialdesign
of a%
fraction
ofthis tablewould requireonly8
experimental runs(Scheme2),
witha2(k-s)=2(5-2)=23 =
8
Where
k
-number of
factors
and sis
derived fromtheequation1/4=(l/2)s
Wherethe fraction=1/4.
Scheme 2. Generationof a%fractional factorial designoffive factorsattwolevels(k=
5,s= 2).
minimum ofinformation
loss
duetoconfounding.Any
3(k-s)
factors
are setup inafull
factorial
experiment. It isfirst
necessary to determine design generators (53). Designgenerators represent the products ofmultiplying together a combination ofthe + and
values from these first three columns. It is necessary to utilize s number of unique
generators
for
a fractional factorialdesign;
these generators must not be theproducts ofanyother generator combination(Scheme 3). Thevalues
for
thefourth factor
column areproduced
D =
AC,
E=ABAC * AB=AACB=
CB
Scheme3. Designgeneratorsforfactors DandE. Theimplicit designgeneratorisCB,theunique product ofDE.
by
multiplying the + or - incolumns A andC,
corresponding to the
design
generatorfor
variable D and resulting in a + or . The values
for
thefifth factor
column are thenproduced
by
multiplying
the + or-in
columns A andB,
corresponding todesign
generatorE. Theresult
is
a V*fraction
of a25
[image:27.537.72.466.147.280.2]factorial design
(Table 3).Table 3. Vafractionof a
2s
factorial design.Generators D=
AC,E=AB.
Run Factor A Factor B Factor C Factor D FactorE Response
(X)
1 - - - + +
Xi
2 + - - -
-x2
3 - + - +
-x3
4 + + - - +
x4
5 - - + +
-x5
6 + - + +
-x6
7 - + + - +
x7
8 + + + + +
x8
Therearethree additional quartersthatcanberepresented
by
thedesigngenerators D =-AC andE=
-AB,D =AC and E=-AB, orD
=
-AC andE =AB. The quarter chosento
be
utilizedisarbitrary.It
is
importanttounderstandandaccountfor confoundingfactors.
Ifseveralmeasurementsaremade whentwofactorsare atthelower
level,
and alsowhenthe twofactors
areat ahighlevel,
butnot whenthefactors
are atdifferent
levels,
the effectduetothe individual
factors
cannotbeestimated.Any
information lost inafractional design
canbeattributedto these confounding factors.
Resolutionof afractional factorial
design is determined
as the minimum numberof variables employedinthe design generators, a number thatrelates to the
confounding
offactor interactions. Intheexampleabovefora%
fraction
of a25
design,
theresolution(R)
is
calculated as R= 2. Effectshaving
an orderless
than 2 are not confounded withany othereffect with order
less
thant =Rof
4,
main effects(e
=1)
are not confounded with any othermain effect (t=1)
ortwo-factor
interaction (t = 2).Two-factor interactions (e
=2)
are not confounded with maineffects
but
maybe
confounded with othertwofactor interactions
(53).When approaching a complex analytical technique such as capillary
electrophoresis,
it
may bebeneficial
toutilize afractional factorial designtowardmethoddevelopment,
ruling out a large number ofinfluential factors with a limited amount ofexperiments.
Summary.
At this
time,
there have been no reported studies concerning the usefulness ofcapillary electrophoresis in the qualitative and quantitative analysis ofyohimbine from
eithercommerciallyavailable productsorbiologicalfluids. This paper willdeal withthe
investigation of capillary electrophoresis as an analytical tool for the qualitative and
quantitative analysis of yohimbine in commercially available products. In addition, the
use of a factorial experimental design will be evaluated to
investigate
nine importantfactorsthatinfluencecapillary electrophoresis methoddevelopment.
DEFINITIONS IN CAPILLARY
ELECTROPHORESIS.Area.
Thearea under a peak on an output electropherogram.
Capillary
Effective Length (I).Lengthofthecapillary employedfrom inletto detectorwindow.
Capillary
TotalLength (L).Lengthofthecapillaryemployedfrom inlettooutlet.
Electrophoretic
Mobility
(pe).pe =
q/(6Tcr)r)
Where: q=ion
charge
r\ =
solutionviscosity
r=ionic radius
Electrophoretic
Velocity
(vep).Thisvalue
is
calculatedby dividing
theeffective capillary lengthby
themigrationtime
Joule Heating.
Theresultant
heating
of aconductive mediumupon application of a currentflow.
Field Strength (E).
V L
Where:
V=applied voltage
L =
totalcapillary
length
Migration Time.
Migrationtime
is described
as the amount oftimefor
a compound to travelfrom
the point of
injection
to the point ofdetection in capillary electrophoresis. This value isanalogous to a retention time in liquid chromatography (LC).
However,
separations ofcompounds in CE are a
function
of individual compound mobilities under an appliedvoltage, where LC separations are afunction ofindividual compound
interactions
with astationaryphase.
Resolution(Rs).
Resolution is described as the separationbetween two peaks, andrepresented
by
the equation:
Rs
=0.18Ape(EI)1/2Pern
Symmetry.
Symmetry
is
ameasureof peak shapedeviation
from
aGaussian
curve.Theoretical Plates (N).
Theoreticalplatesarethechromatographicdeterminationofseparation efficiency.
N= iteEI
2D
Where:pe =
Electrophoretic mobility D=Diffusion
coefficient ofthesolute inthebuffersystem
E =Electric Field
I =Column
effectivelength
Zeta Potential (Q.
The zeta potential is a measurement ofthe potential difference between
thecapillarywallandthebuffersolution within.
thiswaste removal.
Renewed
interest
surfaced atthis timefor
thedevelopmentofmicro-bore
columnchromatography in
an effort to reduce solvent waste. The development ofthis technique
theoretically
lowers
experimental costs while maintainingresolution (50).A combination of the positive aspects ofthese techniques are employed in capillary
electrophoresis, which utilizes a charge
based
separationin
a microbore column.Hjerten
described
thefirst
capillary electrophoresis design in 1967 while at theUniversity
ofUppsalain
Sweden (51).Utilizing
1- to 3-mm internal diameter quartzcapillaries coated with methylcellulose, separations ofinorganic
ions,
proteins, nucleicacids, and microorganisms were demonstrated
by
free
zone electrophoresis andlater,
isoelectric
focusing.
Capillary
technology
appearedto be detrimentalto the evolution ofthis
technique,
as variations in optical pathway andlarge
columndiameters
were thelimiting
factors
of performance (50). Gel techniques remained superior for theseapplicationsduetotheavailabilityofthenecessary
technology
atthe time.During
the latterpart ofthe1980's,
theinvestigation ofcapillary electrophoresisadvanced
due
to the useful advantages ofsmall amount of solvent employed and thequalitative precision obtained
in
analysis ofbiopharmaceuticals.
This evolution wasaided
by
thetechnology
found in gas chromatography, in the form of smallinternal
diameter fused silicacapillaries, andfrom advancesin
HPLC,
namelyimproved detector
and autosampler capabilities. CE has since emerged as a technique complimentary to
HPLC that offers reliable, efficient separations
for
several unique applicationsin
thebiotechnology
and biopharmaceuticalfields.
The separation of structural proteins(49,
50),
restrictiondigests
(49, 50),
andPCR products(50)
are only afew
ofthe examplesTheory
ofCapillary
Electrophoresis.
Capillary
electrophoresis(CE)
is
thefamily
ofseparationtechniquesbased
onthemobility
differences
of charged species infree
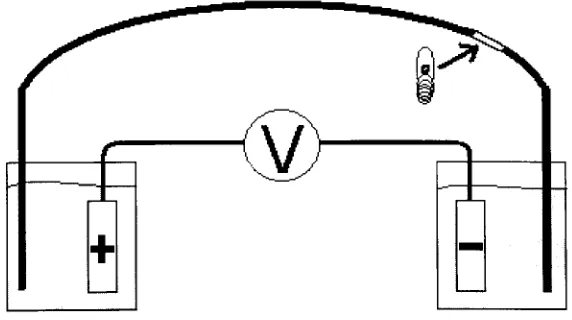
solution under an applied voltage.Typically,
afused
silica capillary with an internal diameter between 25 and 100 um isplaced
between
twobuffer
reservoirs. The capillary is filled withbuffer,
then a highvoltage
is
applied to the electrodes in each buffer reservoir, creating an electricfield
across the length of the capillary (Figure 2). It is within this electric field that a
separation
based
on charge to size ratiosis
afforded. Detection of resolved analytes isachieved on-column througha window on the capillary from whichthe external coating
has been
removed.v;
[image:33.537.117.403.374.534.2]Electrophoretic Mobility.
Electrophoretic
mobility(pe)
is described
asthevelocity that anion
demonstratesunder an applied voltage.
Magnitude
ofmobilityis
afunction
ofseparation buffer pHeffect on analyte charge.
Theoretically,
anions have pe towards the anode, cationshave
Pe toward the cathode, and neutral analytes will
demonstrate
no pe-However,
in thecapillary electrophoretic separation of a mixture of cations, anions, and neutrals, at a
neutral or alkaline pH,peaks characteristic foreach species will
be
seen on theresultantelectropherogram. This result
infers
that regardless ofcharge, each ion will have a netmobility toward the cathode. Thephenomenon that contributes to thispeculiar effect is
called electroosmoticflow (EOF).
GenerationofElectroosmotic Flow.
Electroosmoticflow
(electroosmosis)
(Equation1)
isdescribed
as abulkflow
of= sE
Atu\
Where: s=dielectric constant ofthe
buffer
r| =
viscosityofthe
buffer
,
=zeta potential measuredatthecapillarywall
buffer solution under an applied voltage. This
flow is directed
toward the cathode in abare fused
silicacapillarywhenbufferpHis
abovethree.As buffer pH
is
increased betweenthree and eight, the walls ofthefused
silicacapillary are proportionally
deprotonated,
inferring
a negative charge on oxygen at theMATERIALS AND
METHODS.
Reagents.
Standards.
Standard
Company
CAS# EEC#Yohimbine hydrochloride Sigma 65-19-0 200-600-4
Reserpine Sigma 50-55-5 200-047-9
Eserine
(Physostigmine)
hemisulfatesaltSigma 64-47-1 200-585-4
BufferComponents.
BufferComponent
Company
CAS#o-PhosphoricAcid 85% FisherScientific 7664-38-2
Sodiumphosphate,
monobasic, monohydrate
J.T. Baker 10049-21-5
Sodium phosphate,
dibasic,
anhydrousJ.T. Baker 7758-11-4
Citricacid,anhydrous J.T. Baker 77-92-9
Sodiumdihydrogencitrate anhydrous
Fluka Chemica 18996-35-5
Sodium hydrogencitrate sesquihydrate
Aldrich Chemical 6132-05-4
Methanol J.T. Baker 67-56-1
Capillary
Electrophoresis Reagents.CE Reagent
Company
Part#1.0 N Sodium Hydroxide Solution for HPCE
Hewlett Packard 5062-8576
0.1 N Sodium Hydroxide Solutionfor HPCE
Hewlett Packard 5062-8575
Waterfor HPCE Hewlett Packard 5062-8578
Instrumentation
.Capillary
Electrophoresis
Hewlett
Packard
HP3D-CE,
Model#
G1602A,
Serial#
3546G00733Computer:
Hewlett
Packard Vectra
XMseries3 5/90.Control
Program:Hewlett Packard HP
3D-CE Chemstation.
Revision A.05.04[273]
Labline Environmental Orbital
Shaker.
Rotary
Evaporator:Labconco
Centrivap
Concentrator.Catalog
#
78 1 00-00Labconco Cold Trap.
Catalog
# 781 10-00Fisher Scientific Vacuum Pump. Maxima C Plus. Model M4C.
pHMeter:
VWR Scientific. Model8005
Beckman Combination Electrode 39846.Lot 59098
Experimental Supplies.
Capillary:
Polymicro Technologies. 25pm Internal Diameter Fused
Silica
capillary,360 pm Outer Diameter Polyimidecoating. Part
#:
200001 1Syringes:
Becton DickinsonandCompany: 10cc syringe,2.5 cc syringe
Filter discs:
Acrodisc,
sterile syringefilter. Pore
size:0.2pm,
Diameter: 25mm. HT Tuffrynmembrane.
Product
#4142
Commercially
Available Products:.
Action
Labs, Farmingdale,
NY.Yohimbe Powermax2000- 50 capsules
Pure
Yohimbe
Bark Extract. Maximum Potency. Fast Acting.Yohimbine
Bark Extract Complex: 2000mg/2CapsulesYohimbe Powermax2000-2
fluid
ouncesPure Yohimbe Bark Extract. Maximum Potency. Fast Acting. ExtractofYohimbe Bark: 2000mg/2ml
General Nutrition
Corporation, Pittsburgh,
PA.Men's Yohimbe 451-60 Capsules
Standardized Herbal Support Preparation.
Yohimbe Bark Extract(Pausinystaliayohimba):451 mg/Capsule
(2% Yohimbine Alkaloid=
9 mg)
Great American
Nutrition,
Salt LakeCity,
UTMen'sPerformance-20 Tablets
Herbal Formula.
Intimacy
Formulafor Men. MaximumPotency.
Yohimbe (Pausinystalia yohimbe) (bark): 250mg/Tablet
Irwin
Naturals,
CulverCity,
CA.Yohimbe-Plus-30 Extra Large Tablets
Five High
Potency
Herbs for Male DriveandStamina
2000 mg
Daily Supply
ofYohimbe. GuaranteedPotency.
Yohimbe Bark Powder: 2000mg/3 Tablets
Natrol,
Chatsworth,
CA.
Yohimbe
Bark.
Whole HerbPowder-90Capsules
Yohimbe,
powdered(bark):
500mg/CapsuleOnly
Natural,
IslandPark,
NY.Yohimbe
1 000plus- 10tablet trail packFor Men
Only
Booster. 100% Pure African Yohimbe Bark.Yohimbe
Bark. (100%
PureAfrican Bark):
1000mg/2 TabletsPower
Force, Hauppauge,
NY.Male Formula. PerformanceEnhancer-30Capsules 100% Pharmaceutical Grade.
Yohimbe Bark Extract: 800mg/3 Capsules
Smart Health
USA,
Beverly
Hills,
CA.V Herbal Ultra-30tablets
Ultra Pleasure
Delivery
System. The All Natural Alternative.Yohimbe Extract 2%: 250mg/2 Tablets
Saint Rose
Heights, Norwalk,
CT.SobeEnergy-20
fl
oz.Energy
drinkGuarana, Yohimbe,
ArginineTwinlab,
Ronkonkoma,
NY.Yohimbe Fuel- 50capsules
Guaranteed
Potency
Yohimbe Bark Extract.Standardized for Yohimbine.
Yohimbine: 8 mg/ capsule
MaleFuel-60capsules
Male Formula. With Yohimbe Bark Extract.
Standardized
for
Yohimbine.Yohimbe Bark Extract: 800mg/
6 Capsules
Powerman Yohimbe
Power-100 Capsules
The
AllNight
Long
Pill. Pure
Yohimbe Bark Extract.Yohimbe
BarkExtract:
225mg/CapsuleStandardized for 4.5
mg yohimbine alkaloidsPowerman
Yohimbe
Stack-30Tablets
The All Night
Long
Pill. PureYohimbe
Bark Extract. Yohimbe BarkExtract:
225 mg/TabletStandardized for
4.5 mgyohimbine alkaloidsFactorialandFractional Factorial Design.
Statistical Design Software.
Minitab 12 for Windows. Release 12.21. Minitab Inc. 1998
Methods.
Experimental Design.
Run voltage,
temperature,
buffer composition, buffer pH, buffer ionic strength,injection
type,
injection setpoint, organic modifier concentration, and effective columnlengthcomprisedthe
factors
chosenfor fractionalfactorial design
one (Table 4).A
two-level,
one-quarterfractional factorialexperimentaldesignatresolutionfourwas compiledusing designgeneratorsprovided
by
Minitab(Figure 6). FourcenterpointsTable4. FactorlevelschosenforFFD1. Low levelrepresented
by
-,high levelrepresentedby
+,centerpoints represented
by
0. FactorsDandFbasedonfactorsCandE,respectively(i.e.whenCis-,correspondingtocitrate
buffer,
D+is 6. WhenCis +,D+correspondstophosphatebufferat pH8).Factor
>
A B C D(C-) D(C+) E F(E-) F(E+) G H J
Level T kV Buffer Citrate PH
Phosphate
PH
Injection
Electro-kinetic Inj(kV)
Pressure Inj(mbar)
Column Length
Methano (%)
Ionic Strength
25 10 Citrate 3 3
Electro-kinetic
5 20 25 0 0.01
+ 35 20 Phosphate 6 8 Pressure 15 50 75 10 0.1
0 30 15 X 4.5 6.5 X 10 35 50 1 0.05
G=ABCD H=ACEF J=CDEF
Figure6. Designgeneratorsfor factorialdesignone. Generated
by
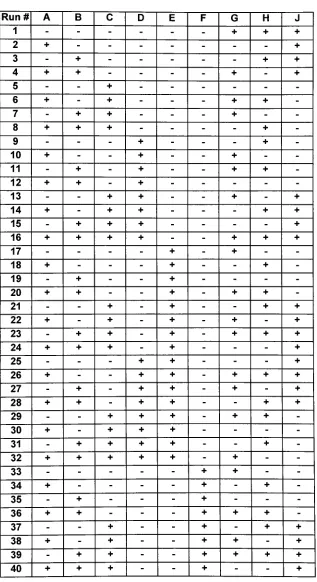
Minitab Statistical Software.were added to complete the
design,
resulting in 68 experimental runs performedin
duplicate (Table 5).
[image:40.537.47.489.100.313.2]Table 5. DesignMatrix forthefactorial designone. Designgenerators
G=ABCD,
H=ACEF,andJ=CDEF.The leveloffactor G foranyrunis determined
by
thelevelsoffactorsA, B,C,
andDforthatrun.(example:runthree.A=-,
B=+, C=-, D=-, E=-,
F=- Thereforetheleveloffactor G=ABCD=(-)(+)(-)(-)
=-,leveloffactorH=ACEF=
(-)(-)(-)(-)
=+)
Run# A B C D E F G H J
1 - - - + + +
2 + - - - +
3 - + - - - + +
4 + + - - - - + - +
5 - - + - - -
-6 + - + - - - + +
-7 - + + - - - + -
-8 + + + - - - - +
-9 - - - + - - - +
-10 + - - + - - + -
-11 - + - + - - + +
-12 + + - + - - - -
-13 - - + + - - + - +
14 + - + + - - - + +
15 - + + + - - - - +
16 + + + + - - + + +
17 - - - - + - + -
-18 + - - - + - - +
-19 - + - - + - - -
-20 + + - - + - + +
-21 - - + - + - - + +
22 + - + - + - + - +
23 - + + - + - + + +
24 + + + - + - - - +
25 - - - + + - - - +
26 + - - + + - + + +
27 - + - + + - + - +
28 + + - + + - - + +
29 - - + + + - + +
-30 + - + + + - - -
-31 - + + + + - - +
-32 + + + + + - + -
-33 - - - + + -
-34 + - - - - + - +
-35 - + - - - + - -
-36 + + - - - + + +
-37 - - + - - + - + +
38 + - + - - + + - +
39 - + + - - + + + +
40 + + + - - + - - +
41 - - - + - + - - +
42 + - - + - + + + +
43 - + - + - + + - +
44 + + - + - + - + +
45 - - + + - + + +
-46 + - + + - + - -
-47 - + + +
- + - +
-48 + + + + - + + -
-49 - - - - + + + + +
50 + - - - + + - - +
51 - + - - + + - + +
52 + + - - + + + - +
53 - - + - + + - -
-54 + - + - + + + +
-55 - + + - + + + -
-56 + + + - + + - +
-57 - - - + + + - +
-58 + - - + + + + -
-59 - + - + + + + +
-60 + + - + + + - -
-61 - - + + + + + - +
62 + - + + + + - + +
63 - + + + + + - - +
64 + + + + + + + + +
65 0 0 0 0 0 0 0 0 0
66 0 0 0 0 0 0 0 0 0
67 0 0 0 0 0 0 0 0 0
68 0 0 0 0 0 0 0 0 0
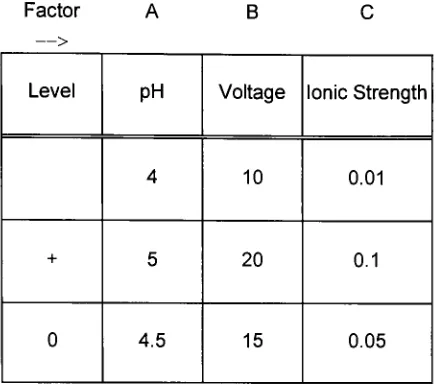
The secondary investigation focusedonthree
factors
attwolevels,
buffer
pH,buffer
ionicstrength,andrunvoltage(Table 6).A full factorial designof
23
experimentalruns and an additionaltwocenterpoint
runswerecompleted,
totaling
tenrunsin duplicate (Table 7).Table6.Factorlevelschosenfor factorial designtwo.(Low levelrepresented
by
high levelrepresented
by
+,centerpointsrepresentedby
0)
Factor A B
Level PH Voltage Ionic Strength
4 10 0.01
+ 5 20 0.1
[image:43.537.161.379.81.273.2]0 4.5 15 0.05
Table 7. Designmatrixforfactorialdesigntwo.
Run# Level A Level B Level C
1 - -
-2 + -
-3 - +
-4 + +
-5 - - +
6 + - +
7 - + +
8 + + +
9 0 0 0
10 0 0 0
[image:43.537.165.369.343.503.2]Preparation ofBuffers for
Capillary
Electrophoresis.
Citrate and Phosphate
buffers
employedin
this investigation were preparedutilizing the
Henderson-Hasselbach
(Equation
4)
and ionic strength (Equation5)
equationstowarda
known
pH andionic
strength(Scheme
4).pH=
pKa+
log
[conjugatebase]
[conjugate acid]
I=0.5Z
(cjZj2)
Buffers that
did
not measure to the calculated pH were recalculated with acorrection
factor
equalto thatofthedeviation (i.e. abufferwith a measured pH of5.2 hasa deviation of 0.2 pH units. 0.2 is the correction
factor.
The buffer is recalculatedtowardsapH of
4.8.)
All buffersolutions were
filtered
througha0.2 pmAcrodisc syringeCitratebuffer: pH=5
.00,1
=0. 1
0,
pKa2citrate=4.76[H2A]
=C6H707"
[HA-]
=C6H607+
0.10=0.5
(([H2A"](12)
+([Na,+](12))
+([HA=](22)
+2[Na2+](l2)))
Setting [H2A]
=[Naf]
=xand
[HA=]
=[Na2+]
=y
0.10=0.5
(((x)
+(x))
+((4y)
+(2y)))
Solving
forxx=
0.10-3y
6The Henderson-Hasselbachequationfortheseconditionsis
5.00=4.76+
log (y/x)
Solving
fory/x yields10-24
=
(y/x)
Substituting
Equation6 forx1.738=y/(0.10
-3y)
Solving
for yyieldsy=0.028 M=
[HA=]
Substituting
y into Equation 6x=0.016 M=
[H2A']
Scheme 4: BuffercalculationsforcitratebufferpH5.00,1= 0.10.
Preparation
ofStandards
forCapillary
Electrophoresis.
Yohimbineand
Eserine Standard (Factorial
Design One).A measured amount of yohimbine was quantitatively transferred to a 10 mL
volumetric
flask.
Buffercorresponding
to the proper pH and ionic strengthfor
theexperimental run was addedtovolume and mixedtoyield a2000ppm standard.
A measured amount of eserine was quantitatively transferred to a 10 ml
volumetric
flask.
Buffer corresponding to the proper pH and ionic strength for theexperimentalrunwas addedtovolume andmixedtoyielda2000ppm standard.
Equal parts 2000 ppm yohimbine standard and 2000 ppm eserine standard were
added to a 10 ml conical plastic graduated centrifuge tube and vortexed to yield a
standard of 1000 ppm in both yohimbine and eserine. The standard solution was then
filteredthrougha0.2pmAcrodisc syringefilter
disc.
Yohimbineand EserineStandard (Factorial Design Two).
Deionized ultra filtrated water was employed to utilize the stacking effects that
occur when a buffer oflower ionic strength than the separation
buffer is
present in theinjectionvial (50). Ameasured amountof yohimbine was quantitatively transferred to a
10 ml volumetricflask. Deionizedwater wasaddedtovolume and mixedtoyielda2000
ppm standard.
A measured amount of eserine was quantitatively transferred to a 10 ml
volumetricflask. Deionizedwaterwas addedtovolume and mixedto yield a
2000
ppmstandard.
Equal parts 2000 ppm yohimbine standard and 2000 ppm eserine standard were
added to a 10 mL conical plastic graduated centrifuge tube and vortexed to yield a
standard of 1000 ppm
in both
yohimbine and eserine. The standard solution was thenfiltered
througha0.2 pmAcrodisc
syringefilter disc.
MethodsofExtraction.
ExtractionofYohimbine from Liquid Products.
Portions of 1 ml of ethanol based
liquid
products were evaporated with acentrivap concentrator. The resulting solids were reconstitutedwithdeionized water and
filtered with a 0.2 pm Acrodisc syringe filter. An aliquot ofthe filtrate was combined
with an aliquotofinternalstandardandbufferand
injected
ontothecolumn.Waterbasedproducts werefilteredwith a0.2 mmAcrodisc syringe
filter,
and analiquot ofthe filtrate was combined with an aliquot of
internal
standard andbuffer
andinjectedontothecolumn.
ExtractionofYohimbine from Solid Products.
Capsules were broken open and the cellulose casing
discarded.
Portions
ofthepowdersremovedwereutilized
for
thisinvestigation. Tabletswere crushed with a mortarandpestle, andtheresultant powder utilized
for
thisinvestigation.
Extraction
MethodOne.
Portions of0.1 gram of
bark
powder(0.1 gram ofproduct) was wet and broughttovolume
in
a 10 ml volumetricflask
withdeionized
water. This slurry wasagitated for20 minutes at room temperature. The contents were then filtered through a 0.2pm
Acrodiscsyringe
filter,
and an aliquot ofthefiltrate
was injectedontothe columnwith analiquot of an
internal
standard andbuffer.
Extraction Method Two.
Portionsof0.05 gramof
bark
powder (0.5 gram ofproduct) was wet andbroughttovolume in a 10mlvolumetric flaskwithdeionizedwater. This slurry wasagitatedfor
20 minutes at room temperature. The contents were then filtered through a 0.2 mm
Acrodisc syringe
filter,
and an aliquot ofthe filtratewas injectedontothe columnwithanaliquotof aninternalstandard andbuffer.
Extraction Method Three.
Portions of0.1 gram ofbarkpowder (0.1 gram ofproduct) was wet and
brought
tovolume ina 100mlvolumetricflaskwithdeionizedwater. This slurrywastransferred
to a 1 L Erlenmeyer flask and agitated for 60 minutes at
60
C in a Labline
environmental orbital shaker. Thecontents were allowedto cool,andthe
liquid decanted
and filtered through a 0.2pm Acrodisc syringe
filter.
An aliquot of thefiltrate
wasinjectedontothecolumn withanaliquotof aninternalstandard and
buffer.
Extraction
Method
Four.Portions
of0.1 gram ofbark
powder (0.1 gram ofproduct) was wet and broughttovolumein a 100 ml volumetric
flask
withdeionized
water. This slurrywas transferredto a 250 ml
Erlenmeyer flask
and sonnicatedfor 15 minutesat room temperature. Thecontents were allowedto coolto room
temperature,
and the liquid decanted and filteredthrough a 0.2pm Acrodisc syringe
filter.
Analiquot ofthefiltrate
was injectedonto thecolumn with an aliquot ofan
internal
standard andbuffer.
Extraction Method Five.
Portions of0.1 gram ofbarkpowder(0.1 gram ofproduct) was wet andbrought
to volume in a 10 ml volumetric
flask
with 10 ml of 95% ethanol. This slurry wasagitated
for
20 minutes atroom temperature. The contents were thenfiltered
through a0.2 pm Acrodisc syringe filter. The ethanol was evaporated with a rotary evaporator
concentrator, andthe remaining powderreconstituted
into
3 ml ofdeionizedwater. Thesolution was thenfilteredthrough a0.2 pm Acrodisc syringe
filter,
andan aliquotofthefiltrate
wasinjectedontothecolumn withan aliquot ofaninternal
standard andbuffer.
Extraction Method Six.
Portions of0.1 gram ofbarkpowder (0.1 gram ofproduct) was wet and
brought
tovolume
in
a 10 mlvolumetricflask
withchloroformand added toa 125 mlseparatory
funnel.
It was equilibrated with 10 ml of deionized water, and the organiclayer
collected. The aqueous layer was washed with a portion of 10 ml chloroform. The
organic
layers
werecombined, andfiltered
through a0.2 pmAcrodisc
syringefilter.
Thechloroform was removed with a rotary evaporator, and the resultant solids reconstituted
into
3 ml ofdeionized
water.The
solution wasfiltered
through a 0.2 pm Acrodiscsyringe
filter,
and an aliquot wasinjected
onto the column with analiquot of aninternalstandard and
buffer.
Extraction Method Seven.
Solid
phase extraction was performed on an Alltech reverse phase 900 mgCis
solid phase extraction cartridge. The cartridge was first conditioned with 3 ml of
methanol, followed
by
3 ml ofdeionized water. 1 ml ofsample dissolved in deionizedwater (0.05 g/ 10 ml) was applied. A 5 ml portion of water was pushed through the
column, and collected as a fraction. 3 ml
fractions
of 10% methanol in water, 50%methanol in water, 75% methanol
in
water, and 100% methanol were collectedsuccessively. The methanol was removed from these fractions with a centrivap
concentrator. The resultant solids were reconstituted with 1 ml deionized water, and an
aliquot wasinjectedontothecolumn with an aliquotof aninternal standard andbufferto
determine
thetargetfraction.Extraction Method Eight.
Solid phase extraction was performed on an Alltech reverse phase 300 mg
Ci8
solid phase extraction cartridge. The cartridge was
first
conditioned with 3 ml ofmethanol, followed
by
3
ml ofdeionized water. 1 ml of sampledissolved in deionized
water (0.05 g/ 10 ml) was applied. A 3 ml portion of water was pushed through the
column, and collected as a fraction. 1 ml
fractions
of 10% methanol in water, 50%methanol
in
water, 75% methanolin
water, and 100% methanol were collectedsuccessively. The methanol was removed
from
thesefractions
with a centrivapconcentrator. The resultant solids were reconstituted with 1 ml
deionized
water, and analiquot was
injected
ontothecolumn with an aliquot of aninternal standardandbuffer
todetermine
the targetfraction.
Extraction Method Nine.
Solid phase extraction was performed on an Alltech reverse phase 900 mg
Cig
solid phase extraction cartridge. The cartridge was first conditioned with 3 ml of
isopropanol,
followed
by
3 ml ofdeionizedwater. 1 mlofsample dissolved indeionized
water (0.05 g/ 10 ml) was applied. A 5 ml portion ofwater was pushed through the
column, andcollected as a
fraction.
Two successive 3 mlfractions
of 100% isopropanolwere collected, followed
by
twosuccessive 3 mlfractionof2% ammoniumhydroxide
inisopropanol. The isopropanol was removed from 1 mlportions ofthese
fractions
with acentrivap concentrator. The resultant solids were reconstituted with 1 ml
deionized
water,and an aliquotwasinjectedontothecolumn with an aliquotofaninternal standard
andbuffertodeterminethe target
fraction.
Extraction Method Ten.
Solid phase extraction was performed on an Alltech reverse phase 300 mg
Cig
solid phase extraction cartridge. The cartridge was first conditioned with 3 ml of
isopropanol,
followedby
3 ml ofdeionizedwater. 1 ml of sampledissolved in
deionized
water (0.05 g/ 10 ml) was applied. A 3 ml portion of water was pushed through the
column, and collected as a
fraction.
Two successive 1 mlfractions
of100% isopropanolwerecollected,
followed
by
twosuccessive 1 mlfraction
of2% ammoniumhydroxidein
isopropanol.
The isopropanol
was removedfrom
thesefractions
with a centrivapconcentrator. The resultant solids were reconstituted with 1 ml deionized water, and an
aliquot was
injected
onto thecolumn with an aliquotof an internalstandardandbuffertodetermine
the targetfraction.
Optimized
ExtractionConditions
for Commercial Samples.Theprotocol of extraction
five
was expandedforcontinuedinvestigation. Samplemass andethanolvolumewere varied
between
highandlow levelstodetermine
the mostefficient extraction conditions. Thefinal conditions
for
real sample analysisinvolved
theuse of 0.05 g sample dissolved into 10 ml of95% ethanol in a volumetric
flask.
Theethanol was then decanted and filtered through a 0.2 mm Acrodisc syringe filter. 1 ml
aliquots ofthis slurry were evaporated with a Labconco rotary concentrator (60 C * 45
min). Theresultantsolids werereconstituted
into
1 ml ofwarmdeionized
water,filtered
througha0.2mm Acrodisc syringe
filter,
and an aliquotinjected
along with avolume ofeserinestandardandbuffer.
Instrumental.
Conditioning
oftheCapillary
Column.New capillary columns were preconditioned utilizing a standard method. A 45
minute
flush
with 1.0