HOBS methods for enhancing
resolution and sensitivity in small DNA
oligonucleotide NMR studies
Josiah M. McKenna†§ and John A. Parkinson†*
†
WestCHEM Department of Pure and Applied Chemistry, University of Strathclyde, 295 Cathedral Street, Glasgow, G1 1XL, U. K.
*Corresponding author:
Dr. John A. Parkinson
WestCHEM Department of Pure and Applied Chemistry1 University of Strathclyde
295 Cathedral Street Glasgow G1 1XL United Kingdom
Email: [email protected]
Tel: +44 141 548 2820 Fax: +44 141 548 4822
§
Visiting Thronson Scholar, Carroll University, 100 NE Ave, Waukesha, WI 53186, United States of America.
Abstract
1
H NMR spectra from biopolymers give chemical shifts classified according to proton type and often suffer from signal degeneracy. Data from nucleic acids are particularly prone to this failing. Recent developments in proton broad-band decoupling techniques with the promise of enhanced resolution at full sensitivity have allowed us to investigate the application of homo-nuclear band-selective (HOBS) decoupling to the study of small synthetic DNA molecules and to compare these with results from classical and Pure Shift techniques. Improved signal resolution at full sensitivity in both HOBS-1D 1H and HOBS-2D [1H, 1H] NOESY NMR data are reported for three example small DNA molecules. Comparisons of 1H T1 and integrals of signals from HOBS-1D 1H and HOBS-2D [1H, 1H] NOESY NMR data with those of standard data collection methods are also reported. The results show that homo-nuclear HOBS-NOESY data are useful for data assignment purposes and have some merit for quantification purposes. In general we show that resolution and sensitivity enhancement of 1H NMR data for small DNA samples may be achieved without recourse to higher magnetic field strengths at full sensitivity in a band-selected manner.
Introduction
NMR studies of nucleic acids and their covalent and non-covalent complexes with ligands have provided rich information on the solution phase context of DNA and RNA as a complement to many studies carried out in the solid state by X-ray crystallography.[1] The advantage of using small, synthetic DNA samples for solution phase NMR studies is the ready supply of sequence-defined molecules. A disadvantage, however, is that such material is mainly created without spin-isotope enrichment, which would typically ease the NMR data assignment process while adding richness to the information pool. Lack of isotope enrichment owes its absence on the one hand to high costs associated with producing synthetic, isotope-enriched DNA by solid-phase synthesis, or on the other in the specialized and somewhat involved process of isotope-enriched DNA production from cell-based growth methods.[2-4] The limited palate of four nucleotides used as synthetic building blocks compared with twenty or so amino acid building blocks used for peptide and protein construction combines with often limited topological variation for DNA. The resulting DNA NMR spectra have very limited signal dispersion. By placing reliance largely on the use of 1H NMR data to understand DNA solution behaviour in the absence of carbon or nitrogen spin-isotope enrichment, such poor signal dispersion, even at the highest available magnetic fields, can be limiting for the size and sequence length of even small DNA molecules that may be studied. This restricts the extent to which routine DNA solution phase NMR studies can be useful.
non-specialists within open-access NMR laboratories. Recently, a breakthrough in generating 1 H-{1H}BB NMR data was reported with the creation of Pure Shift 1H NMR data in real time using explicit data acquisition that incorporates repeated scalar coupling refocusing periods interleaved with data acquisition blocks.[12] The approach brings 1H-{1H}BB NMR data acquisition into the main stream provided appropriate hardware capabilities are in place.
Experimental Section
Materials
The single stranded DNA sample d(GCCTGC) (6-mer) and self-complementary DNA duplex samples d(CGATATATCG)2 (10-mer) and d(CGACGCGTACGCGTCG)2 (16-mer) were manufactured on 15 mol scale syntheses by AlphaDNA (Quebec, Canada) and were used without further purification. D2O was purchased from Sigma-Aldrich and used as supplied.
Sample Preparation
DNA samples were freeze-dried once from D2O solution and redissolved at the appropriate concentration in D2O prior to being admitted to 5 mm Ø Wilmad 528-PP NMR tubes. The concentrations of the 6-mer, 10-mer and 16-mer samples were, respectively, 4.7 mM, 3.5 mM and 2.1 mM.
NMR data acquisition
All NMR data were acquired using a Bruker 14.1 T AVANCE II+ NMR spectrometer operating at 600.13 MHz for proton resonance using a triple resonance TBI [1H, 13C, 31P-15N] probe-head fitted with an actively shielded z-gradient coil capable of delivering a maximum pulsed field-gradient field of 53.5 G/cm and running under Topspin (version 2.1, Bruker, Karlsruhe, Germany). All NMR data were acquired at a regulated probehead temperature of 298 K.
T1 NMR data were acquired using standard and HOBS-adapted procedures as detailed later in the text: typically an 8 s relaxation delay period was followed by a 2 s solvent presaturation period after which the main pulse sequence ran. A variable delay (vd) list was used to generate data for the evaluation of T1 parameters where vd = 100 s, 0.1 s, 0.2 s, 0.5 s, 1 s, 2 s, 5 s, 10 s. T1 values were estimated from triplicate data by fitting either
peak intensities or integrals according to the standard expression ⁄ . Data were compared between standard and HOBS-adapted pulse sequences for a selection of resonances for the model single-stranded oligonucleotide d(GCCTGC).
spatially encoded Pure Shift data, solvent suppression was achieved by continuous low power irradiation of the residual HOD resonance typically at 1H = 4.709 ppm. Typical 1D 1H NMR spectra were acquired with a 90˚ read pulse and with 16 - 64 transients over a 5.5 kHz frequency width centred at 1H = 4.709 ppm. 1D-1H-HOBS NMR spectra were acquired under similar conditions but additionally used a selective single pulsed-field gradient spin-echo employing a reburp shaped pulse calibrated for selective refocusing over bandwidths of between 0.6 and 1.2 kHz. 1D 1H instantaneous Pure Shift (HOBB) 1H-{1H}BB NMR data were acquired with 8192 transients over a frequency width of 6 kHz. 2D standard NOESY, zero-quantum suppressed NOESY and their band-selective non-HOBS and HOBS equivalents were all acquired with presaturation using low-powered continuous irradiation at the transmitter offset frequency. All data were processed within Topspin 2.1.
Results and Discussion
Comparison of standard, broadband decoupled (HOBB) and band-selected
homo-decoupled (HOBS) data.
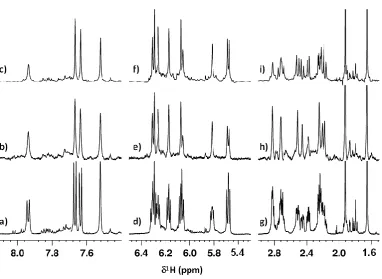
apparent, although as expected some coupling information was retained owing to the close chemical shift of H2’/H2’’ partner resonances (Figure 1h). Although these results appear excellent, the acquisition time required to attain quality HOBB (Pure Shift) data was excessive for a 1D 1H NMR spectrum (9 hours 37 minutes). Nevertheless, the data proved the principle that even low millimolar concentrations of small DNA oligonucleotides can be analysed by 1H NMR using such a Pure Shift approach. In contrast, as shown by Figure 1c, f and i, the issue of sensitivity with simplification of data can be readily addressed using the HOBS approach for oligonucleotides. These HOBS data were each acquired at full sensitivity in just over a minute rather than several hours taken to acquire the Pure Shift (HOBB) data. They also demonstrated how, by the use of a band-selective approach with on-the-fly data chunking, the oligonucleotide 1D 1H NMR spectral resolution and sensitivity can be significantly improved in specific regions of DNA NMR spectra. For the aromatic and H1’/H5 resonance regions in particular, all observed signals collapsed to reveal only resolved singlets at each chemical shift (Figure 1c and f). Although some couplings were inevitably retained in the H2’/H2’’ resonance region (Figure 1i) compared with the equivalent Pure Shift data (Figure 1h) the improvement in signal resolution for the HOBS data is nevertheless impressive.
Figure 1: Aromatic (a-c), H1’/H5 (d-f) and H2’/H2’’/CH3 (g-i) resonance regions of 600 MHz
1D 1H NMR data for the 6-mer oligonucleotide d(GCCTGC) in D2O at a concentration of 4.7 mM acquired using a variety of acquisition modes. a), d), g): 1D 1H NMR spectrum acquired using a standard single-pulse/acquire scheme with presaturation using 16 transients; b), e), h): 1D 1H NMR spectrum acquired using an instantaneous Pure Shift (HOBB) acquisition scheme with presaturation using 8192 transients; c), f), i): 1D 1H NMR spectrum acquired with 16 transients using a band-selected homo-decoupling (HOBS) acquisition scheme in which each spectrum was acquired under separate acquisition conditions using frequency shifted band-selective reburp pulses: c) – bandwidth = 550 Hz, selective pulse offset frequency = 1670.2 Hz; f) – bandwidth = 600 Hz, selective pulse offset frequency = 710.5 Hz; i) – bandwidth = 1200 Hz, selective pulse offset frequency = -1713.73 Hz. Note that the
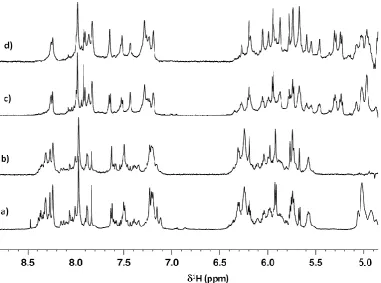
The improvement in resolution noted for the 6-mer single strand d(GCCTGC) was also found in the more realistic contexts of the 10-mer and 16-mer self-complementary DNA duplex molecules, which possess a greater number of base-pairs, furanose sugars and consequently H1’, H5 and H6 resonances. The results (Figure 2) show marked improvement in resolution as anticipated for the HOBS-style data compared with the fully-coupled data acquired under single pulse/acquire conditions. Both aromatic and H1’/H5 resonance regions are substantially better resolved at no cost in signal-to-noise, making it clear that the HOBS-style technique is highly applicable to the study of longer DNA molecules in solution owing to the improved spectral resolution with no change in magnetic field strength.
Figure 2: 600 MHz 1D 1H NMR spectra of DNA duplexes acquired with and without HOBS-style data acquisition. a) 10-mer duplex d(CGATATATCG)2 standard data acquisition; b) as for (a) but with HOBS-style data acquisition; c) 16-mer duplex d(CGACGCGTACGCGTCG)2 standard data acquisition; d) as for (c) but with HOBS-style data acquisition. Spectra (b) and (d) showing HOBS data are each a combination of HOBS spectra acquired over different
frequency-selected regions followed by co-addition of the spectra post-processing. All contributing spectra were acquired with 16 transients per FID over a frequency width of 5.5 kHz.
extracting information about inter-proton distances when used in solution phase structure determination studies as detailed later in this article.
With this in mind, we also investigated how results from T1 NMR relaxation data measurements might be affected through HOBS-style data acquisition as a prelude to evaluating the feasibility of using 2D HOBS-1H NOESY NMR data for inter-proton distance determination for DNA molecules. Our suspicions regarding this were aroused when we assessed the effects of altering the relaxation delay for the HOBS-style data acquisition compared with a single-pulse/acquire data acquisition scheme. It was clear (Supporting Information Figure S2) that at the longer relaxation delays tested (d1 values up to and including 5 s) with HOBS, the data were of greater intensity compared with those acquired with short relaxation delays (e.g. d1 = 1 s). In contrast, data from a single-pulse/acquire scheme using the same range of relaxation delays showed very similar intensities to one another. A common practice in 2D [1H, 1H] correlation data acquisition schemes, especially for biopolymer samples, is to cut the relaxation delay back in order to shorten the overall time taken to acquire a complete data set, which is valid owing to the extent of the spin-relaxation networks in such biopolymers. For DNA samples, some resonances such as those arising from adenine H2 protons take longer to recover and longer relaxation times are therefore recommended when acquiring NOESY data for quantification. Results from the HOBS data acquisition scheme suggest that longer relaxation delays may be required as a matter of course with the benefit of creating data with greater signal intensity. As usual, the trade-off in time versus signal intensity should be considered carefully but it is apparent from these measurements that some care should be taken over the choice of relaxation delay when acquiring HOBS 1H NMR data from small DNA oligonucleotide samples.
without band-selective homo-nuclear decoupling from small DNA oligonucleotide 1H NMR spectra. Comparisons of these data were made as summarized in Table 2.
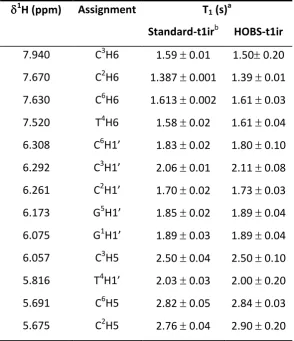
The data revealed good agreement between measurements made using standard inversion-recovery and HOBS inversion recovery to determine proton T1 relaxation values in small DNA oligonucleotides, in accordance with conclusions drawn from the work on the peptide cyclosporine A in d6-benzene.[17] The increased standard error in HOBS-T1 data for C3H6, C6H1’, C3H5, T4H1’ and C2H5 is a reflection of the differences encountered through fitting data derived from peak intensity compared with peak area. Generally, those data that were only available for peak-picking from the standard T1 inversion recovery approach (owing to signal overlap in J-coupled spectra) coincided more closely with those values derived from peak-integrated HOBS T1 inversion recovery data for measurements made in triplicate (see Supporting Information Tables S1-S4). For example, the peak-picked, HOBS-T1 data for C6H1’ gave an average T1 value over triplicate measurements equal to 1.669 0.004 s. This deviated from the value obtained by integration of the same data which gave an average T1 value of 1.848 0.004 s. This more closely reflected the value obtained by peak-picking the same resonance using the standard T1 inversion recovery data, which gave T1=1.831 0.016 s. The other highlighted resonances with larger standard errors showed similar trends. This suggests that in our hands when studying small DNA oligonucleotides, peak intensity is a less reliable source for T1 data fitting in a HOBS-T1 style data acquisition mode compared with using peak integration on the same data. For this reason it is suggested that T1 data fitting made using a HOBS-type instantaneous acquisition protocol is compared for results using both peak areas and peak intensities wherever possible to prevent misinterpretation. One explanation for the difference observed may be associated with the additional influence of T2 relaxation on the FID that is created using the instantaneous acquisition protocol used in this work, which is a source of line-broadening effects.[18]
Comparison of 2D [1H, 1H] HOBS-NOESY with standard and band-selected 2D [1H, 1H] NOESY.
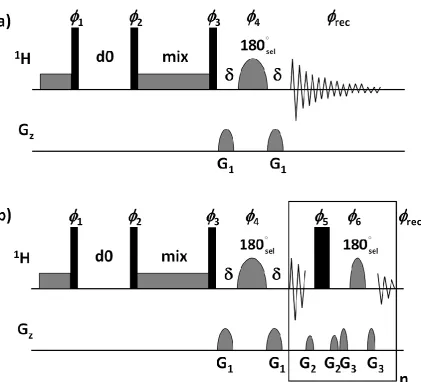
sequences. We were particularly interested in exploring the extent to which 2D [1H, 1H] NOESY NMR data of DNA samples might be enhanced using HOBS following a recent report illustrating the application of NOESY adapted for HOBS in the context of peptide studies.[18] Our approach began with basic pulse sequences to ensure that data acquisition worked, subsequently progressing to more advanced pulses sequences. Initially to test how HOBS might influence the generation of NOESY NMR data from small DNA oligonucleotides, three pulse sequences and their variants were created. These included those shown schematically in Figure 3 alongside a classical 2D NOESY pulse sequence from which they were derived. A zero-quantum suppression NOESY pulse sequence (Figure S4 in the Supporting Information) was also adapted and tested successfully as part of this process.
Figure 3: Pulse sequences from among those used to measure 2D [1H, 1H] NOESY NMR spectra for 6-mer, 10-mer and 16-mer oligonucleotides in D2O. a) Basic pulse sequence used for the acquisition of band-selected NOESY NMR data without broadband homonuclear decoupling: 1 = x, -x; 2 = x [8], -x [8]; 3 = x, x, -x, -x, y, y, -y, -y; 4 = -x, x, -x, x, y, -y, y, -y;
rec = x, -x, -x, x, y, -y, -y, y, -x, x, x, -x, -y, y, y, -y; G1 = 60% with a 1 ms duration; b) Basic
pulse sequence used for the acquisition of HOBS-style 2D [1H, 1H] NOESY NMR data:1 = x, -x; 2 = x [8], -x [8]; 3 = x, x, -x, -x, y, y, -y, -y; 4 = x, -x, -x, x, y, -y, -y, y; rec = x, x, x, x, y, y, -y, -y, -x, x, x, -x, --y, -y, -y, -y; G1 = 60%, G2 = 23% and G3 = 41% with a 1 ms duration (). Sine-shaped gradient pulses were used throughout. Narrow black bars correspond to hard 90˚ pulses, wide black bars correspond to 180˚ pulses and soft 180˚ pulses are as indicated. A band-selective reburp pulse was used for selective inversion of magnetization.
set (Figure 4a). The example shown selected the H1’/H5 resonance region of the spectrum to illustrate the effectiveness of the HOBS-style data acquisition for improving resolution in the 2 frequency domain. The region provides information on through-space interactions between H1’/H5 protons and H8/H6, H3’, H4’, H5’/H5’’, H2’/H2’’ and CH3 protons. This substantial set of NOE information is sufficient to enable resonance assignments to be defined for a large number of protons in small DNA molecules. When combined with information arising from similar data acquired using a H8/H6 band-selective pulse, a complete set of 1H resonance assignments for such a molecule is feasible. Similar data for the 10-mer DNA duplex d(CGATATATCG)2 illustrating this fact are shown in the Supporting Information (Figures S5 and S6). As shown by Figure 4c for the 16-mer, substantial improvement in resolution is achieved across the selected region using HOBS. There is no gain in time-saving using this approach and in practice, the non-HOBS and HOBS band-selected NOESY data sets were acquired with 16 transients per FID (Figure 4b and 4c) into 8192 data points compared with the full data set for which 8 transients were acquired into 2048 data points per FID (Figure 4a) and in order to achieve the same 1 resolution, the same number of t1 increments (360) were used to acquire all three data sets with all data being processed in the same manner.
Figure 4: 600 MHz 2D NOESY NMR spectra acquired for 2.1 mM d(CGACGCGTACGCGTCG)2 in
D2O at 298 K. a) Standard NOESY data acquisition scheme; b) band-selected, J-coupled (non-HOBS) data acquisition scheme; c) band-selected homo-nuclear decoupled (HOBS) data acquisition scheme. Complete data sets are shown for (b) and (c) whereas (a) shows the equivalent region taken from a complete 2D-NOESY data set for the 16-mer. 1D 1H NMR spectra are shown as projections appropriate to the 2D acquisition scheme used in each case.
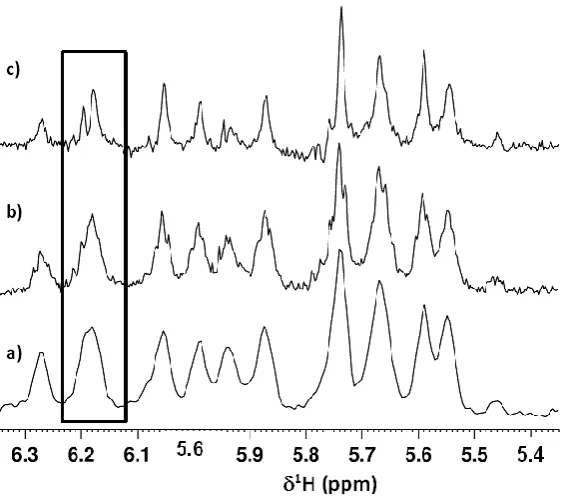
clearly. The 16-mer DNA duplex, which possesses a repeat sequence of –ACGCGT-, has many degenerate 1H NMR resonances, which belies the apparent simplicity of the data. Standard 2D [1H, 1H] NOESY NMR data cannot resolve many of the resonances but HOBS-type data shows promise in resolving normally overlapped resonances, thereby enabling a more rigorous signal assignment of the data.
Figure 5: Expansions showing the H1’/H5 to H4’/H5’/H5’’ cross-peak region of the 600 MHz
2D NOESY NMR spectra acquired for d(CGACGCGTACGCGTCG)2 in D2O at 298 K. a) Standard NOESY data; b) band-selective, J-coupled (non-HOBS) data; c) band-selective homo-nuclear decoupled (HOBS) data.
Figure 6: Slices extracted at 1H(1) = 4.14 ppm from each of the 2D [1H, 1H] NOESY NMR data sets for the 16-mer DNA duplex d(CGACGCGTACGCGTCG)2 in D2O. a) Standard NOESY data; b) band-selected, J-coupled (non-HOBS) NOESY data; c) HOBS-NOESY data. Note the improvement in signal resolution for the two resonances highlighted in the boxed region of the spectra, which show coincidence in (a) and (b) but are clearly resolved in (c).
Use of HOBS-NOESY NMR data for inter-proton distance measurements
H6-H5 NOESY cross-peak, labelled A (Figure S7), in each of the data sets. A visual representation of the location of each of the cross-peaks used is shown (Figure S7 in the Supporting Information). Table 3 summarizes the results of our findings.
To some extent, the integral values determined for the representative NOESY cross-peaks compare favourably between standard NOESY, band-selected NOESY and HOBS-NOESY (cross-peaks A-D, M-O, Q-V). However, some values show a marked (> 3 times) difference between those measured in standard NOESY data sets and those measured in either band-selected or HOBS-NOESY data sets (cross-peaks K, L, P, W) although the similarity in each case between integrals from band-selected and HOBS-NOESY is generally notable. All data were acquired and treated in the same manner and whilst good reproducibility is in evidence, it’s clear that further rigorous investigations are required to confirm whether the differences observed are likely to be commonplace between data from standard NOESY compared with either band-selected- or HOBS-NOESY spectra before a clear judgement can be made concerning the use of HOBS-NOESY NMR data for quantitation relating to inter-proton distance evaluation for DNA samples. Overall the results are promising when combined with the effects of improved resolution.
Conclusions
resolution than could normally be expected using standard acquisition schemes. Although similarities exist in the quantitation of NOESY cross-peaks from either band-selected- or HOBS-NOESY NMR data compared with standard NOESY NMR data for the same molecule, further detailed evaluation should be carried out using a range of acquisition conditions and different DNA samples before a clear judgement may be made on this. Nevertheless, our findings show that HOBS-NOESY NMR data for small DNA oligonucleotide samples may be used routinely to improve resolution for at least one half of the spectral width associated with DNA 1H NMR spectra. Further work is in progress to explore the application of related techniques that may further enhance the quality and utility of such data.
Acknowledgements
References
[1] For example see a) H. Y. Alniss, N. G. Anthony, A. I. Khalaf, S. P. MacKay, C. J. Suckling, R. D. Waigh, N. J. Wheate, J. A. Parkinson. Chem. Sci. 2012, 3(3), 711-722. b) J. A. Parkinson, A. I. Khalaf, N. G. Anthony, S. P. Mackay, C. J. Suckling, R. D. Waigh. Helv. Chim. Acta 2009, 92, 795-822. c) N. B. Ulyanov, W. R. Bauer, T. L. James. J. Biomol. NMR 2002, 23(3), 265-280. M. Katahira, M. Kanagawa, H. Sato, S. Uesugi, S. Fujii, T. Maeda. Nucl. Acids Res. 1994, 22(14), 2752-2759.
[2] J. M. Louis, R. G. Martin, G. M. Clore, A. M. Gronenborn. J. Biol. Chem.1998, 273(4), 2374-2378.
[3] J. Yan, J. H. Bushweller. Biochem. Biophys. Res. Commun. 2001, 284, 295-300.
[4] B. René, G. Masliah, L. Zargarian, O. Mauffret, S. Fermandjian. J. Biomol. NMR 2006, 36, 137-146.
[5] K. Zangger, H. Sterk. J. Magn. Reson. 1997, 124, 486-489.
[6] A. J. Pell, R. A. E. Edden, J. Keeler. Magn. Reson. Chem. 2007, 45, 296-316.
[7] J. A. Aguilar, M. Nilsson, G. A. Morris, S. Faulkner. Angew. Chem. Int. Ed. Engl. 2010, 49, 3901-3903.
[8] N. H. Meyer, K. Zangger. ChemPhysChem 2014, 15, 49-55.
[9] G. A. Morris, J. A. Aguilar, R. Evans, S. Haiber, M. Nilsson. J. Am. Chem. Soc. 2010, 132(37), 12770-12772.
[10] J. A. Aguilar, A. A. Colbourne, J. Cassani, M. Nilsson, G. A. Morris. Angew. Chem. Int. Ed. Engl. 2012, 51(26), 6460-6463.
[11] M. Nilsson, G. A. Morris. Chem. Commun. 2007, 933-935.
[12] N. H. Meyer, K. Zangger. Angew. Chem. 2013, 52(28), 7143-7134.
[13] L. Casta ar, P. Nolis, A. Virgili, T. Parella. Chem. Eur. J. 2013, 19, 17283-17286. [14] V. M. R. Kakita, J. Bharatam. Magn. Reson. Chem. 2014, 52, 389-394.
[15] M. Foroozandeh, R. W. Adams, N. J. Meharry, D. Jeannerat, M. Nilsson, G. A. Morris. Angew. Chem. Int. Ed. Engl. 2014, 53(27), 6990-6992.
[16] M. P. Evstigneev, J. A. Parkinson, A. O. Lantushenko, V. V. Kostjukov, V. I. Pahomov. Biopolymers 2010, 93(12), 1023-1038.
Tables
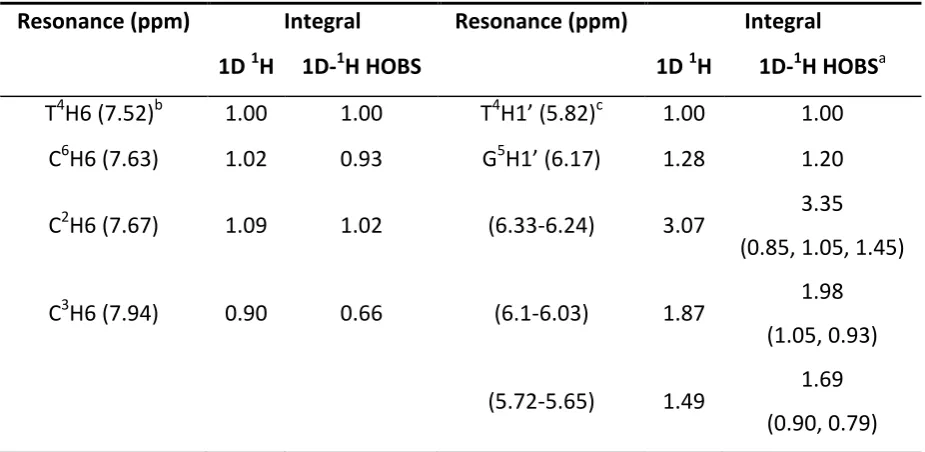
Table 1: Comparison of integrals for individually resolved resonances and clusters of
resonance for standard 1D 1H and 1D 1H-HOBS NMR data for selected regions.
Resonance (ppm) Integral Resonance (ppm) Integral
1D 1H 1D-1H HOBS 1D 1H 1D-1H HOBSa
T4H6 (7.52)b 1.00 1.00 T4H1’ (5.82)c 1.00 1.00
C6H6 (7.63) 1.02 0.93 G5H1’ (6.17) 1.28 1.20
C2H6 (7.67) 1.09 1.02 (6.33-6.24) 3.07 3.35
(0.85, 1.05, 1.45)
C3H6 (7.94) 0.90 0.66 (6.1-6.03) 1.87 1.98
(1.05, 0.93)
(5.72-5.65) 1.49 1.69 (0.90, 0.79) a
Values in brackets refer to integrals of individually resolved resonances in the HOBS data. b
Table 2: Comparison of 1H T1 relaxation time data for the oligonucleotide d(GCCTGC) in D2O using standard T1 inversion-recovery vs HOBS inversion-recovery according to the sequence shown in Supporting Information Figure S3.
1
H (ppm) Assignment T1 (s)a
Standard-t1irb HOBS-t1ir 7.940 C3H6 1.59 0.01 1.50 0.20 7.670 C2H6 1.387 0.001 1.39 0.01 7.630 C6H6 1.613 0.002 1.61 0.03 7.520 T4H6 1.58 0.02 1.61 0.04 6.308 C6H1’ 1.83 0.02 1.80 0.10 6.292 C3H1’ 2.06 0.01 2.11 0.08 6.261 C2H1’ 1.70 0.02 1.73 0.03 6.173 G5H1’ 1.85 0.02 1.89 0.04 6.075 G1H1’ 1.89 0.03 1.89 0.04 6.057 C3H5 2.50 0.04 2.50 0.10 5.816 T4H1’ 2.03 0.03 2.00 0.20 5.691 C6H5 2.82 0.05 2.84 0.03 5.675 C2H5 2.76 0.04 2.90 0.20 a
Table 3: Comparison of normalized integrals for selected cross-peaks in different 2D [1H, 1H] NOESY NMR data sets acquired for the 16-mer DNA duplex d(CGACGCGTACGCGTCG)2 in D2O at 298K.
Peaka
1
H Chemical Shift
(ppm) Normalized Integral
b
1 2 NOESY NOESY-sel NOESY-HOBS
A 7.542 5.823 1.000 1.000 1.000
B 7.414 5.616 0.650 0.686 0.622
C 7.169 5.177 1.131 1.121 1.503
D 7.107 5.114 0.937 0.950 1.272
K 4.023 4.846 0.717 0.234 0.255
L 4.253 4.846 0.854 0.303 0.274
M 3.989 4.894 0.310 0.204 0.294
N 4.219 4.890 0.152 0.081 0.098
O 4.068 5.547 0.446 0.391 0.554
P 2.501 4.846 0.636 0.201 0.163
Q 2.617 4.850 0.265 0.104 0.103
R 2.295 5.549 1.003 0.972 1.445
S 2.295 5.618 0.390 0.471 0.496
T 2.286 5.652 0.377 0.460 0.558
U 2.617 5.752 0.354 0.246 0.377
V 2.295 6.076 0.590 0.616 0.622
W 2.541 6.076 0.101 0.097 0.032
aFor peak designation see Figure S7 In the Supporting Information. bBold entries indicate
Figures
![Table 3: Comparison of normalized integrals for selected cross-peaks in different 2D [1H, 1H]](https://thumb-us.123doks.com/thumbv2/123dok_us/1602513.113107/19.595.108.487.140.581/table-comparison-normalized-integrals-selected-cross-peaks-different.webp)