Dynamic Network Centrality Summarizes
Learning in the Human Brain
Alexander V. Mantzaris
∗Danielle S. Bassett
†Nicholas F. Wymbs
‡Ernesto Estrada
§Mason A. Porter
¶Peter J. Mucha
kScott T. Grafton
∗∗Desmond J. Higham
††December 7, 2012
Abstract
We study functional activity in the human brain using functional Magnetic Resonance Imaging and recently developed tools from net-work science. The data arise from the performance of a simple be-havioural motor learning task. Unsupervised clustering of subjects with respect to similarity of network activity measured over three days
∗Department of Mathematics and Statistics, University of Strathclyde, UK
†Department of Physics, University of California, Santa Barbara, CA 93106, USA; Sage
Center for the Study of the Mind, University of California, Santa Barbara, CA 93106, USA
‡Department of Psychological & Brain Sciences, University of California, Santa
Bar-bara, CA 93106, USA
§Department of Mathematics and Statistics, University of Strathclyde, UK
¶Oxford Centre for Industrial and Applied Mathematics, Mathematical Institute,
Uni-versity of Oxford, Oxford OX1 3LB, UK; CABDyN Complexity Centre, UniUni-versity of Oxford, Oxford, OX1 1HP, UK
kCarolina Center for Interdisciplinary Applied Mathematics, Department of
Mathe-matics, University of North Carolina, Chapel Hill, NC 27599-3250, USA; Institute for Advanced Materials, Nanoscience & Technology, University of North Carolina, Chapel Hill, NC 27599-3216, USA
∗∗Department of Psychological & Brain Sciences, University of California, Santa
Bar-bara, CA 93106, USA
of practice produces significant evidence of ‘learning’, in the sense that subjects typically move between clusters (of subjects whose dynamics are similar) as time progresses. However, the high dimensionality and time-dependent nature of the data makes it difficult to explain which brain regions are driving this distinction. Using network centrality measures that respect the arrow of time, we express the data in an extremely compact form that characterizes the aggregate activity of each brain region in each experiment using a single coefficient, while reproducing information about learning that was discovered using the full data set. This compact summary allows key brain regions con-tributing to centrality to be visualized and interpreted. We thereby provide a proof of principle for the use of recently proposed dynamic centrality measures on temporal network data in neuroscience.
1
Motivation
A network-science perspective can give valuable insights into neuroscience data sets [5]. In particular, it is useful for summarizing and comparing net-work properties in terms of a few key features [6, 8, 26], discovering cohesive groups of cortical regions and other important patterns [1, 7, 16], and iden-tifying important (i.e., ‘central’) brain regions [28, 35].
Research on networks in neuroscience has focused primarily on static situ-ations (because this allows one to use well-established tools [24]), but the rich temporal sampling produced by neurophysiological methods, including func-tional magnetic resonance imaging (fMRI), offers the opportunity to study network properties that vary over time. Such dynamic ortemporal networks arise in many other applications—including mobile phone communication [25], interactions in online social networks [32], criminal activities [29], vot-ing in political bodies, and much more [15]. One way to study temporal networks is to develop time-dependent generalizations of classical network ‘centrality’ measures [33, 24], which are designed to measure which nodes (or other network structures) are important in a network. Different notions of centrality correspond to different notions of what it means for a node or edge to be important.
previ-ously analysed data. Its novelty lies in (a) showing for the first time that the method has value in this neuroscience setting, and (b) interpreting these results. In particular, we show that the method allows us to extract highly compressed and easy-to-interpret summaries at the level of brain regions that characterize changes occurring through learning. The work also provides fur-ther evidence that time-dependent fMRI data can contain meaningful infor-mation when regarded as a time-dependent network.
The remainder of this paper is organized as follows. In Section 2, we discuss the data that we use and what we aim to achieve in our analysis. In Section 3, we review ‘communicability’ in dynamic networks. We present our results in Section 4, and we discuss their implications in Section 5.
2
Data and Aims
We study brain activity using the noninvasive neuroimaging technique of fMRI, which provides a quantitative measurement of regional changes in blood oxygen level dependent (BOLD) signals that are determined in part by changes of local neuronal activity [21]. Our goal in this study is to identify meaningful temporal patterns related to functional brain networks changing over a time scale of minutes to days. We therefore examine fMRI data that was acquired during a simple learning task in which 20 subjects practiced short sequences of finger movements (12 movements per sequence type) over the course of 3 days [1, 34]. Our data set is therefore composed of 60 exper-imental sessions.
We construct dynamic functional brain networks by first parcellating the brain into 112 anatomically distinct areas, which we represent as network nodes. We then partition the mean signal from each of these regions from all experimental sessions into 25 time steps of roughly 3 minute duration each (corresponding to time series of 80 units in length). Thus, the full experiment consists of 25 time steps per subject. To estimate the interactions (i.e., the edge weights) between nodes, we calculate a measure of statistical similarity between regional activity profiles. Using a wavelet transform, we extract frequency-specific activity from each time series in the range 0.06–0.12 Hz. For each subject s, each experimental dayd, each time step t, and each pair of regions i and j, we define the weight of an edge connecting regions i and
the elements of a weighted temporal network A with components hA[s,dt]i
i,j,
where s∈ {1,· · · ,20}, d∈ {1,2,3}, and t∈ {1,· · · ,25}.
We used a statistical correction (the false discovery rate) to threshold all connections for which we were not confident that the coherence value was significantly greater than that expected between random variables, and we then binarized the data. Specifically, hA[s,dt]i
i,j
= 1 if and only if the fMRI
time series from regionsiandjdemonstrates statistically significant temporal coherence for subject s on dayd at thetth time step of the experiment. We set all other hA[s,dt]i
i,j
to 0. We kept approximately 9% of the measured
connections (i.e., the edges) as statistically significant. We can therefore view each experiment as a time-ordered sequence of 25 binary, symmetric adjacency matrices of dimension 112×112. We also note that each diagonal entry hA[s,dt]i
i,i = 0.
In a previous examination of this data, we used time-dependent commu-nity detection [23] to identify statistically significant temporal evolution of network organization over time [1]. We found that network ‘flexibility’, mea-sured in terms of the time-varying allegiance of nodes to communities, in one experimental session predicted the relative amount of learning demonstrated in a future session. Our goal in the present work is to use a complementary approach, based on a recently proposed notion of temporal network centrality that respects the arrow of time [13], to examine the data from a different per-spective. Methods to study temporal networks are being developed rapidly, and they need testbed examples. It is therefore crucial to apply multiple viable approaches to the same data and evaluate the different insights and perspectives that they offer. Very recent work has examined static centrality measures in functional brain networks [19], and our work generalizes such perspectives to time-dependent situations.
3
Dynamic Communicability
network, in which connections can appear and disappear, it is important to consider routes through the network that respect the arrow of time. For example, suppose that nodes a and b are connected today via an undirected edge and that nodesb andcare connected tomorrow via an undirected edge. The route a 7→b 7→ccan thus be traversed over the course of the two days. However, unless there are other edges, the reverse route from c to a cannot be taken, as the arrow of time introduces an asymmetry in the information flow [15].
Reference [13] quantified the ability of a node i to send information to nodej across a time-dependent network by summing over all dynamic walks
fromitoj. A dynamic walk is any traversal that respects the time ordering— after reaching a node, it can continue along any edge that currently, or sub-sequently, involves that node. If we suppose that walks that traverse more edges are less relevant than those that traverse fewer edges, then the con-tribution to the sum from a walk that uses w edges is scaled by αw. The parameterα∈(0,1) governs the extent to which we downweight a walk based on the number of edges that compose it. This methodology was introduced by Katz [17] for static, unweighted, undirected networks. (Also see the inter-pretation in [4].) Katz noted that α can be interpreted as the independent probability that information successfully traverses an edge. Importantly, be-cause we binarize the data, we retain a dynamic analog of this interpretation in the networks that we study in the present paper.
The aforementioned pairwise summary, which suggests how effectively nodeican communicate with nodej, is computed readily as the (i, j) element in a product of matrix resolvents:
Ps,d :=
I−αA[1]s,d
−1
I−αA[2]s,d
−1
· · ·I−αA[25]s,d
−1
. (1)
To explain further, we first note that resolvents can be expanded in power series:
(I−αA)−1 =I+αA+α2A2+· · · .
It then follows that the right-hand side of (1) combines all possible time-ordered matrix products (appropriately scaled). For example, we obtain terms such as the following:
• α3A[2]
s,dA
[4]
s,dA
[4]
s,d, whose (i, j) element gives a scaled count of the number
of dynamic walks that involve one edge at time point t = 2 and two edges at time point t = 4.
In practice, we use a normalized version,
Qs,d:=
Ps,d
k Ps,dk2
, (2)
where k · k2 denotes the Euclidean norm, in order to avoid underflow and
overflow. The matrix inverses in (1) exist as long as α < α?, where α? is the
reciprocal of the maximum eigenvalue (in modulus) over all of the individual adjacency matrices. In this work, we use the valueα = 0.9α?. As discussed in
[13, 22], averaging the connectivity information over time and computing the Katz centrality for this static summary (thereby ignoring the time ordering) can produce significantly different results. Accordingly, it is important to use a method that respects the time-dependent nature of the problem.
The matrix entries{[Qs,d]nj}112j=1 quantify the ability of nodento
dissem-inate information to each node in a network. One can sum over the elements in the nth row to compute an aggregate broadcast strength b(n) for node
n. Similarly, by summing over the elements in the nth column of [Qs,d], we
quantify the ability of nodento receive information using thereceive strength
r(n). This yields the broadcast centrality
b(n)s,d:=
112
X
j=1
(Qs,d)nj (3)
and receive centrality
r(n)s,d :=
112
X
i=1
(Qs,d)in (4)
from [13].
4
Results
We seek brain signatures that reflect learning-related changes as subjects acquire a new motor skill and improve in performance. We do this by treat-ing each experimental session as a data point and performtreat-ing unsupervised
k-means clustering [10] to separate the experiments into two groups. We then view the clusters in terms of their subject/day identifications (IDs) to determine whether the two clusters represent different stages of learning.
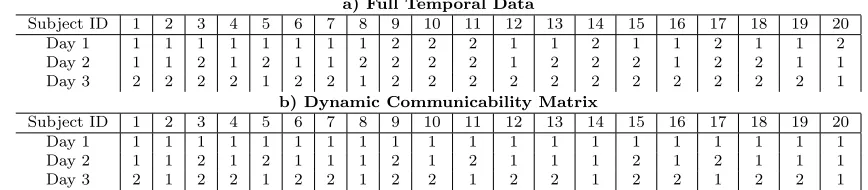
In Table 1(a), we show the clustering that we obtain when we represent each experiment using its full set of connectivity data—i.e., when we stack the matrices {A[s,dt]}25
t=1 column by column into a single vector of dimension
112×112×25 = 313,600. We hypothesize that cluster 2 might represent a higher level of ‘ability’ or ‘experience’ and hence that moving from cluster 1 to cluster 2 represents the result of learning. To be more concrete, we regard the data clustering as a ‘success’ for subject s if the cluster label does not decrease either between days 1 and 2 or between days 2 and 3. In other words, a subject is successful if he/she does not exhibit a decrease in learning-related changes in brain function. For example, subject number 1 in Table 1(a) has the sequence 1,1,2 and subject number 3 has the sequence 1,2,2. We regard both subjects as successful. Subject number 9, who has the sequence 2,2,2, is also successful. However, subject number 5 has the sequence 1,2,1, and we therefore regard this subject as not successful. In total, the 20 subjects exhibit 17 successes and 3 failures (subjects 5, 8, and 20). Using a permutation test, where we redistribute cluster labels A and
B uniformly at random across experiments and map the labels A and B to the labels 1 and 2 in a way that minimizes the number of failures, we find that the achievement of 17 or more successes has a p-value of p ≈ 0.0025. For this example (as well as all of our otherk-means computations), we note that multiple runs with different starting values yield very similar results.
In Table 1(b), we show the corresponding results that we obtain when we summarize each experiment (of 25 time points) using its dynamic com-municability matrix (2), which we stack column by column into a vector of dimension 112×112 = 12,544. We again observe 17 successful subjects and 3 failures (subjects 5, 11, and 17).
a) Full Temporal Data
Subject ID 1 2 3 4 5 6 7 8 9 10 11 12 13 14 15 16 17 18 19 20
Day 1 1 1 1 1 1 1 1 1 2 2 2 1 1 2 1 1 2 1 1 2
Day 2 1 1 2 1 2 1 1 2 2 2 2 1 2 2 2 1 2 2 1 1
Day 3 2 2 2 2 1 2 2 1 2 2 2 2 2 2 2 2 2 2 2 1
b) Dynamic Communicability Matrix
Subject ID 1 2 3 4 5 6 7 8 9 10 11 12 13 14 15 16 17 18 19 20
Day 1 1 1 1 1 1 1 1 1 1 1 1 1 1 1 1 1 1 1 1 1
Day 2 1 1 2 1 2 1 1 1 2 1 2 1 1 1 2 1 2 1 1 1
[image:8.612.103.537.129.224.2]Day 3 2 1 2 2 1 2 2 1 2 2 1 2 2 1 2 2 1 2 2 1
Table 1: Results of unsupervised k-means clustering into two groups, dis-played by subject and by day, using (a) the full temporal data (which has dimension 313,600) and (b) by summarizing each experiment in terms of the dynamic communicability matrix (2) (which has dimension 112×112 = 12,544). We also obtain the same results as in panel (b) using a vector of either the broadcast centralities (3) or receive centralities (4). Each of these descriptions has a dimension of only 112.
identical results as with the 12,544-dimensional description.
The aforementioned results suggest (i) that there is evidence that the fMRI data has captured a learning effect, and (ii) that the evidence remains intact even when we vastly reduce the dimension of the data by using only broadcast or receive centrality measures, which have a natural interpretation in terms of quantifying the ability of a brain region to distribute or collect information.
aggre-gate decrease shown in Fig. 1A. To do this, we normalize the broadcast and receive centrality vectors from the 60 communicability matrices separately. For each region, we then test whether the normalized centrality values dif-fer significantly in day 1 versus day 3 using a permutation test in which we permuted the day 1 and day 3 labels uniformly at random. We find that no brain region demonstrates a significant decrease in either normalized broad-cast centrality or normalized receive centrality from day 1 to day 3 (p >0.01; uncorrected for multiple comparisons).
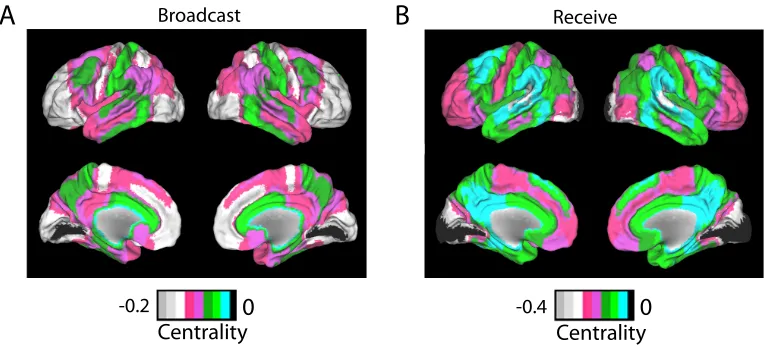
In light of the result that brain regions do not differ significantly from each other in the amount of centrality change with learning, one can study the change in anatomical distribution of centrality values by normalizing each experiment’s centrality values, aggregating the normalized regional compo-nents from all the 60 experiments, and then viewing the difference in the aggregations over regions (see Fig. 2). We find that there is a decrease in ag-gregate centrality over time for all regions, and that the decreases in dynamic centrality values are greatest in bilateral precentral gyri (primary motor cor-tex), medial segment of the superior frontal gyrus (supplementary motor area), superior parietal lobule, and medial occipital cortices. This constella-tion of regions is a core sensorimotor system for controlling a broad range of visually guided actions [2], including the motor task of this study. Of par-ticular note, two of these areas—the primary motor cortex and SMA—are consistently observed to demonstrate changes of local activity ([3, 12, 14]) as well as changes of correlated activity during sequence learning [31].
5
Discussion
0 0.2 0 0.1 0.2 0.3 0.4 0.5
0 0.1 0.2 0 0.1 0.2 0.3 0.4 0 0.1 0 0.05 0.1 0.15 0.2
Day 1 Day 2 Day 3 0 0.2 0.4 0.6 0.8 1 Broadcast Receive Cen tr alit y A B Broadcast Centrality Rec eiv e C en tr alit y
[image:10.612.114.497.125.277.2]Day 1 Day 2 Day 3
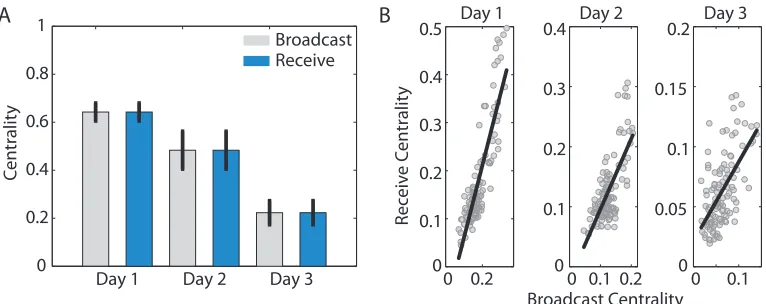
Figure 1: Broadcast and Receive Centralities Change with Task Learning.
(A) Bar graph showing broadcast (light) and receive (dark) centralities aver-aged over brain regions for day 1, day 2, and day 3 of the experiment. Error bars indicate standard deviations of the mean over subjects. (B)Scatterplots showing the Pearson correlations between broadcast and receive centralities for day 1 (correlation coefficient r ≈ 0.86; p-value p ≈ 2.4×10⁻³⁵), day 2
(r ≈ 0.71; p ≈ 6.6×10⁻¹⁹), and day 3 (r ≈ 0.60; p ≈ 1.8×10⁻¹²) of the
experiment.
task by using a more decentralized (but clustered) organization.
The development of new tools for investigating time-dependent networks would be extremely useful for distinguishing these various accounts of brain network modulation during learning. Indeed, it has been suggested that an understanding of such changes and their relationship to neural efficiency will require a more careful examination of functional connectivity patterns [18], which are thought to be better indications of neuronal communication than activity patterns alone [30]. The present paper highlights the potentially im-portant effect of temporal dynamics in the consideration of neural efficiency, and recent methodological advances for the investigation of time-dependent networks [15] now make it possible to pursue such efforts. We demonstrate decreases in functional connectivity patterns with task practice in early mo-tor learning, suggesting that the brain might require less communication between distributed functional networks as skills become more automatic.
B
A
Broadcast ReceiveCentrality Centrality
[image:11.612.116.501.127.300.2]-0.2 0 -0.4 0
Figure 2: Anatomical Distribution of decrease over time (Day 3 minus Day 1) in Broadcast and Receive Centralities. Broadcast (A) and receive (B)
centralities with normalized centrality vectors over subjects.
examination of functional neuroscience data using other experimental modes. Interest in studying whole-brain functional connectivity patterns in a network framework is growing steadily [5], in part because network science includes a large set of diagnostics that are built to directly examine system connectivity and can be used to characterize the brain’s structural organization. However, a study of the true dynamic nature of the brain requires the use of dynamic network diagnostics, the development of which is still in its early stages [15]. We have demonstrated in this paper that broadcast and receive centralities are useful diagnostics for the study of temporal brain networks, and they have the additional advantage of respecting the arrow of time. We expect such dynamic centrality measures to be similarly insightful in a wide variety of systems.
(FP7-ICT-2011-8; grant #317614) funded by the European Commission. AVM and DJH were supported by the Engineering and Physical Sciences Research Council/Research Councils UK Digital Economy programme through the MOLTEN (Mathematics of Large Technological Evolving Networks) project EP/I016058/1.
References
[1] D. S. Bassett, N. F. Wymbs, M. A. Porter, P. J. Mucha, J. M. Carlson, and S. T. Grafton, Dynamic reconfiguration of human
brain networks during learning, Proceedings of the National Academy of Sciences, 18 (2011), pp. 7641–7646.
[2] P. M. Bernier and S. T. Grafton, Human posterior parietal
cor-tex flexibly determines reference frames for reaching based on sensory context, Neuron, 68 (2010), pp. 776–788.
[3] A. Bischoff-Grethe, K. M. Goedert, D. T. Willingham, and S. T. Grafton, Neural substrates of response-based sequence learning
using fMRI, Journal of Cognitive Neuroscience, 16 (2004), pp. 127–138.
[4] P. Bonacich, Power and centrality: A family of measures, The Amer-ican Journal of Sociology, 92 (1987), pp. 1170–1182.
[5] E. Bullmore and O. Sporns, Complex brain networks: graph
the-oretical analysis of structural and functional systems, Nature Reviews Neuroscience, 10 (2009), pp. 186–198.
[6] J. J. Crofts and D. J. Higham, A weighted communicability mea-sure applied to complex brain networks, Journal of the Royal Society: Interface, 33 (2009), pp. 411–414.
[7] , Googling the brain: Discovering hierarchical and asymmetric net-work structures, with applications in neuroscience, Internet Mathemat-ics, 7 (2011), pp. 1–22.
[8] L. Deuker, E. T. Bullmore, M. Smith, S. Christensen, P. J. Nathan, B. Rockstroh, and D. S. Bassett, Reproducibility of
[9] E. Estrada, The Structure of Complex Networks, Oxford University Press, Oxford, 2011.
[10] G. Gan, C. Ma, and J. Wu, Data Clustering: Theory, Algo-rithms, and Applications, Society for Industrial and Applied Mathe-matics, Philadelphia, PA, 2007.
[11] E. W. Gobel, T. B. Parrish, and P. J. Reber,Neural correlates of skill acquisition: decreased cortical activity during a serial interception sequence learning task, NeuroImage, 58 (2007), pp. 1150–1157.
[12] S. Grafton, E. Hazeltine, and R. Ivry, Functional mapping of sequence learning in normal humans, Journal of Cognitive Neuroscience, 7 (1995), pp. 497–510.
[13] P. Grindrod, D. J. Higham, M. C. Parsons, and E. Estrada,
Communicability across evolving networks, Physical Review E, 83 (2011), p. 046120.
[14] S. T. Hazeltine, E. Grafton and R. Ivry,Attention and stimulus
characteristics determine the locus of motor-sequence encoding. a PET study., Brain: A Journal of Neurology, 120 (1995), pp. 123–140.
[15] P. Holme and J. Saram¨aki, Temporal networks, Physics Reports, 519 (2012), pp. 97–125.
[16] H. Johansen-Berg, T. E. J. Behrens, M. D. Robson, I. Drob-njak, M. F. S. Rushworth, J. M. Brady, S. M. Smith, D. J. Higham, and P. M. Matthews,Changes in connectivity profiles
de-fine functionally-distinct regions in human medial frontal cortex, Pro-ceedings of the National Academy of Sciences, 101 (2004), pp. 13335– 13340.
[17] L. Katz, A new index derived from sociometric data analysis, Psy-chometrika, 18 (1953), pp. 39–43.
[18] A. M. Kelly and H. Garavan, Human functional neuroimaging
[19] M.-T. Kuhnert, C. Geier, C. E. Elger, and K. Lehnertz,
Iden-tifying important nodes in weighted functional brain networks: A com-parison of different centrality approaches, Chaos, 22 (2012), p. 023142.
[20] S. M. Landau and M. D’Esposito, Sequence learning in pianists
and nonpianists: an fMRI study of motor expertise, Cognitive, Affective & Behavioral Neuroscience, 6 (2006), pp. 246–259.
[21] N. Logothetis, J. Pauls, M. Augath, T. Trinath, and A. Oel-termann,Neurophysiological investigation of the basis of the fMRI
sig-nal, Nature, 412 (2001), pp. 150–157.
[22] A. V. Mantzaris and D. J. Higham,A model for dynamic
commu-nicators, European Journal of Applied Mathematics, 23 (2012), pp. 659– 668.
[23] P. J. Mucha, T. Richardson, K. Macon, M. A. Porter, and J.-P. Onnela, Community structure in time-dependent, multiscale, and
multiplex networks, Science, 328 (2010), pp. 876–878.
[24] M. E. J. Newman, Networks: An Introduction, Oxford University Press, 2010.
[25] J.-P. Onnela, J. Saram¨aki, J. Hyv¨onen, G. Szab´o, D. Lazer, K. Kaski, J. Kert´esz, and A. L. Barab´asi, Structure and tie
strengths in mobile communication networks, Proceedings of the Na-tional Academy of Sciences, 104 (2007), pp. 7332–7336.
[26] M. Rubinov and O. Sporns, Complex network measures of brain
connectivity: uses and interpretations, NeuroImage, 52 (2010), pp. 1059– 1069.
[27] S. M. Smith, K. L. Miller, M. Webster, G. Salimi-Khorshidi, C. F. Beckmann, T. E. Nichols, J. D. Ramsey, and M. W. Woolrich, Network modelling methods for fMRI, NeuroImage, 54 (2011), pp. 875–891.
[29] A. Stomakhin, M. B. Short, and A. L. Bertozzi,
Reconstruc-tion of missing data in social networks based on temporal patterns of interactions, Inverse Problems, 27 (2011), p. 115013.
[30] F. T. Sun, L. M. Miller, and M. D’Esposito, Measuring
inter-regional functional connectivity using coherence and partial coherence analyses of fMRI data, NeuroImage, 21 (2006), pp. 647–658.
[31] F. T. Sun, L. M. Miller, A. A. Rao, and M. D’Esposito,
Func-tional connectivity of cortical networks involved in bimanual motor se-quence learning, Cerebral Cortex, 120 (2007), pp. 1227–1234.
[32] M. Szell, R. Lambiotte, and S. Thurner, Trade, conflict and
sentiments: Multi-relational organization of large-scale social networks, Proceedings of the National Academy of Sciences, 107 (2010), pp. 13636– 13641.
[33] S. Wasserman and K. Faust,Social Network Analysis: Methods and
Applications, Cambridge University Press, Cambridge, 1994.
[34] N. F. Wymbs, D. S. Bassett, P. J. Mucha, M. A. Porter, and S. T. Grafton,Differential recruitment of the sensorimotor putamen
and frontoparietal cortex during motor chunking in humans, Neuron, 74 (2012), pp. 936–946.
[35] K. Zawadzki, C. Echtermeyer, M. P. Viana, M. Kaiser, and L. d. F. Costa,Morphological homogeneity of neurons: Searching for