City, University of London Institutional Repository
Citation
:
Sikora, I., Stanislav, P. and Bazijanac, E. (1999). The Example of Laptop Based
Performance Data Generating and Optimisation in Contemporary Commercial Aircraft
Operations. Paper presented at the ISEP '99, 7 - 8 Oct 1999, Ljubljana, Slovenia.
This is the unspecified version of the paper.
This version of the publication may differ from the final published
version.
Permanent repository link:
http://openaccess.city.ac.uk/2583/
Link to published version
:
Copyright and reuse:
City Research Online aims to make research
outputs of City, University of London available to a wider audience.
Copyright and Moral Rights remain with the author(s) and/or copyright
holders. URLs from City Research Online may be freely distributed and
linked to.
City Research Online:
http://openaccess.city.ac.uk/
[email protected]
THE EXAMPLE OF LAPTOP BASED PERFORMANCE DATA
GENERATING AND OPTIMIZATION IN CONTEMPORARY
COMMERCIAL AIRCRAFT OPERATIONS
Mr. sc. Ivan Sikora, Emirates Airline, Dubai
Dr. sc. Stanislav Pavlin, Faculty of Traffic Engineering, Zagreb University
Dr. sc. Ernest Bazijanac, Faculty of Traffic Engineering, Zagreb University
Summary
Airframe and engine combination gives equal potential to every operator with such a hardware
combination. Operator's way of utilization makes its use to the maximum or less. Data related to
aircraft performance is one of the basic elements in daily aircraft operations and optimal
utiliza-tion of airframe and engine combinautiliza-tion in real life environment. New technological soluutiliza-tions and
systems affected performance data calculation. Today's laptop computer technology has already
boarded the flight deck together with pilots.
This paper is to present possible structure and proposed application of one of the system together
with envisaged effects of its use in real life commercial aircraft operations. It will present the
over-view of the system with considerations taken into account when designing and developing it; it's
potentials and advantages compared to paper based performance data calculation and
optimiza-tion: and the most important how it is understood as a tool in very demanding, unpredictable
air-line operations of today
1.
INTRODUCTION
This paper is intended to present structure and proposed application of one of the removable per-sonal computers (LAPTOPS) based aircraft take off performance calculation system together with en-visaged effects of its use in real life commercial aircraft operations.
Performance data calculation and optimization reflect through the whole airline operation. They are related to flight safety as the ultimate concern in airline’s operation. Data availability and easy recal-culation make airline's operation more safeguarded to operation disruptions and ad hoc modifications due to elements of today's very demanding traffic environment. Finally, the quality of data reflects on airline's bottom line at the end of the year as the re-sult of possible savings in different areas of opera-tion.
New technological solutions and systems have affected aircraft performance calculation. Early air-craft operations' paper based performance data cal-culation was subsequently modified to computer based calculation and rather facilitated optimiza-tion. Today's laptop computer technology has al-ready boarded flight deck together with pilots. Their compact size made their utilization in such a
confined space very easy. Commercial Of the Shelf (COTS) equipment of today is so powerful in terms of computation speed and memory storage that cal-culation and recalcal-culation time is just a fraction of time needed for a manual calculation.
In order to present it, authors have tested the system on real life data related to airline operating conditions and aircraft. This data was compared to already known data related to pilots performance while doing same tasks in commercial aircraft fly-ing. Although conclusion made upon this can not be generalized, as they are valid only for tested hard-ware, softhard-ware, airports, and aircraft types, they have served the purpose of demonstrating ad-vantages of such a system to manual calculation so common in today’s aviation.
The paper is intended to present the overview of system with considerations taken into account when designing and developing it; it's potentials and ad-vantages compared to paper based performance da-ta calculation and optimization; and the most im-portant - how it is understood as a tool in very de-manding, unpredictable airline operations of today. Here are some terms related to airline industry terminology, not commonly used, in order to follow the paper easily:
TAKE OFF PERFORMANCE Take off
2 that describe take off from particular runway at giv-en meteorological conditions (temperature, atmos-pheric pressure, wind speed and direction) and air-craft conditions.
FLIGHT OPERATIONS a part of every airline
responsible for daily flying together with operations short term and long term planning and feed back analyzing from available flight data.
PAYLOAD weight (passengers, baggage, cargo
and post) that generates income based on paid pas-senger and cargo tariffs.
FLEXIBLE TAKE-OFF – take-off at lower than
maximum thrust setting allowed when taking-off at lower gross aircraft weights. This take-off mode re-sults in lower engine wear.
2.
AIRLINE OPERATIONS
ENVIRONMENT
2.1
In the Past
Commercial flying of today differs in hardware used from the time in early 50s when first jet transport aircraft entered service. [1] Although main visible differences to passengers are in the size and comfort of aircraft the most substantial changes are not so visible. Power plant technology together with pilot to aircraft interface has experi-enced tremendous changes. It would not be strange if some of the pilots from the early days sit in the cockpit of today staring at completely different en-vironment.
Instrumentation and interface leap has happened with the ‘new generation’ Airbus and Boeing air-craft. The Airbus A320 family aircraft cockpit of 80s compared to the A300 cockpit early 70s demonstrates reduced workload and improved safe-ty. [2] The same situation is comparing the Boeing B777 aircraft cockpit to any of it’s aircraft prior to it.
2.2
At Present Stage
Although pilot environment has gone through improvements and changes in general there are still some very strong links to the previous “era”. Most of those links are due to widespread use of paper documentation and “classical” tools for aircraft per-formance determination and calculating.
Nowadays, airlines either subcontract or calcu-late take off performance for their aircraft by them-selves. This data is presented in the form of tables showing the combination of either temperatures and winds or aircraft weights and winds. Take off per-formance tables calculation is done by computers and dedicated aircraft manufacturers’ software.
Each runway requires separate table and there are multiple tables for every runway depending on the number of other specific conditions that airline wants to cover (flap settings, air conditioning and
anti ice settings, different malfunctions on aircraft systems). [4]
Having in mind all said it is obvious that there are large number of different tables a crew needs to perform initial preparation and final calculation of their take off performance for each flight. Crew se-lects particular table that corresponds to their take off situation (runway, meteorological conditions, aircraft condition). In case there are some devia-tions from standards set at the time of table produc-tion they also have to perform some calculaproduc-tions to apply prescribed corrections making their calcula-tion valid for given take off condicalcula-tions.
2.3
Projected in the Future
Contemporary LAPTOP computer technology has brought improved computational and memory storage power and their reduced size. All this has lead to the idea of their application in everyday cal-culation just prior to take off at particular airport. Main grounds for this decision were: short recalcu-lation time in the case of change among conditions describing take off, and improved precision during calculation process and in final results.
There are two distinct steps proposed by Airbus Industrie for implementing this idea into the life. The first proposed step is implementing low cost commercially available computers for enhanced flight operations functions (take off performance calculation, weight and balance calculation). Hard-ware for this step comprises of LAPTOP powered by batteries that need recharge at aircraft power supply.
Next step would be aircraft server linked to avion-ics and two LAPTOPS. This hardware combination would be used for aircraft manuals update, en-hanced flight operations functions, and maintenance data transfer through wireless gate-links at speed 100 times faster than today’s Aircraft Communica-tion and Reporting System (ACARS). [3]
Implementation of the first step is intended to ensure wider acceptance among airlines by using today’s technology and limited aircraft cockpit modifications. Only after initial two phases it is en-visaged incorporating the idea in the cockpit layout. This step is to be available sometimes after 2005 with the introduction of the Airbus A3XX airliner into commercial service. [4]
3.
SYSTEM’S STRUCTURE
The whole laptop based performance data gen-erating and optimization system consists of two dis-tinct modules. They are:
1. Raw data creation and system setting mod-ule,
2. LAPTOP based performance data calcula-tion module.
Each of these modules requires particular hard-ware characteristics (in terms of Central Processor Unit (CPU) speed, and display resolution) that al-low user to make system’s performance exploited at their best.
Today’s version of software is based on Win-dows 95 operating system. The issue of system sta-bility hasn’t been addressed during initial test phase. Decision whether it will be Windows 95 or Windows NT together with the possible use of Windows Server operating system, just because of convenient networking of laptops, are left for each airline’s discretion.
3.1
Raw Data Creating and System Setting
Module
This module is basically office based work-station. It requires at least Pentium CPU with clock speed of not less than 200 MHz. The main func-tions of this module are:
setting airline’s policy regarding: the use of units of measurement, regulatory set mini-mal requirements and conventions, together with standard operating procedures adopt-ed by airline itself.
defining airline’s fleet for which program will be used: setting aircraft registry, and setting aircraft design maximum weights.
setting runway characteristics for all air-ports, that airline is flying at, with specific fleet. Runway characteristics are defined in terms of specific runway lengths, airport el-evation referred to mean sea level, and ob-stacles in take off direction (their distance and height). [2]All data related to aircraft and engine character-istics are supplied by aircraft manufacturer. Pres-ently, that is still done by CD-ROM. At the final stage in the future this will be done on line just to avoid obsolete data and make this process less time sensitive.[3]
3.2
LAPTOP Based Performance Data
Calculation Module
The main visible element of the whole system to pilots is LAPTOP computer. It is still not decided
whether it will be assigned to each pilot in com-mand or just be a part of the documents and equip-ment required for each flight.
Minimum hardware characteristics for LAPTOP are Pentium CPU with system clock not less than 200 MHz and display of minimum 33 cm diagonal.
The system is used for performance calculation at the present stage of it’s development. In next phases it is projected that other modules will be in-corporated as well. That will make system more valuable in day-to-day operation. Aircraft weight and balance calculation interacting with take off performance data calculation is the first step. Mod-ules that will adjust aircraft performance according to malfunctions present at a particular flight will be incorporated later on.
Raw data created in the office is transferred to LAPTOPs using some of the existing magnetic or optic media for data transfer. It is of very high im-portance to ensure full synchronization of data be-tween originator of data and all LAPTOPs in use. Comparing one ore more floppy disks or even one CD-ROM to more than hundred paper pages (that are updated regularly for a just slight runway change) proves system’s advantages over paper based performance calculation. The gain is in re-duced workload and cost, together with improved efficiency and safety.
4.
SYSTEM’S TASKS
LAPTOP based performance data calculations and optimization employs the same algorithms that are nowadays used for creating paper based tabu-lated performance data. There are two distinct algo-rithms that differ in precision and time required for calculation:
1. Polynomial, 2. 1st Principle, 3. Neural. [5]
While polynomial advantage is it’s speed of calculation, 1st Principle generates more precise re-sults. It has always been a trade between those two categories.
4 1st Principle method on the other hand improves precision at the price of time required for calcula-tion. Calculation is performed based on basic
aero-dynamic and aircraft engine thermoaero-dynamic equa-tions. They are supplied through three distinct da-tabases pertinent to each aircraft type and model. Each value is generated knowing aircraft condition data, meteorological conditions data, and other sig-nificant influential conditions (aircraft malfunctions and runway condition just to mention some of them).
New generation software for aircraft perfor-mance data calculation and optimization, that au-thors have evaluated and worked with, employs the third calculation mode – neural functions. They modify themselves in order to give sought output upon certain input. [5]
Long term experience using polynomial calcu-lations has built knowledge about output as the re-sult of known set of input values. For example: what weight aircraft can have when taking off at 20°C and wind of 10 knots? Knowing the trait of neural functions, aircraft performance data can be calculated and optimized at acceptable (shorter) time.
Understanding the environment in which LAP-TOP is used, neural functions are the best solution so far. Time consuming 1st Principle calculation is out of question in short time available for planning the next flight, while results after polynomial calcu-lation have payload trade offs. Therefore neural functions are solely applied in LAPTOP environ-ment.
4.1
Real Life Benefits
In real life today, the main aircraft performance calculation is based on tabulated data. Simple mathematical manipulations are used to reach fig-ures necessary for setting thrust of aircraft power- plants and reference speed values for certain pilot actions. Each combination of thrust setting and
me-teorological conditions results in distinct value of allowed aircraft weight.
Although all required pilot calculations are sim-ple, they give safe, but not always optimal values. In long term there are two potential loss generators:
Unrealized revenueunrealized revenue is the result of conservative polynomial calculation used for producing tab-ulated data regularly. Lower than optimal air-craft weight originates from conservative na-ture of polynomial calculation.
Increased maintenance costsincreased maintenance costs can not be as-sessed directly. Annual balance sheet proves that higher than required thrust settings result in aircraft engine deterioration. More precise calculation of reference temperature for thrust setting results in accurate thrust value for given meteorological conditions thus eliminating ex-cessive wear of engines.
4.2
Real Life Example
Let us present three distinct advantages of LAPTOP performance calculation compared to manual calculation.
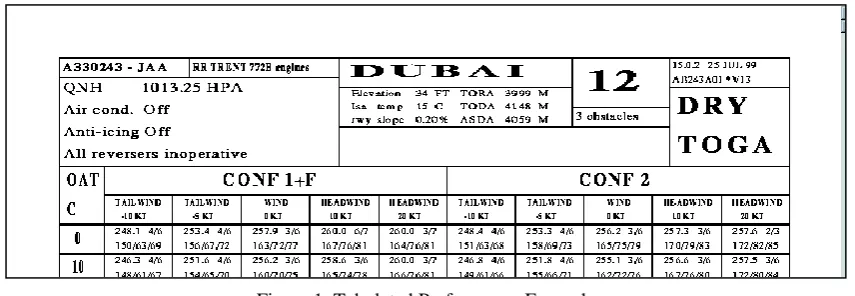
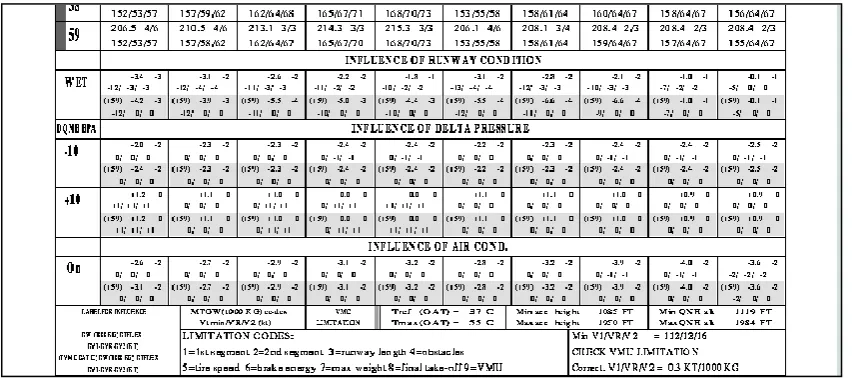
Assume that aircraft is taking off from a runway 02W at generic airport with known set of obstacles along the take off path. Runway is wet, and atmos-pheric pressure is lower than standard value of 1013.25 hPa. Outside air temperature is 5°C. Air-craft is using anti ice system, while air conditioning system is set OFF for take off. There is wind of 10 kts (1kt0.514 m/s) blowing from 45°.
[image:5.595.88.516.124.272.2]Basic tabulated performance is computed for dry runway, standard meteorological conditions (air pressure of 1013.25 hPa, defined set of outside temperature values and a set of discrete wind values blowing down the runway) and standard aircraft configuration (Anti Ice System and Air Condition-ing System not engaged). (Figure 1.)
These baseline values are modified by pilots in order to meet actual status at the moment of calcu-lation (Values in Figure 2.). Each calcucalcu-lation can be considered valid at the time of calculation only. Approximate time for that process is not less than 10 minutes assuming quiet cockpit atmosphere and no distractions. After the initial calculation there is another recalculation check needed. If the calcula-tion case is simpler (closer to baseline condicalcula-tions with less modifications time can drop to 7 minutes at best).
LAPTOP calculation time for the same input values takes 15 s at maximum. It is very important that this time is for the case with maximum number of adjustments to standard values needed. Any sim-pler case takes from 10s to 14s. This is the first ad-vantage - shorter calculation time.
Comparing aircraft weight permitted for take off LAPTOP calculation in this example gives
207114,5 kg, while pilots calculation based on tab-ulated data leads to approximately 201.5 t. Differ-ence of 5614,5 kg is just because of improved cal-culation mode applied by LAPTOP and its numeri-cal precision. That is second advantage – unreal-ized revenue.
The third advantage is gained when aircraft is to take off at some weight lower that one permitted by actual meteorological conditions and aircraft status. LAPTOP calculation in given example leads to 1°C
higher temperature setting resulting in substantial savings in annual maintenance costs.
5.
CONCLUSION
LAPTOP based performance data generating and optimization as the idea is recent achievement in airline industry. It has arisen as a logical step forward in today’s aircraft cockpit layouts.
Numerous computers in contemporary cockpits have got another addition in the form of a LAP-TOP. Although it is still not integrated with other computers completely, it provides data to be insert-ed as inputs to them. Quality inputs can not lead to faulty or erroneous outputs.
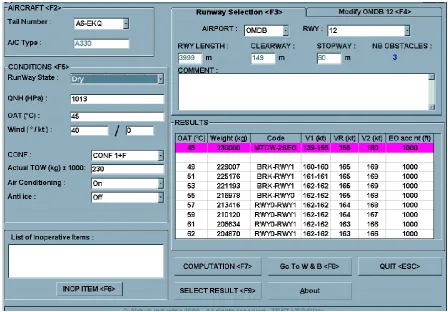
As the system has been designed by an aircraft manufacturer and tested in a group of different air-lines, it is meant to be adapted for commercial fly-ing. That is obvious from the intended and already incorporated characteristics (Figure 3.):
simple user interface (suited to different com-puter knowledge levels),
calculation initialization through runway des-ignator,
direct meteorological and aircraft condition in-puts, [image:6.595.88.516.80.269.2]
the selection between maximum payload and flexible take-off modes. [5]6 All listed characteristics should lead to easier
and more efficient usage and results.
User interface should bring more prompt
reac-tion to constantly changing operareac-tional situareac-tion at any large airport (i.e. switching from one runway to another, additional cargo or less passengers due to lost flight connection, etc.). Actual meteorological and aircraft condition data usage often allows extra weight loading, hence increasing commercial ef-fects of each flight. The choice between two take-off modes reflects on increased profit (by adding
revenue in case of maximum payload take-off or decreasing expenses in the long-term use of flexible take-off).
The system presented in the article is not unique in airline industry today. Some airlines have been using other systems for a while. Although sys-tems do not correspond to each other completely, all users agree – computer performance data calcu-lation in cockpits is quality step forward in airline industry.
6.
REFERENCES
[1] Alexander Wells, “Air Transportation, a management perspective”, Bellmont, 1989. p. 55
[2] “LPC Evaluation Package”, Airbus Indus-trie REF 945.7867/ 98, Toulouse, Novem-ber 1998.
[3] Docus Michael, “Less Paper In the Cock-pit”, 10th Performance and Operations
Conference, San Francisco, 1998. Chapter 06.
[4] Laval Chan Kam Fai, “Less Paper In the Cockpit Takeoff Module”, 10th
Perfor-mance and Operations Conference, San Francisco, 1998. Chapter 47.
[5] Laval Chan Kam Fai, “Octopus Improve-ments”, 10th Performance and Operations
[image:7.595.68.517.129.441.2]Conference, San Francisco, 1998. Chapter 48.