City, University of London Institutional Repository
Citation
:
Benetos, E. and Dixon, S. (2010). Multiple-F0 estimation of piano sounds
exploiting spectral structure and temporal evolution. Paper presented at the ISCA Tutorial
and Research Workshop on Statistical and Perceptual Audition, 25 Sep 2010, Makuhari,
Japan.
This is the unspecified version of the paper.
This version of the publication may differ from the final published
version.
Permanent repository link: http://openaccess.city.ac.uk/2770/
Link to published version
:
Copyright and reuse:
City Research Online aims to make research
outputs of City, University of London available to a wider audience.
Copyright and Moral Rights remain with the author(s) and/or copyright
holders. URLs from City Research Online may be freely distributed and
linked to.
City Research Online:
http://openaccess.city.ac.uk/
[email protected]
Multiple-F0 Estimation of Piano Sounds Exploiting Spectral Structure and
Temporal Evolution
Author 1
Affiliation 1
Removed for
double blind review
{author1}@sapa.org
Abstract
This paper proposes a system for multiple fundamental fre-quency estimation of piano sounds using pitch candidate selec-tion rules which employ spectral structure and temporal evolu-tion. As a time-frequency representation, the Resonator Time-Frequency Image of the input signal is employed, a noise sup-pression model is used, and a spectral whitening procedure is performed. In addition, a spectral flux-based onset detector is employed in order to select the steady-state region of the pro-duced sound. In the multiple-F0 estimation stage, tuning and in-harmonicity parameters are extracted and a pitch salience func-tion is proposed. Pitch presence tests are performed utilizing information from the spectral structure of pitch candidates, aim-ing to suppress errors occurraim-ing at multiples and sub-multiples of the true pitches. A novel feature for the estimation of har-monically related pitches is proposed, based on the common amplitude modulation assumption. Experiments are performed on the MAPS database using 8784 piano samples of classical, jazz, and random chords with polyphony levels between 1 and 6. The proposed system is computationally inexpensive, be-ing able to perform multiple-F0 estimation experiments in real-time. Experimental results indicate that the proposed system outperforms state-of-the-art approaches for the aforementioned task in a statistically significant manner.
Index Terms: multiple-F0 estimation, resonator time-frequency image, common amplitude modulation
1. Introduction
Multiple-F0 estimation in polyphonic music signals refers to the accurate detection of concurrent notes over a short time segment. It is the core problem in the development of auto-matic transcription systems, which have applications in mu-sic information retrieval, interactive computer systems, and au-tomated musicological analysis [1, 9]. While the problem of pitch estimation for monophonic music signals is considered to be solved, the creation of a system able to accurately detect harmonically-related F0s [16] without setting restrictions on the degree of polyphony and the instrument type still remains an open problem. For an overview on state-of-the-art multiple-F0 estimation systems the reader is referred to [4, 9].
There are several approaches for multiple-F0 estimation of music signals related to the current work. In [8], an iterative spectral subtraction method with polyphony inference is pro-posed, based on the principle that the envelope of harmonic sounds tends to be smooth. A magnitude-warped power spec-trum is used as a data representation and a moving average fil-ter is employed for noise suppression. The system is able to
handle inharmonicity and experiments were performed on ran-domly mixed samples from 30 musical instruments compiled from 4 different sources. In [16], a method for jointly evaluating multiple-F0 hypotheses is presented, which employs harmonic-ity, spectral smoothness, and synchronicity assumptions - the latter is based on the deviation of partials from their temporal centroid. A score function combining the aforementioned crite-ria is created and its parameters are optimized using an evolu-tionary algorithm. Experiments were performed with mixtures originating from the same sources as in [8].
A real-time polyphonic transcription system is proposed in [17], which uses a first-order complex resonator filterbank as a time-frequency representation, called the Resonator Time-Frequency Image (RTFI). F0 candidates are selected according to their pitch energy spectrum value and a set of rules is uti-lized in order to cancel extra estimated pitches. These rules are based on the number of harmonic components detected for each pitch and the spectral irregularity measure, which measures the concentrated energy around possibly overlapped partials from harmonically-related F0s. Finally, a method for multiple-F0 estimation of piano sounds is developed in [5], which mod-els the spectral envelope of pitches using a smooth autoregres-sive model constrained by the spectral smoothness principle and models the noise using a moving average model. A pitch salience function that is able to handle tuning and inharmonic-ity is proposed for initial candidate selection and the candidates are refined using a likelihood function which is dependent on the estimated spectral envelope and noise parameters. Experi-ments were performed on a database called MAPS, which con-tains real or synthesized recordings of isolated notes, musical or random chords, as well as music pieces, which were pro-duced by several piano types or using different recording con-ditions. Results, compared with the method in [8], indicate that the proposed system is particularly able to yield good scores when harmonically-related F0s are present.
and sub-multiples of the actual F0s. For the spectral structure rules, a more robust formulation of the spectral irregularity mea-sure [17] is proposed, taking into account overlapping partials. For the temporal evolution rules, a novel feature based on the common amplitude modulation (CAM) assumption [11] is pro-posed in order to suppress estimation errors in harmonically-related F0 candidates. Experiments were performed on the MAPS database [5] using over 8000 classical, jazz, and random piano chords, produced by 9 different piano types and recording conditions. Results indicate that the proposed system outper-forms the state-of-the-art approaches developed in [5] and [8] for the same experiment.
The remainder of the paper is as follows. In Section 2, the preprocessing steps used in the proposed system are described. The multiple frequency estimation system is detailed in Section 3. In Section 4 the employed dataset is presented, the experi-mental procedure is described, and results are discussed. Con-cluding remarks are drawn and future directions are pointed out in Section 5.
2. Preprocessing
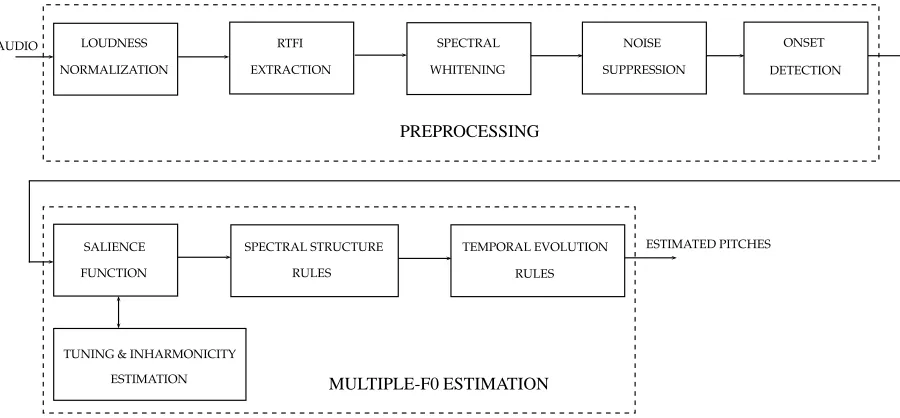
In this section, the preprocessing steps employed by the pro-posed multiple-F0 estimation system are described. These steps can also be seen in a diagram for the proposed system, which is displayed in Figure 1.
2.1. Resonator Time-Frequency Image
Firstly, the overall loudness of the time-domain input signal
x[n]is normalized to 70dB level. As a time-frequency repre-sentation, the RTFI was used [17]. The RTFI selects a first-order complex resonator filter bank to implement a frequency-dependent time-frequency analysis. It can be formulated as:
RT F I(t, ω) =s(t)∗IR(t, ω) (1)
where
IR(t, ω) =r(ω)e(−r(ω)+jω)t. (2)
s(t)stands for the input signal,IR(t, ω)is the impulse response
of the first-order complex resonator filter with oscillation fre-quencyωandr(ω)is a decay factor which additionally sets the frequency resolution.
For the specific experiments, a RTFI with constant-Q res-olution is selected for the time-frequency analysis, due to its suitability for music signal processing techniques, because the inter-harmonic spacing is the same for all pitches. The time interval between two successive frames is set to 40ms, which is typical for multiple-F0 estimation approaches [9]. A sam-pling rate of 44100Hz is considered for the input samples and the centre frequency difference between two neighbouring fil-ters is set to 10 cents (the number of bins per octavebis set to 120). The frequency range is set from 27.5Hz (A0) to 12.5kHz (which reaches up to the 3rd harmonic of C8). The employed absolute value of the RTFI will be denoted asX[n, k], wheren
is the time frame andkthe frequency bin.
2.2. Spectral Whitening and Noise Suppression
Spectral whitening is employed in order to flatten the dynamic range of the RTFI bins. Here, a modified version of the real-time adaptive whitening method proposed in [14] is applied. Each band is scaled, taking into account the temporal evolution of the signal, while the scaling factor is dependent only on past
frame values and the peak scaling value is exponentially decay-ing. The following iterative algorithm is applied:
Y[n, k] =
(
max(|X[n, k]|, c, aY[n−1, k]), n >0 max(|X[n, k]|, c), n= 0
X[n, k] ← X[n, k]
Y[n, k] (3)
whereais the peak scaling value andcis a floor parameter. In addition, a noise suppression approach similar to the one in [10] was employed, due to its computational efficiency. A half-octave span (60 bins) moving median filter is computed forX[n, k], resulting in noise estimateN[n, k]. Afterwards, an additional moving median filterN′[n, k]of the same span is applied, but only including the RTFI bins whose amplitude is less than the respective amplitude ofN[n, k]. This results in making the noise estimateN′[n, k]robust in the presence of spectral peaks that could affect the noise estimateN[n, k].
2.3. Onset Detection
In order to select the steady-state area of the produced note(s), a spectral flux-based onset detection procedure is applied. The spectral flux measures the magnitude changes in each frequency bin which indicate the attack parts of new notes [2]. It can be used effectively for onset detection of notes produced by per-cussive instruments such as the piano, but its performance de-creases for the detection of soft onsets [1]. For the RFTI, the spectral flux using the L1 norm can be defined as:
SF[n] =X
k
HW(|X[n, k]| − |X[n−1, k]|) (4)
whereHW(x) = x+|x|
2 is a half-wave rectifier. The resulting
onset strength signal is smoothed using a median filter with a 3 sample span (120ms length), in order to remove spurious peaks. Onsets are subsequently selected fromSF[n]by a selection of local maxima, with a minimum peak distance of 120ms. Af-terwards, the frames located between 100-300ms after the on-set are selected as the steady-state region of the signal and are averaged over time, in order to produce a robust spectral repre-sentation of the produced notes.
3. Proposed System
The algorithm that was created for multiple-F0 estimation ex-periments is described in this section. A diagram showing the stages of the proposed system is displayed in Figure 1.
3.1. Salience Function Generation
In the linear frequency domain, considering a pitchpof a pi-ano sound with fundamental frequencyf0pand inharmonicity
coefficientβp, partials are located at frequencies:
fhp=hf0p p
1 + (h2−1)βp (5)
whereh ≥1is the partial index [9, 13]. Consequently in the log-frequency domain, considering a pitchpat bink0p,
over-tones are located at bins:
khp=k0p+
b·log2(h) + b 2log2
1 + (h2−1)βp
(6)
AUDIO LOUDNESS NORMALIZATION
RTFI EXTRACTION
SPECTRAL WHITENING
NOISE SUPPRESSION
ONSET DETECTION
PREPROCESSING
SALIENCE FUNCTION
SPECTRAL STRUCTURE RULES
TUNING & INHARMONICITY ESTIMATION
TEMPORAL EVOLUTION RULES
ESTIMATED PITCHES
[image:4.595.72.522.72.281.2]MULTIPLE-F0 ESTIMATION
Figure 1: Diagram for the proposed multiple fundamental frequency estimation system.
A pitch salience functions[p, dp, βp]operating in the
log-frequency domain is proposed, which indicates the strength of pitch candidates:
s[p, dp, βp] = H X
h=1
max
mh
Z[khp+dp, mh]
(7)
where
Z[k, mh] = s
X
k+
bmh+
b
2log2(1 + (h2−1)β)
(8) and mh specifies a search range around overtone
posi-tions, belonging to the interval (ml
h, muh), where mlh = ⌈log2(h−1)+(M−1) log2(h)
M ⌋,m
u h=⌈(
M−1) log2(h)+log2(h+1)
M ⌋.
M is a factor controlling the width of the interval, which for the current experiments was set to 60. The salience function is applied to the averaged steady-state representation shown in Section 2.3.
While the employed salience functions in the linear fre-quency domain (ie. [10]) used a constant search space for each overtone, the proposed log-frequency salience function sets the search space to be inversely proportional to the partial index. The number of considered overtones H is set to 11 at maxi-mum. Tuning is also considered [15], with a tuning deviation
dp ∈ [−4, . . . ,4]for each pitch (thus having a tuning search
space of 80 cents around the ideal tuning frequency). The range of the inharmonicity coefficientβpis set between0and5·10−4,
which is typical for piano notes [13].
In order to accurately estimate the tuning factor and the inharmonicity coefficient for each pitch, a two-dimensional maximization procedure using exhaustive search is applied to
s[p, dp, βp]for each pitchp∈[21, . . . ,108]in the MIDI scale
withk0p = 10(p−21) + 1(corresponding to a note range
of A0-C8). This results in a pitch salience function estimate
s′[p], a tuning deviation vector and an inharmonicity coefficient vector. Using the information extracted from the tuning and inharmonicity estimation,, a harmonic partial sequenceV[p, h]
for each candidate pitch and its harmonics (which contains the RTFI values at certain bin) is also stored for further processing.
3.2. Spectral Structure Rules
A set of rules examining the harmonic partial sequence structure of each pitch candidate is applied, which is inspired by work from [1, 17]. These rules aim to suppress peaks in the salience function that occur at multiples and sub-multiples of the actual fundamental frequencies. In the semitone space, these peaks occur at±{12,19,24,28, . . .}semitones from the actual pitch. A first rule for suppressing salience function peaks is set-ting a minimum number for partial detection inV[p, h], similar to [1, 17]. Ifp < 47, at least three partials out of the first six need to be present in the harmonic partial sequence (since there may be a missing fundamental). Ifp ≥ 47, at least four par-tials out of the first six should be detected. A second rule con-cerns the salience value, which expresses the sum of the square root of the partial sequence amplitudes. If the salience value is below a minimum threshold (set to 0.2 using the development set explained in Section 4.1), this peak is suppressed. Another processing step in order to reduce processing time is the reduc-tion of the number of pitch candidates [5], by selecting only the pitches with the greater salience values. In the current experi-ments, 10 candidate pitches are selected froms′[p].
Spectral flatness is another descriptor that can be used for the elimination of errors occurring in subharmonic positions [5]. In the proposed system, the flatness of the first 6 partials of a harmonic sequence is used:
F l[p] =
6 q
Q6
h=1V[p, h]
P6
h=1V[p,h]
6
(9)
The ratio of the geometric mean ofV to its arithmetic mean gives a measure of smoothness; a high value ofF l[p]indicates a smooth partial sequence, while a lower value indicates fluc-tuations in the partial values, which could indicate the presence of a falsely detected pitch occurring in a sub-harmonic position. For the current experiments, the lowerF l[p]threshold for sup-pressing pitch candidates was set to 0.1 after experimentation using the development set, as described in subsection 4.1.
the spectral irregularity measure formulated in [17] is proposed. Considering a pitch candidate with fundamental frequency f0
and another candidate with fundamental frequencylf0,l >1,
spectral irregularity is defined as:
SI[p, l] =
3
X
h=1
V[p, hl]−V[p, hl−1] +V[p, hl+ 1]
2 (10)
The spectral irregularity is tested on pairs of harmonically-related candidate F0s (where f1 = lf0). A high value of
SI[p, l]indicates the presence of the higher pitch with funda-mental frequencylf0, which is attributed to the higher energy
of the shared partials between the two pitches compared to the energy of the neighbouring partials off0.
In this work, theSIis modified in order to make it more robust against overlapping partials that are caused by non-harmonically related F0s [16]. Given the current set of can-didate pitches from s′[p], the overlapping partials from
non-harmonically related F0s are detected as in [16] and smoothed according to the spectral smoothness assumption, which states that the spectral envelope of harmonic sounds should form a smooth contour [8]. For each overlapping partial V[p, h], an interpolated value Vinterp[p, h] is estimated by
perform-ing linear interpolation usperform-ing its neighbourperform-ing partials. Af-terwards, the smoothed partial amplitudeV′[p, h]is given by
min(V[p, h], Vinterp[p, h]), as in [8]. The proposed spectral
ir-regularity measure, which now takes the form of a ratio for in order to take into account the decreasing amplitude of higher partials, is thus formed as:
SI′[p, l] =
3
X
h=1
2·V′[p, hl]
V′[p, hl−1] +V′[p, hl+ 1] (11)
For each pair of harmonically-related F0s (candidate pitches that have a pitch distance of ±{12,19,24,28, . . .}) that are present ins′[p], the existence of the higher pitch is determined
by the value ofSI′(for the current experiments, a threshold of
1.2 was set using the development set).
3.3. Temporal Evolution Rules
Although theSI and the spectral smoothness assumption are able to suppress some harmonic errors, additional information needs to be exploited in order to produce more accurate esti-mates in the case of harmonically-related F0s. In [16], tempo-ral information was employed for multiple-F0 estimation using the synchoronicity criterion as a part of the F0 hypothesis score function. There, it is stated that the temporal centroid for a har-monic partial sequence should be the same for all partials. Thus, partials deviating from their global temporal centroid indicates an invalid F0 hypothesis. Here, we use the common amplitude modulation (CAM) assumption [6, 11] in order to test the pres-ence of a higher pitch in the case of harmonically-related F0s. CAM assumes that the partial amplitudes of a harmonic source are correlated over time and has been used in the past for note separation given a ground truth of F0 estimates [11]. Thus, the presence of an additional source that overlaps certain partials (eg. in the case of an octave where even partials are overlapped) causes the correlation between non-overlapped partials and the overlapped partials to decrease.
To that end, tests are performed for each harmonically-related F0 pair that is still present ins′[p], comparing partials that are not overlapped by any non-harmonically related F0
can-Pitch (MIDI)
Pitch (MIDI)
Pitch (MIDI)
20 30 40 50 60 70 80 90 100 110
20 30 40 50 60 70 80 90 100 110
20 30 40 50 60 70 80 90 100 110
[image:5.595.314.544.75.293.2]0 0.5 1 0 0.5 1 0 0.5 1
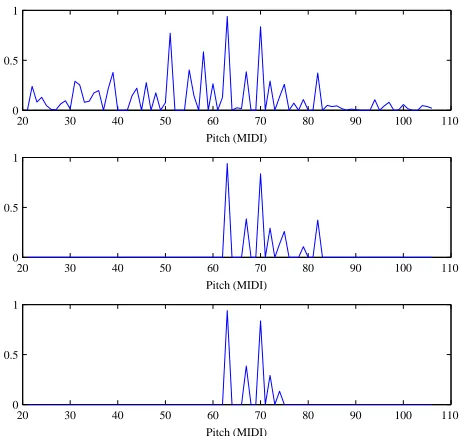
Figure 2: Salience function stages for an E♭4-G4-B♭4-C5-D5 piano chord. From top to bottom, the figures represent (i) The raw salience function (ii) The salience function after the spectral structure rules have been applied (iii) The salience function after the temporal evolution tests have been applied.
didate with the partial of the fundamental. The correlation co-efficient is formed as:
Corr[p, h, l] = p Cov(X[n, kp,1], X[n, kp,hl])
Cov(X[n, kp,1])Cov(X[n, kp,hl])
(12)
wherekp,hindicates the frequency bin corresponding to theh
-th harmonic of pitchp,ndenotes the RTFI frame number,lthe harmonic relation (eg. for octavesl= 2), andCov(·)stands for the covariance measure. Tests are being taken for each pitchp
and harmonicshl, using the same steady-state area used in sub-section 2.3 as a frame range. If there is at least one harmonic where the correlation coefficient for a pitch is lower than a given value (in the experiments it was set to 0.8), then the hypothesis for the higher pitch presence is satisfied. In order to demonstrate the various refinement steps used in the salience function, Fig-ure 2 shows the three basic stages of the multiple-F0 estimation system for a synthesized E♭4-G4-B♭4-C5-D5 piano chord.
4. Evaluation
4.1. Dataset
L
%
Proposed System Emiya et al. [5] Klapuri [8]
1 2 3 4 5 6
[image:6.595.57.287.74.220.2]0 10 20 30 40 50 60 70 80 90 100
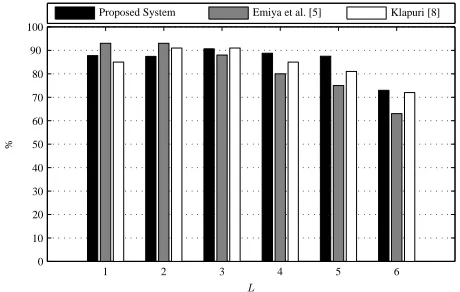
Figure 3: Multiple-F0 estimation results (in F-measure) with unknown polyphony, organized according to the ground truth polyphony levelL.
2 pianos (consisting of 1952 samples) is selected while the other 7 pianos (consisting of 6832 samples) are used as a test set.
4.2. Figures of Merit
In order to evaluate the results of the proposed multiple-F0 es-timation system, the recall, precision, and F-measure are used:
P= tp
tp+fp, R= tp
tp+fn, F =
2P R
P+R (13)
wheretpis the number of correctly estimated pitches,fpis the number of false pitch detections, andfnis the number of missed pitches. A set orP, R, F is generated for each recording. By varying the system parameters, precision/recall (P/R) curves can be created by placingRvalues on the x-axis andP values on the y-axis.
4.3. Results
The performance of the proposed multiple-F0 estimation sys-tem compared with the results shown in [5] is shown in Figure 3, organized according to the polyphony level of the ground truth (experiments were performed with unknown polyphony). The mean F-measures for polyphony levelsL = 1, . . . ,6are 87.84%, 87.44%, 90.62%, 88.76%, 87.52%, and 72.96% re-spectively. It should be noted that the subset of polyphony level 6 consists only of 350 samples of random notes and not of clas-sical and jazz chords. As far as precision is concerned, reported rates are high for polyphony levels 2-6, ranging from 91.11% to 95.83%. The lowest precision rate is 84.25% forL = 1, where some overtones were erroneously considered as pitches. Recall displays the opposite performance, reaching 96.42% for one-note polyphony, and decreasing with the polyphony level, reaching 87.31%, 88.46%, 85.45%, and 82.35%, and 62.11% for levels 2-6.
Comparing the results with the system in [5] (where the re-ported F-measures for the same polyphony levels were 93%, 93%, 88%, 80%, 75%, and 63%), it can be seen that the pro-posed system yields improved results for polyphony levels 3-6, while falling back in the one- and two-note polyphony case. The best improvement is reported forL= 5, which is about 12.5%. The algorithm in [5] follows the same pattern whenPandRare concerned, reporting highP rates for all polyphony levels and decreasingRrates as polyphony increases. Additional
exper-iments were performed in [5] using the iterative spectral sub-traction algorithm proposed by Klapuri in [8], which reached F-measures of about 85%, 91%, 91%, 85%, 81%, and 72% for
L = 1, . . . ,6, respectively. In this case, the proposed system performs better forL = 1,4,5,6, reporting the best improve-ment (6.5%) for the 5-note polyphony case, while the worst per-formance difference is about 3.5% forL= 2.
In terms of a general comparison between the 3 systems, a weighted F-measure was used, weighting the variousF for polyphony levels 1-6 with their respective set size, since the global F-measure was not reported in [5]. For the proposed system, the actual globalFis 87.48%. For the algorithm in [5], the estimated globalFis 83.70%, while for the algorithm of [8] used in [5], it is 85.25%.
Concerning the statistical significance of the proposed method’s performance compared to the methods in [5, 8], the recognizer comparison technique described in [7] was em-ployed. The number of pitch estimation errors of the two meth-ods is assumed to be distributed according to the binomial law. The error rate of the proposed method ispˆ1 = 0.1252, while
the average error rate of the two methods in [5] ispˆ2= 0.1630
and pˆ3 = 0.1475. Taking into account that the test set size
S = 6832and considering 95% confidence (α= 0.05), it can be seen thatpˆ2−pˆ1≥zα
p
2ˆp/S, wherezαcan be determined
from tables of the Normal law (z0.05= 1.65) andpˆ= ˆp1+ ˆ2p2.
Likewise, it can be seen thatpˆ3−pˆ1 ≥zα p
2ˆp/S, where in this timepˆ= pˆ1+ ˆp3
2 . This indicates that the performance of
the proposed multiple-F0 method is significantly better when compared with the methods in [5, 8].
Another issue for comparison is the matter of computa-tional complexity, where the algorithm in [5] being reported to require a process time of about 150×real time, while the pro-posed system is able to estimate pitches faster than real time (implemented in Matlab), with the bottleneck being the RTFI computation; all other processes are almost negligible regarding computation time. This makes the proposed approach attractive as a potential application for automatic polyphonic music tran-scription.
In [5], additional results are reported using a subset of 97 recordings which only contains octaves. The system in [5] yielded an F-measure of 81%, while the algorithm in [8] reached 77%. Here, the reported meanFoctis 84.59%, with
Poct = 90.59%andRoct = 84.12%. The improved
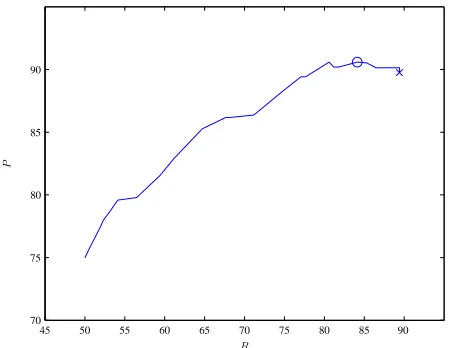
perfor-mance of the proposed system on octave detection could be at-tributed to the octave presence tests that were performed using theSImeasure as well as on the temporal evolution tests using the partial correlation. In contrast, the method in [5] uses the smoothness of the partial envelope as a pitch presence indica-tion, which is not sufficient for detecting octaves. Additional insight to the performance of the octave detection experiments is given in the form of aP/Rcurve with varyingSI′in Figure
4. WhenSI′ = 0.25,F
octreaches a value of 87.59%, while
when using theSI′ threshold for the whole system theFoct
drops about 4%. When the value ofSI′ reaches 5, the recall
drops to 50%, which indicates that only the lower pitches of the octaves are selected.
5. Conclusions
spec-R
P
45 50 55 60 65 70 75 80 85 90
[image:7.595.59.284.73.247.2]70 75 80 85 90
Figure 4: P/Rcurve for the octave detection experiments with
SI′ ∈ {0,5}. The circle marker corresponds to the selected
SI′for the whole system (withF
oct= 84.59%) and the cross
marker corresponds to the optimalSI′value for the octave
ex-periments only (Foct= 87.59%).
tral whitening, and onset detection were employed in order to make the subsequent analysis robust. A log-frequency salience function was proposed, being able to handle tuning and inhar-monicity estimation, while pitch candidates were selected and refined according to a set of rules based on spectral characteris-tics. A novel procedure for suppressing errors by harmonically-related F0s was proposed, using the common amplitude mod-ulation assumption, which takes the form of partial correlation tests. Experiments were performed on a large dataset of piano recordings containing samples that were created using different sources and recording conditions. The system reports increased pitch estimation performance when compared to state-of-the-art approaches. Statistical significance tests were carried out in order to verify the proposed method’s superiority. In addition, the system was able to address the octave detection problem by employing tests on harmonically-related F0s.
In the future, experiments will be performed on datasets consisting of various instrument types, such as the 30 instru-ment random mixtures dataset used in [8]. To that end, au-tomatic adaptation of the proposed system parameters accord-ing to the spectral envelope shape and the partial evolution of the produced notes is necessary. It should be noted that, al-though the method can be extended in order to cover several instrument types, the detection of notes produced by extremely inharmonic instruments such as marimba or vibraphone can-not be supported by the current system. In addition, a robust onset detection algorithm will be developed in order to accu-rately detect soft onsets produced by pitched non-percussive instruments. More emphasis will also be given to the matter of correctly estimating the pitch of complex combinations of harmonically-related notes, which still remains an open prob-lem in the literature. Finally, the multiple-F0 estimation algo-rithm will be incorporated into an automated music transcrip-tion system.
6. References
[1] J. P. Bello, “Towards the automated analysis of simple poly-phonic music: a knowledge-based approach,” PhD Diss.,
Queen Mary, University of London, Jan. 2003.
[2] J. P. Bello, L. Daudet, S. Abdallah, C. Duxbury, M. Davies, and M. Sandler, “A tutorial on onset detection of music sig-nals,” IEEE Trans. Speech and Audio Proc., Vol. 13, no. 5, pp. 1035–1047, Sep. 2005.
[3] J. C. Brown, “Calculation of a constant Q spectral trans-form,” J. Acoustical Society of America, Vol. 89, no. 1, pp. 425–434, Jan. 1991.
[4] A. de Cheveign´e, “Multiple F0 estimation,” in D. L. Wang and G. J. Brown (Eds), Computational Auditory Scene Anal-ysis, Algorithms and Applications, IEEE Press/Wiley, pp. 45–79, 2006.
[5] V. Emiya, R. Badeau, and B. David, “Multipitch estimation of piano sounds using a new probabilistic spectral smooth-ness principle,” IEEE Trans. Audio, Speech and Language Processing, Vol. 18, no. 6, pp. 1643–1654, Aug. 2010.
[6] D. Gunawan and D. Sen, “Identification of partials in poly-phonic mixtures based on temporal envelope similarity,” in Proc. AES 123rd Convention, Oct. 2007.
[7] I. Guyon, J. Makhoul, R. Schwartz, and V. Vapnik, “What size test set gives good error estimates?,” IEEE Trans. Pat-tern Analysis and Machine Intelligence, Vol. 20, no. 1, pp. 52–64, Jan. 1998.
[8] A. Klapuri, “Multiple fundamental frequency estimation based on harmonicity and spectral smoothness,” IEEE Trans. Audio, Speech, and Language Processing, Vol. 11, no. 6, pp. 804–816, Nov. 2003.
[9] A. Klapuri and M. Davy (Eds), Signal Processing Methods for Music Transcription, Springer-Verlag, New York, 2006.
[10] A. Klapuri, “A method for visualizing the pitch content of polyphonic music signals,” in Proc. 10th Int. Conf. Music Information Retrieval, pp. 615–620, Oct. 2009.
[11] Y. Li, J. Woodruff, and D. L. Wang, “Monaural musical sound separation based on pitch and common amplitude modulation,” IEEE Trans. Audio, Speech, and Language Processing, Vol. 17, no. 7, pp. 1361–1371, Sep. 2009.
[12] Music Information Retrieval Evaluation eXchange (MIREX),http://music-ir.org/mirexwiki/.
[13] L. I. Ortiz-Berenguer, F. J. Casaj´us-Quir´os, M. Torres-Guijarro, and J. A. Beracoechea, “Piano transcription us-ing pattern recognition: aspects on parameter extraction,” in Proc. 7th Int. Conf. Digital Audio Effects, pp. 212–216, Oct. 2004.
[14] D. Stowell and M. Plumbley, “Adaptive whitening for im-proved real-time audio onset detection,” in Proc Int. Com-puter Music Conf., pp. 312–319, Aug. 2007.
[15] E. Vincent, N. Bertin, and R. Badeau, “Harmonic and in-harmonic nonnegative matrix factorization for polyphonic pitch transcription,” in Proc. 2008 IEEE Int. Conf. Acous-tics, Speech, and Signal Processing, pp. 109–112, Apr. 2008.
[16] C. Yeh, “Multiple fundamental frequency estimation of polyphonic recordings,” PhD Diss., ´Ecole Doctorale Edite, Universit´e Paris VI - Pierre et Marie Curie, Jun. 2008.