City, University of London Institutional Repository
Citation
: Soltanahmadi, Abbasali (1988). Dynamics of Flexible Riser Systems.
(Unpublished Doctoral thesis, City, University of London)This is the accepted version of the paper.
This version of the publication may differ from the final published
version.
Permanent repository link:
http://openaccess.city.ac.uk/20155/Link to published version
:
Copyright and reuse:
City Research Online aims to make research
outputs of City, University of London available to a wider audience.
Copyright and Moral Rights remain with the author(s) and/or copyright
holders. URLs from City Research Online may be freely distributed and
linked to.
By
ABBl\SALI SOLTANABMADI
B.Sc. ~Hons), M.Sc. ~Structures)
A ~esis Subnitted for the degree of Doctor of Philosqily
7tle City University
Deparbnent of Civil Engineering
encouragement and supervision throughout the duration of this
work. I wish also to express my gratitude to Professor J Chaplin
for his advice and guidance towards the experimental work of the
project. I would like to thank the technical staff of the
Department of Civil Engineering in the City University for their
assistance in the laboratory.
I wish also to express my sincere appreciation to Zentech
Consultants for most generously giving me the opportunity to
contribute the numerical validation for this work.
I would like to thank Mrs Pat Walker who typed this manuscript.
I wish to express my deep appreciation to my wife's patience and
my brother's moral and financial support, without which this
project would not have been possible.
Last, but not least, I would like to acknowledge the financial
support given by Robert Kitchin (Saddlers) through the City
i
-SYOOPSIS
This thesis is concerned with the static and dynamic analyses and
the model testing of deep sea flexible riser systems which are
the key components associated with semi-submersible oil
platforms. A numerical method based on explicit integration of
Newton's second law is developed to predict the 3-dimensional
dynamic behaviour of the riser due to the hydrodynamic loadings
induced by wave and current motion. In this analysis the effects
of waves and currents from separate directions, vessel movements,
vortex-shedding and structural damping are included. The material
damping for the riser is modelled by a single Kelvin system and
the hydrodynamic loadings are assessed from the modified Morison
equation. The effect of vortex-shedding on the riser is
modelled by considering the interaction of drag-inertia and lift
forces due to wave and current motion. The drag coefficient being
modified ~ the vortex-shedding effects which are predicted by calculating the maximum response of the flexible riser in the
lift force direction.
The formfinding and static analysis of the riser when subject to
structural self-weight and other static loadings is carried out
by the method of Dynamic Relaxation using kinetic damping. The
method is well suited to computer aided design procedures in
which various shapes for the riser catenary have to be
investigated together with the effects of boundary support
The theories described above are implemented into three computer
programs. The first program deals with the formfinding of the
riser and the second investigates the dynamic behaviour of the
riser due to non-linear current and wave loadings. The third
program is concerned with the static solution of the riser due to
current loading. The latter is employed when the hydrodynamic
force consists of current loading only and therefore the dynamic
solution is not desired. The iterative use of the first and third
programs allows potential designs to be quickly investigated.
The results predicted by the numerical analyses are compared with
those obtained from two series of model tests in wave flumes. '!he
tests were scaled from prototype situations using Froud number
criteria. The first set of tests used a small scale flexible
chain model with negligible material damping and structural
bending stiffness and no induced vortex shedding; the aim of
these tests being only to validate the assessement of the
hydrodynamic forces on the riser. '!he second set investigated the
response of a larger scale model which induced vortex-shedding
and in which the riser system had significant structural damping.
The comparison of experimental and computed results showed close
agreement.
The developed computer programs were also validated numerically
by comparing the predicted results with those obtained from the
LIST OF FIGURES
LIST OF TABLES
LIST OF PLATES
LIST OF SYMBOLS
iii
-OIAPTER 1 GENERAL INl'OOOUcrICN
Page
xiii
xxiii
xxvi
xxvii
1
CHAPTER 2
1.1 Introduction 1
1.2 Outline of Thesis 2
LITERATURE REVIEW OF HYDRODYNAMIC LOADINGS ON
FLEXIBLE RISERS
4
2.1 Introduction 4
4
4
8
2.2 Fluid Hydrodynamics
2.3
2.2.1 Wave Hydrodynamics
2.2.2 Interaction of Wave and
Current Motion
Drag-Inertia Hydrodynamic Forces on
Cylinders
10
2.3.1
2.3.2
2.3.3
Hydrodynamic Forces on a 10
Vertical Rigid Cylinder
Hydrodynamic Forces on a Rough 17
Cylinder
Hydrodynamic Forces on an 21
CHAPrER 3
2.4
2.3.4
2.3.5
2.3.6
Hydrodynamic Forces on a
Flexible Cylinder
Hydrodynamic Forces on
Cylinder Groups
Hydrodynamic Forces along a
Cylinder
Hydrodynamic Loadings Induced by
Vortex-Shedding on Cylinders Placed in the
Plane of the wave and Current Motion
Page
23
25
32
33
2.4.1 Forces on a rigid Cylinder 34
Induced by Vortex-Shedding in
Steady Flow (No Vibration)
2.5
2.4.2
2.4.3
2.4.4
Vortex-Excited Vibration of
Cylinders in Steady Flow
Forces on Rigid Cylinders due
to Vortex-Shedding in Waves
Vortex-Excited Vibration of
Flexible Cylinders in Waves
Forces Induced by Vortex-Shedding on
Randomly Oriented Cylinders
FLEXIBLE RISERS
3.1 Introduction
3.2 Flexible Pipe Cross-Section
35
38
40
42
44
44
45
3.3 Background to the Analysis of Flexible 49
CHAPl'ER 4
v
-THEORETICAL COMPUTATION AND ASSESSMENT OF
HYDroDYNAMIC IDADINGS 00 FLEXIBLE RISERS
4.1
4.2
4.3
4.4
Introduction
Fluid Mechanics
4.2.1 Derivation of Basic
Relationships for
Incompressible, Irrotational
and Inviscid Fluid Flow
Wave Theory
4.3.1. Linear (Airy) Wave Theory
4.3.2
4.3.3
Stokes Finite Amplitude Wave
Theory
Numerical Solution of Equations
14.42) and (4.43)
Hydrodynamic Loading
4.4.1 Developing the Theory to
4.4.2
4.4.3
Estimate the Drag-Inertia
Hydrodynamic Loading on a
Flexible Catenary Riser
Forces Induced by
vortex-Shedd ing on a Randomly
Oriented Flexible Catenary
Riser
Modification of Drag-Inertia
Force Equation due to
CHAPTER 5
4.5
4.6
4.7
4.8
Assessment of Drag-Inertia Hydrodynamic
Forces of Flexible Risers
4.5.1
4.5.2
Region 1 - Hydrodynamic
Loadings Induced by Wave and
Current Flows
Region 2 - Hydrodynamic
Loading Induced by Current
Motion Only
Assessment of Hydrodynamic Forces
Induced by Vortex-Shedding on Flexible
Risers
Simulation of Splash Zone
Modelling of Platform Motion
THEORETICAL DEVELOPMENTS FOR THE ANALYSIS OF
FLEXIBLE RISERS
5.1
5.2
Introduction
Dynamic Analysis of Flexible Risers
5.2.1
5.2.2
5.2.3
5.2.4
Numerical Schemes for
Structural Dynamics
Dynamic Solution
Stability of the Numerical
Integration
Optimization of the Numerical
rnAPTER 6
5.3
5.4
5.5
5.6
vii
-Formfinding and Static Solution of
Flexible Risers
Calculation of Visco-Elastic Material
Damping Constants
Determination of Structural Natural
Frequencies
Dimensional Analysis and Model Scaling
5.6.1 Dimensional Analysis
5.6.2
5.6.3
Model Scaling of a Riser in
Wave Flow
Model Scaling of a Riser in
Current Flow
NUMERICAL IMPLEMENI'ATICN
6.1 Introduction
6.2 Implementation of Static Solution for
Formfinding
6.2.1 Program FLEXSTATIC (Program 1)
6.2.2 Critical Criteria in Designing
Flexible Riser catenary Shapes
6.2.3
6.2.4
6.2.5
Optimization of Program
FLEXSTATIC
Validation of program
FLEXSTATIC
Parameter Study on the Number
of Elements Used to Compute
the Riser Equilibrium Shape
OlAPI'ER 7
6.3
6.4
6.5
6.6
Implementation of Dynamic SOlution
6.3.1
6.3.2
6.3.3
Program S'IDKWAVE
Program FLEXDYNAMIC
iProgram 2)
Optimization of Program
FLEXDYNAMIC
Program FLEXCURRENl' (Program 3)
Validation of Program FLEXSTATIC,
FLEXCURRENl' aM FLEXDYNAMIC Computations
by Hand calculations
Implementation and Numerical Validation
of the Method Used to Determine
Structural Natural Frequencies
EXPERIMENI'AL WORK 'ID VALIDATE NUMERICALLY CDMPUTED
RESULTS 7.1 7.2 7.3 7.4 7.5 Introduction
Objectives of the Exper~nts
Model Scaling and Description of Test
Models, Regular Waves and Current Flows
7.3.1 First Series of Experiments
7.3.2 Second Series of Experiments
Experimental Apparatus
7.4.1
7.4.2
7.4.3
Current Channel
Small Wave Flume
Large Wave Flume
Description of Measuring Instrumentation
7.5.1 Current Meter
i x
-Page
7.5.2 Wave Probe 210
7.5.3 Horizontal Top Tension 211
Measuring Strain Gauges
7.5.4 Ultra Violet Recorder 211
7.5.5 High Speed Camera 212
7.5.6 The Modular Film Analysis 212
Systan Wigitizer System)
7.6 Calibration of Measuring Instruments 213
7.6.1 Wave Probe 213
7.6.2 Strain Gauges 213
7.6.3 Displacement Transducer 213
7.7 Experimental Procedure 214
7.7.1 The First Series of Tests 214
7.7.1.1 Current Channel Ex- 214
periments
7.7.1.2 Wave Flume Experi- 216
ments
7.7.2 The Second Series of Tests 217
7.7.2.1 Current Channel Ex- 217
periments
7.7.2.2 Wave Flume Experi- 218
ments
7.7.2.3 Material Damping 219
Test
CliAPrER 8 RESULTS 221
8.1 Introduction 221
8.3 8.2.1 8.2.2 8.2.3 8.2.4 8.2.5
Determination of Young's
Modulus, E, for the Chain
Determination of the Drag
Coefficient, Cd' for the Model
in Steady Current Flow and
Validation of Static Program 3
Determination of Drag
Coefficient, Cd' and Inertia
Coefficient,
'1n
Results of the Generated Wave
in the Small Flume
Results of the Tests in the
Small Wave Flume
Results for the TUbe Model
8.3.1
8.3.2
8.3.3
8.3.4
8.3.5
Results of the Material
Dam-ping Tests
Determination of the Drag
Coefficient, Cd' for the Model
in Steady CUrrent Flow
Determination of Drag
Coefficient, Cd' and Inertia
Coefficient,
'1n
Results for the Generated Wave
in the Large Wave Flume
Calculation of the Buoyancy
Force Induced by the Sub-Buoy
and the Cradle
CHAPl'ER 9
8.4
-
xi-8.3.6 Results of Tests in the Large
Wave Flume
Results for the Vibrating TUbe Model due
to vortex-Shedding
8.4.1
8.4.2
8.4.3
8.4.4
8.4.5
Results for High Amplitude
Wave Generated in the Large
Wave Flume
Determination of Drag
Coefficient, Cd' and Inertia
Coefficient,
em
Evaluation of the Model
Natural Frequencies
Determination of the Model
Response due to
Vortex-Shedding
Comparison of the Model
Response to the Wave with and
without taking account of
Vortex-Shedding Effects
NUMERICAL VALIDATION
9.1 Introduction
9.2 Static Test Cases without Current
Loadings
9.3
9.4
Static Test Cases with CUrrent IDadings
Dynamic Test Cases
CliAPTER 10
APPENDIX A
APPENDIX B
APPENDIX C
APPENDIX D
APPENDIX E
References
CCNCWSIOOS AND RECCl1MENDATIOOS
10.1
10.2
Conclusions
Recornmenda tions
Coefficients Aij' Bij and Ci of Stokes Wave Theory
Derivation of Formulae for Determining the
Hydrodynamic Forces on a Riser Element
Calculation of Nodal Twisting Forces due to
Torsion of Flexible Risers
Static Solution for the Riser Structure Using
Dynamic Relaxation with Viscous Damping
Input Data of the Test Cases in Chapter 9
Page
296
296
302
305
307
309
312
314
Figure
3.1
3.2
3.3
3.4
3.5
4.1
4.2
4.3
4.4
xiii
-LIST OF FIroRES
Different shapes of flexible risers
Cradle system
Flexible riser cross-section
Type of elements used in finite difference scheme
Type of elements used in finite element scheme
Fluid element
Components of fluid element motion
Ranges of wave theories gving the best fit to the
dynamic free surface boundary condition (Dean 1970)
Ranges of suitability for various wave theories
(Mehaute (1976')
47
48
48
49
50
55
56
61
61
4.5 Specifications for a wave train 62
4.6 Modification of the linear wave theory 68
4.7 Orientation of a riser element in space 81
4.8 Variation of lift coefficient with the Reynolds and the 86
Keu1egan-carpenter numbers for rigid cylinders
4.9 The frequency of vortex-shedding in waves (two- 88
dimensional results from Sarpkaya H976a), wave results
fran Isaacson (1974».
4.10 Prediction of "lock-in" frequency from Rajabi et. a1. 89
.1984,
4.11 Lift amplification correction 90
4.12 CLo against ~ for current flows 91
4.13 An idealized flexible riser 93
4.15 4.16 4.17 4.18 4.19 4.20 4.21 5.1 5.2 5.3 5.4 5.5 5.6 5.7 5.8 5.9 6.1 6.2 6.3
The first two force segments on member J\B
Trapezoidal rule
Iteration procedure to obtain the conjunction point of
the piercing member and wave profile
Nodfa1 hydrodynamic forces on the piercing member
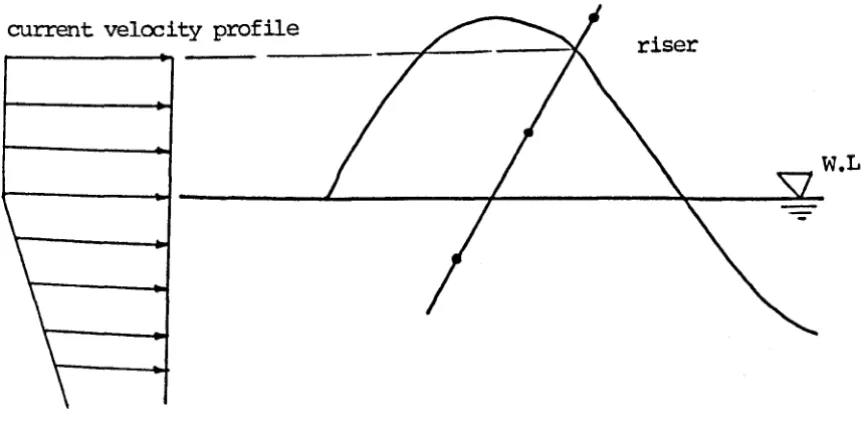
Adjustment of current induced velocity with wave
profile
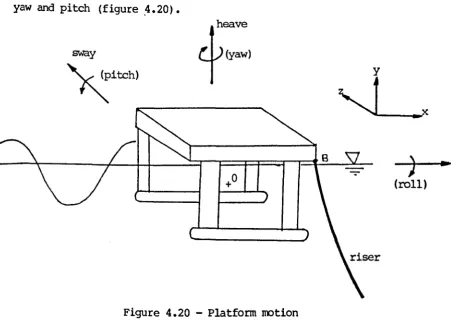
Platform motion
pitch induced translational motions of the riser top
connector
Single Kelvin model
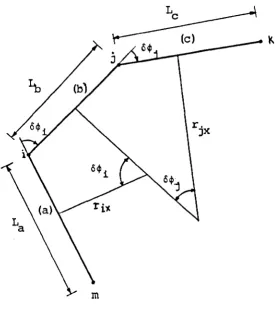
Definition sketch for flexure of adjacent members in
the x-y plane
Flow chart of dynamic solution algorithm
Damping of kinetic energy peaks with time
Flow chart of static solution algorithm
Strain against time for visco-elastic materials
Dynamic response of a structure and its reflected
image
Time history of oodal displacements
Values of coefficients A and B against r
Computed static equilibrium shape of a free hanging
riser
Computed static equilibrium shape of a single catenary
riser
Computed static equilibrium shape of a double catenary
6.4
6.5
6.6
6.7
6.8
-xv-computation of static equilibrium shape of a double
catenary riser from the initial input shape
Critical configurations of a single catenary riser
corresponding to far and near novements of the platform
Key configurartion to estimate the length of a single
catenary riser
Optimization of static solution with reduced axial
stiffness
Optimization of static solution with number of kinetic
energy peaks at which the riser length is corrected
Page 167
168
169
170
171
6.9 Comparison of the digitized and computed static 172
configurations of the catenary snake chain representing
the upper part of a single or double catenary riser
6.10 Comparison of the digitized and computed static 173
configurations of the catenary snake chain
representing a free hanging riser
6.11 Reaction forces of a single catenary riser with 174
different number of elements
6.12 Definition sketch of platform notion 175
6.13 Comparison of the computed dynamic responses of a 176
single catenary riser with calculating the wave and
current induced hydrodynamic forces at every 1, 5, 10
or 15 integration time intervals
6.14 Snap-shots of the dynamic response of a single catenary 177
riser subjected to wave and current induced
6.15 6.16 6.17 6.18 6.19 6.20 6.21 6.22 6.23 6.24
Time histories of horizontal nodal displacements of a
single catenary riser subjected to wave and current
induced hydrodynamic loadings
Time histories of vertical nodal displacements of a
single catenary riser subjected to wave and current
induced hydrodynamic loadings
Snap-shots of the dynamic response of a single catenary
riser subjected to wave and current induced
hydrodynamic forces and platfonn motion
Time histories of horizontal nodal displacements of a
single catenary riser subjected to wave and current
induced hydrodynamic loadings and platfonn motions
Time histories of vertical nodal displacements of a
single catenary riser subjected to wave and current
induced hydrodynamic forces and platfonn motion
Flow chart for static solution algorithm for program
FLEXQJRRENl'
Computed static equilibrium shapes of a single catenary
riser with and without current induced hydrodynamic
loadings
Computed static equilibrium shapes of a single catenary
riser with and without current induced hydrodynamic
loadings and vertical platfonn movement
Computed static equilibrium shapes of a single catenary
riser with and without current induced hydrodynamic
loadings and horizontal platfonn movement
Hand calculation test case 1
6.25
6.26
6.27
6.28
6.29
6.30
7.1
7.2
xvii
-Hand calculation test case 2
Specifications of a catenary cable used by
Triantafyllou et. ale U983) to calculate the
structural natural frequencies
The first four natural frequencies of a catenary for
WL/H = 1.5 as a function of the static angle at the top
after Triantafyllou et. ale H983)
Static equilibrium shape of the natural frequency
validation test case
Time history of the npoked n natural frequency
validation test case
Values of coefficients A and B against r for the
natural frequency validation test case
Arrangement of the snake chain in catenary shape at 00
to wave flow
Arrangement of the tube model in catenary shape at 00
to wave flow
Page
192
193
194
195
196
197
202
205
7.3 Experimental cradle system 206
7.4 Arrangement of the tube model in single catenary riser 208
shape
7.5 Model enain and current enannel 215
7.6 Geometry of nodal displacenent 215
7.7 Material damping test arrangement 220
8.1 Equivalent current velocity variation with water depth 224
8.2 Comparison of the measured and computed nodal 234
displacements along the chain due to current induced
8.3 8.4 8.Sa 8.Sb 8.6 8.7 8.8 8.9 8.10 8.11 8.12
Drag coefficient (Cd) against Keulegan-carpenter number
(KC) in subcritical Reynolds number region after
Sarpakya et. al. 11974)
Inertia coefficient (Cm) against Keulegan-Carpenter
number ~KC) in subcritical Reynolds number region after
Sarpakya et. al. (1974)
Height and period of the wave generated in the small
wave flume from X-Y plotter
The wave train generated in the small wave flume
Comparison of the computed and digitized wave profile
for the wave generated in the small wave flume
Computed static equilibrium shape of the chain model at
00 to the wave direction
Computed and measured envelopes for the dynamic
response of the main rodel at 00 to the wave direction
Comparison of the computed and measured horizontal
nodal displacements along the chain model at 00 to the
wave direction
Computed static equilibrium shape of the chain roodel at
300 to the wave direction
Computed am measured envelopes in the wave direction
for the dynamic response of the chain model at 300 to
the wave direction
Comparison of the computed and measured horizontal
nodal displacements in the wave direction along the
main rodel at 300 to the wave direction
8.13 8.14 8.15 8.16 8.17 8.18 8.19 8.20 8.2la 8.21b 8.22
xix
-Computed static equilibrium shape of the chain model in
U-Shape at 300 to the wave direction
Computed and measured envelopes in the wave direction
for the dynamic response of the chain in the U-Shape at
300 to the wave direction
Comparison of the computed and measured horizontal
nodal displacements in the wave direction along the
chain rodel in the U-Shape at 300 to the wave direction
Computed static equilibrium shape of the chain model in
disconnected shape
Computed and measured envelopes for the dynamic
response of the chain roodel in disconnected shape
Comparison of the computed and measured horizontal
nodal displacements along the chain model in
disconnected shape
Curve-fitting for material damping constants:
E - 8.3 x 10⁶ N/m2, a - 4.9 x 10⁻⁶ m2/N. sec and
b - 30 sec -1
Comparison of the measured and computed nodal
displacements along the tube model due to current
induced hydrodynamic loadings
Height and period of the first wave generated in the
large wave flume
The first wave train generated in the large wave flume
Comparison of the computed and digitized wave profile
for the first wave generated in the large wave flume
8.23 8.24 8.25 8.26 8.27 8.28 8.29 8~30 8.31 8.32
Computed static equilibrium shape of the tube model in
catenary shape at 00 to the wave direction
Computed and measured envelopes for the dynamic
response of the tube model in catenary shape at 00 to
the wave direction
Comparison of the computed and measured horizontal top
tension am nodal displacements along the tube model in
catenary shape at 00 to the wave direction
A typical graph output from the U. V. recorder for the
horizontal top tension of the tube model in the large
wave flume
Computed static equilibrium shape of the tube model at
00 to the wave direction
Computed and measured envelopes for the dynamic
response of the tube model at 00 to the wave direction Comparison of the computed and measured horizontal top
tension
am
nodal displacements along the tube model at00 to the wave direction
Computed static equilibrium shape of the tube model at
450 to the wave direction
Computed am measured envelopes in the wave direction
for the dynamic response of the tube model at 450 to
the wave direction
Comparison of the computed and measured horizontal top
tension and nodal displacements in the wave direction
along the tube model at 450
8.33a 8.33b 8.34 8.35 8.36 8.37 8.38 8.39 8.40 8.41
xxi
-Height and period of the larger wave generated in the
large wave flume from (X-Y plotter)
The wave train of the larger wave generated in the
large wave flume
Comparison of the computed and digitized wave profile
for the larger wave generated in the large wave flume
Time history of the nodal displacements of node 7
induced by "poking"
Values of coefficients A and B against r for the tube
roode1
Determination of the dominant vortex-shedding frequency
and corresponding structural natural frequency for the
tube roode1
Lift coefficient (CLO ' against Keu1egan-Carpenter
number ~KC' in subcritical Reynolds number region for a
rigid cylinder (after Sarpakya et. a1. (1974,)
Comtxlted static equilibrium shape of the tube model at
00 to the wave direction
Comparison of the measured and computed envelopes of
the dynamic response of the tube model (w i th and
without account of the effects of vortex-shedding,
Comparison of the measured and computed horizontal top
tens ion and nodal displacements along the tube model
(with and without account of the effects of
9.1 9.2 9.3 9.4 9.5 9.6 9.7 9.8 9.9 9.10 9.11 9.12 10.1 C.l 0.1
Conparison of static configuration (Free Hanging riser)
Comparison of static configuration (Doube Free Hanging
riser)
Conparison of static configuration (Steep S riser)
Conparison of static configuration (Steep wave riser)
Conparison of static configuration (lazy S riser)
COnparison of static configuration (lazy Wave riser)'
Comparison of static configuration with current (Double
Free Hanging riser)
Comparison of static configuration with current (Steep
S riser)
Comparison of the Double Free Hanging riser dynamic
response without platform motion
Comparison of the Double Free Hanging riser dynamic
response with platform motion
Comparison of the Steep S riser dynamic response
without platform motion
Comparison of the Steep S riser dynamic response with
platform motion
Spectral density graph
Three adjacent members in space
Definition of different damping states
Table 6.1 6.2 6.3 6.4 6.5 6.6 6.7 6.8a 6.8b 6.9 6.10 6.11 8.1 8.2 8.3 8.4
xxiii
-LIST OF TABUS
Input data for the free hanging riser
Input data for the single catenary riser
Input data for the double catenary riser
Reaction forces of the single catenary riser with
different number of elements
Horizontal and vertical co-ordinates of the single
catenary riser with different nurnber of elements
Results of the example given by Skjelberia and
Hendrickson
Predicted wave parameters for Stokes 5th order
Data for dynamic run with no platform rotion
Predicted wave parameters of Stokes 5th order wave
theory for the dynamic test case
Data for dynamic run of the single catenary riser with
platform rootion
Data for static run with current loadings
Comparison of structural natural frequencies predicted
by Trianfyllou et. ale (1983) and the present work
Computation of the experimental nodal displacements
induced by the current
Variation of the current velocity with water depth
Comparison of the computed and experimental horizontal
nodal disaplacements
Wave parameters of the wave generated in the small
8.5 8.6 8.7 8.8 8.9 8.10 E.l E.2 E.3 E.4 E.5 E.6 E.7
Comparison of the computed and experimental horizontal
nodal displacements
Wave parameters of the first wave generated in the
large flume
Wave parameters of the second wave generated in the
large flume
Natural frequencies of the single catena~ model
Possible vortex-shedding frequencies along the model
from figure (4.9)
Computed results from the vortex-shedding model
Inplt data for the static run of the free hanging riser
Inplt data for the static run of the free hanging riser
(simple catena~)'
Inplt data for the static run of the steep-S riser
Inplt data for the static run of the steep wave riser
Inplt data for the static run of the lazy-S riser
Input data for the static run of the lazy wave riser
Data for the simple catenary riser subjected to current
induced hydrodynamic loadings
Page 230 231 250 252 253 254 314 314 315 316 317 318 319
E.8 Data for the steep-S riser subjected to current induced 320
E.9
E.lO
hydrodynamic loadings
Data for the dynamic run of the simple catenary riser
subjected to wave and current induced hydrodynamic
loadings with no platform motion
Data for the dynamic run of the simple catenary riser
subjected to wave and current induced hydrodynamic
loadings with platform motion
321
-
xxv-Page E.ll Data for the dynamic run of the Steep-S riser subjected to 323
wave and current induced hydrodynamic loadings with no
platform motion
E.12 Data for the dynamic run of the steep-S riser subjected to 324
wave am current induced hydrodynamic loadings with platform
LIST OF PIATES
Plates
1
2
3
4
5
6
7
View of snake chain hung in a catenary shape as the upper
part of a single or double catenary riser
View of snake chain hung in a catenary shape as a free
hanging riser
General view of experimental arrangements in current enannel
View of snake chain in small wave flume at 00 to wave flow
View of snake chain in small wave flume at 300 to wave flow View of base plate in small wave flume
View of snake main in U shape in small wave flume at 300 to
wave flow
146a
146a
220a
220b
220b
220c
220d
8 View of snake chain in disconnected shape in small wave 220d
flume
9 View of plastic tube model in current channel 220e
10 View of sub-buoy and cradle system 220e
11 View of tube model arranged in catenary shape in large wave 220f
flume at 00 to wave flow
12 View of tube model arranged in single catenary riser shape 220g
in large wave flume at 00 to wave flow
13 View of tube model arranged in single catenary riser shape 220h
in large wave flume at 450 to wave flow
14 General view of experimental arrangement for material 220i
damping calibration test
a
Bij
Br
C
Co
Cd
Cd/Cdo Ci
'in
CtdCLo CL/CLo
dx
D
xxvii
-SYMBOIS
Material damping coefficient; Wave amplitude
Cross-sectional area of a cylinder
Amplitude of platfor.m motion
Wave parameters used in the Stokes wave theory
Projected frontal area
Coefficient used in the Fourier analysis
Interaction parameter between fluid and a cylinder, Material
damping constant
Wave parameters used in the Stokes wave theory
Coefficient used in the Fourier analysis
Speed of a transverse wave, Wave celerity
Linear wave celer i ty
Drag coefficient
Magnification of drag coefficient in the Morison equation
Wave parameters used in the Stokes
wave
theoryInertia coefficient
Tangential drag coefficient
Lift coefficient for a rigid cylinder
Magnification of lift coefficient for a flexible riser
Projection length of an element in the x-axis direction
Diameter of a cylinder
OXl , DX2, OX3 Distance of the riser top position from the centre of motion in the surge, heave and sway directions
Bending stiffness of an element
Function of x used in the derivation of Simpson's rule
Variable used in Newton's iteration scheme
fn fni
f"
fw
Fr Fx g h h* HF HFI HFn HFnxy HFnz HFt i, j, k.1
K
KC
KL,
K.r,Kv
K.E.
I
lcrit
Structural natural frequency
Harmonics of structural natural frequency
vortex-shedding frequency
Wave frequency
Froud number
Nodal tension force in the x axis direction
Gravitational acceleration
Step length used in Simpson's rule, Water depth
Distance from mean water level (positive upwards)
Hydrodynamic loadings per unit length of a riser
Total hydrodynamic loading on a riser due to wave motion
Hydrodynamic loading per unit length normal to a riser axis
Component of HFn on the vector lying on the xy plane
Component of HFn on the z axis direction
Tangential hydrodynamic loading per unit length on a riser
Cartesian axes
Constant alternating current
Wave number
Keulegan-Ca~nter number
Scale factors for length, time and velocity respectively
Nodal kinetic energy
Riser length
Length of the critical member regarding the travelling of a
transverse wave
Horizontal distance of the theodolite from the chain model
Cylinder length, Wave length
m
M
p
r
rix' rjx
R
R(t)
IP
~
5
SFbi' SFbj St t T Ti Tn TC TFL TFvor TFr U • U
xxix
-Mass of a cylinder and its contents also including added
mass per unit length of the cylinder
Structural mass at the node
Bending moments at nodes i and j
Ntnnber of elements
Fluid pressure; Structural self weight at the node
The number representing the harmonics of the Fourier
expansion
Mean radii of curvature of node i and j in the xy plane
Resistance of the prob wire
TiIre varying nodal forces
Response parameter
Reynolds number
i
Nodal axial stiffness 1.. 4
E1VL
o); Distance from sea bedall links at i
Shear force at node i and j of member b
Strouhal nuni:>er
Time
Tension force; Wave period
Initial specified tension in an element
Smallest natural period of a structure
Tension coefficient
Lift force
Force on a cylinder induced by vortex-shedding
Resisting force to riser movement due to lift force Horizontal fluid velocityi Unit vector along a cylinder
• V, "V
Vnmax
x, y and z corrponents of a unit vector along a cylinder
D.C. voltage
Vertical fluid veloci~ and acceleration
Current induced velocity
Critical fluid velocity at which resonance of a cylinder
will occur
Current induced velocity normal to riser axis
Amplitude of wave induced fluid velocity normal to riser
axis in the drag-inertia force direction
Vnx' Vny' Vnz x, y and z components of fluid veloci~ normal to riser axis
• • •
Vnx' Vny' Vnz x, y and z components of fluid acceleration normal to riser
Vnxy
Vr
*
Vr
Vt Vtc Vtw
•
V, Vw
"'x'
V
y' Vx' Vy'Wr
.
Vz Vz
axis
Component of fluid velocity normal to riser axis on a vector
lying in the xy plane
Component of fluid velocity normal to riser axis in the z
direction
Reduced velocity
Reduced velocity at lock-in condition
Fluid veloci~ tangential to riser axis
Current induced fluid velocity tangential to riser axis
Wave induced fluid veloci~ tangential to riser axis
Wave induced fluid velocity and acceleration
x, y and z corrponents of fluid veloci~
xxxi
-Xi Variable used in Newton' s iteration scheme
•
..
x, x, x Structural displacement, veloci~ and acceleration
.
..
Xl' X2' X3 Surge, heave and sway motions of a platform
xL' XL' XL Structural displacement, velocity and acceleration in the
lift force direction
XIIrax Maximum structural displacement in the lift force direction
XLx, XLy, XLz x, y and z corrponents of XL
XLxy' XLxy'
..
XLxy
a,S
~
6r
6¢i' 6¢j
AL
ALe
At
Component of structural displacement, velocity and
acceleration in the lift force direction on a vector lying
on the xy plane
Duration of riser response used in the Fourier analysis to
determine the structural natural frequencies
Van der Pol coefficient; Horizontal and vertical angles of
the nodes along the chain model measured by the theodolite
Pitch, yaw and roll IOOtiOns of a platform
Frequency parameter (Re/KC): Wave constant related to the
total pressure head
Phase angles associated with pitch, yaw and roll motions of
a platform respectively
Logarithmic decrement of cylinder damping
Reduced damping
Rotations of adjacent elements at nodes i and j
Total extension of an element
Elastic extension of an element
£ C £p
•
£c
~
n
9
91' 92, 93
"
p
a
1/J, ¢
1/J' n
Maximum integration time step for the central difference
numerical scheme
Accumulated creep strain
primary creep strain
Rate of creep strain
Structural damping ratio
Wave free surface
KX - LIlt; Phase angle
Phase angles associated with surge, heave and sway motions
of a platform respectively
Perturbation parameter
Kinematic viscosity
Water density
Riser dens i ty
Stress level
Stream function
Polar co-ordinate of a riser element
constant containing wave coefficients Aij
Wave circular frequency
Lift circular frequency
GmERAL INrKnJC.rICfi
1.1 - Introductim
1
-CIAPl'ER 1
In recent years, offshore technology has experienced a remarkable
growth and it promises efficient development of oil fields at
greater depths. Important components for such deep operations are
flexible risers. Considering the large financial losses
consequent on a riser failure in deep water, it is essential to
perform a comprehensive analysis of such structures in relation
to the actual environmental conditions.
A number of non-linear computer programs have been developed in
recent years to analyse flexible risers and they are usually very
expensive to run. The American Petroleum Institute Committee on
the standardization of offshore structures, API ,(1977) compared
eight existing computer programs for a simple standard set of
riser problems. The results for the computed dynamic structural
stresses were so different that no valid comparison could be
made. Discrepancies in computed results were due to the
differences in assessing hydrodynamic forces on the riser and in
the structural modelling of the risers.
The foregoing reveals that more research work is required to
understand the response of flexible risers to hydrodynamic
loadings.
In order to advance the study of loading and response
mechanisms, it is useful to resort to laboratory experiments with
response is established, it is possible to extend the model
towards the prototype situation by considering the effect of
additional parameters on the idealization and empiricism of the
adopted model. The ultimate objectives of the model are:
1) Every aspect of hydrodynamic loading (such as vortex
shedding) should be included.
2) The formulation should be reasonably economical to
incorporate in numerical integration methods for the
non-linear dynamic response.
1.2 - OUtliIe of Thesis
The aim of this work was to develop a numerical analysis for
flexible risers and to validate this theory
py
experimental work.A comprehensive knowledge of hydrodynamics and hydrodynamic
loading on small cylinders is required in order to understand and
assess the hydrodynamic loading due to wave and current motion on
a flexible catenary riser. An introduction and background to this
is presented in chapter 2.
Chapter 3 describes the structure of flexible risers. It also
reviews the methods adopted to idealize the riser structure and
different numerical solution procedures for the governing
equations of motion.
Chapter 4 outlines hydrodynamic theory and presents the necessary
theory for this work which is used to assess the hydrodynamic
3
-Chapter 5 is concerned with the development of an explicit vector
method of analysis for the non-linear dynamic response of a
flexible riser. It also descibes the modification of this theory
to cater for the formfinding and static analysis of the riser.
The technique applied for these static analyses is known as
Dynamic Relaxation with kinetic damping.
Chapter 6 concerns the implementation of the above theories in
computer programs and the optimization of control parameters in
these programs.
Chapter 7 describes the two sets of experimental tests used to
validate the theory. The model for the first experiment was a
snake main which had negligible material damping. '!he aim was to
validate the assesment of the hydrodynamic forces on the riser.
The second experimental model was a polythene tube filled with
mercury am had significant material damping. The models for both
series of tests were positioned at various angles in the wave
flumes, am the latter series of tests modelled a single catenary
riser arrangement incorporating an intermediate mooring buoy.
Chapter 8 presents the results and a comparison with the
numerical predictions.
Chapter 9 presents the comparison of the results predicted by the
numerical analyses with those obtained from the riser program
"FLEXRISER" which was developed by Zentech Consultants and has
been validated by other well known flexible riser programs.
0IAPl'ER 2
LITERATURE REVIEW OF HYDRODYNAMIC LOADINGS 00' FLEXIBLE
RISER)
2.1- Introduction
This chapter covers the background study of fluid hydrodynamics
in section 2.2, and considers hydrodynamic loadings on cylinders
in sections 2.3, 2.4 and 2.5. Hydrodynamic loadings on a cylinder
can be divided into two distinct components: one consisting of
drag and inertia forces and the other of a lift force associated
with vortex-shedding. Section 2.3 is concerned with drag-inertia
forces on smooth or rough, inclined, flexible, and bundled
cylinders which are the practical cases encountered for catenary
flexible risers. Sections 2.4 and 2.5 consider respectively the
lift forces on cylinders placed in the plane of wave and current
motion and on randomly orientated cylinders.
2.2- Pluid Hydrodynamics
2.2.1- wave Hydrodynamics
A comprehensive description of wave hydrodynamics was presented
by Stokes U847). He assumed that the fluid was incompressible
and inviscid and the flow was irrotational. The incompressibility
assumption for the fluid yields the continuity equation. The
irrotationality of the flow indicates that there exists a scalar
5
-about kinematics of the motion. The continuity equation was
expressed in term of ~ which gave the Laplace equation.
A solution for ~ was obtained by solving Laplace's equation
subject to a number of boundary conditions; these conditions
being as follows:
a) bottom boundary condition - there is no flow
through the rigid bottom on which the fluid rests.
Thus, the velocity of water particles normal to the
bottom surface is zero.
b) free surface boundary conditions
1) kinematic condition - the fluid particle velocity
normal to the surface is equal to the velocity of
the free surface in that direction.
2) dynamic condition - the pressure at the free
sur-face is zero. So the unsteady bernouilli equation
can be used with a zero pressure term.
The Stokes first order theory which was identical to the linear
wave theory was obtained by solving Laplace's equation with
linearized boundary conditions. In addition, the free surface
boundary conditions were applied at the still water level rather
than the unknown free surface.
The linear wave theory predicts the following flow behaviours:
a) the fluid particles move in close orbits. The orbits
are circular in deep waters and elliptical in shallow
waters.
of the particles decrease exponentially with the depth
of the particles below the surface.
Stokes introduced a second order solution in which the wave
profile and ~ had second harmonic terms, but the celerity
remained as for first order theory. This resulted in shaqpening
the wave crest and flattening the wave trough. The particte
orbits were no longer closed and there was a net velocity in the
wave propagation direction, called drift or mass transport
velocity.
The higher orders of the Stokes wave theory (3rd and 5th orders)
were obtained using perturbation method by Skjelbreia (1958) and
Skjelbreia and Hendrickson (1960, respectively.
Since then other wave theories have been formulated. Dean 41970,
developed a non-linear wave theory which was based on a stream
f~nction rather than a potential velocity concept. This theory
was extended up to the 5th order.
The cnoidal wave theory which is used for shallow water waves was
introduced by Korteweg and Vries (18951. The wave characteristics
were expressed in terms of the Jacob ian ell ipt ic funct ion, cn.
The solitary wave theory reported by Russell in 1844 can be
considered as a limiting case of the cnoidal wave theory in
which the crests are so far apart that they can be assumed to be
separate from one another.
There are some complex modern wave theories such as Schwartz
41974, and Cokelet 41977) which can predict the flow behaviour
more accurately than other theor ies for all types of waves but
7
-results for engineering requirements, may be preferable from the
viewpoint of economic computing of dynam ic structural response
(Sarpakaya and Isaacson (1981)).
Dean (1970) made a theoretical comparison of several wave
theories. The cri ter ion for the compar ison was the closeness of
fit of the predicted motion to the complete problem formulation.
Therefore, he used the error of fit to the free surface boundary
conditions in assessing the validity of the wave theories (all
theories satisfled the bottom boundary condition). He produced a
graphical representation of the suitability of the various wave
theories for different water conditions (see fig. 4.3 , • He
recommended the first order cnoidal, the linear, the Stokes fifth
order, and the stream function wave theories over the ranges
shown in fig. 4.3.
Le Mehaute (1976) presented a graphical representation to
illustrate the suitability of various wave theories (fig. 4.4).
His graphs include the different orders of the Stokes wave theory
which is well suited for use in validating experimental wave
flume work. He stated, however, that his graph was not based on
any quantitative investigation.
A summary of the works on the compar ison of var ious wave theor ies
on both theoretical and experimental bases was given by Sarpkaya
and Isaacson (1981). They concluded that the cnoidal and Stokes
fifth order wave theories were most suitable for shallow and deep
waters respectLvely because they are relatively simple compared
with modern theories and yet produce sufficient accuracy for most
Fenton (1979) recommended the use of the conida1 wave theory for
wave lengths smaller than eight times the water depth, and the
use of Stokes fifth order wave theory for other situations.
From the foregoing discussion, it can be concluded that the
Stokes fifth order wave theory is ideal for offshore
applications. It produces the most realistic wave surface profile
which is a crucial factor in designing oil production platforms.
In the computer program which was developed in the present work,
the Stokes theories of any order (1-5) and linear wave theory can
be adopted.
2.2.2- Interaction of Wave
am
CUrrent MotionIn real sea comitions, a body is usually situated in a flow am
subjected to currents as well as waves. If the current is in the
same direction as the wave propagation, the wave length increases
and its amplitude decreases. If the current opposes the wave, the
wave gets shorter am steeper. Combinations of waves arrl currents
may be treated in two ways: a) their interaction is ignored and
the current is simply superimposed on the wave, or b) the
interaction is considered and the problem is treated as a complex
fluid-mechanics phenomeno~
There are a few experimental studies on wave and current
interaction and a review of these works has been given by
Sarpkaya and Isaacson (1981). A summary of the mathematical
formulations of these interactions was presented by Peregine
9
-Method (a) is usually adopted in offshore engineering to take
care of the presence of current action together with waves. The
water particle possess an acceleration due to wave motion which
has two convective components as well as the local one. The first
convective component is a multiple of the horizontal particle
velocity due to the wave action and the other component is a
multiple of the velocity due to the current. For txx3ies with drag
dominant loading,the inertia force due to convective acceleration
components becomes very small, so the convective romponents of
the acceleration are usually ignored.
There are different opinions concerning the estimation of the
particle velocities due to wave and current motions above still
water level for calculating the forces on offshore structures
such as risers. It is well known that the wave theories
overpredict the velocities above the still water level but this
is considered as an extra margin of safety in practice. The
current velocity is usually measured up to the still water level
and to adjust this velocity with wave profile, the following
different arbitrary techniques are used in industry:
a, by appropriate mathematical techniques the current
velocity profile is either fattened and ronsidered just
down to the wave trough, or made thinner and
ronsidered up to the wave crest.
b) the current velocity is considered up to the wave
profile. In the case of the wave profile being above
the still water level, the current velocity is
considered to be ronstant and has a value equal to that
at the still water level.
2.3 - Drag-Inertia Hydrodynamic Forces on Cylimers
2.3.1 - Hydrodynamic Forces on a Vertical Rigid Cylimer
In uniform steady flow the hydrodynamic force on a cylinder is
caused by drag action. This force which is called drag force, is
a combination of viscous and pressure drag. The viscous or skin
friction is caused by the shear stress of the water on the body.
The pressure drag which is also termed form drag is the result of
a pressure differential caused by boundary layer growth around
the surface of the cylinder and its eventual separation from the
body.
There would be an analytical solution for the drag force if the
momentum equation of fluid mechanics could be solved in the
boundary layer, but there are no such solutions available so far.
Therefore an empir ical drag coefficient "Cd" is introduced to
define the drag force. Delany and Sorensey (1953) performed
experimental work on a smooth cylinder in uniform steady flow.
They showed that Cd had a value of 1.2 in subcritical flow and
had a minimum value of 0.25 in critical flow.
In evaluating hydrodynamic forces on a body in waves, the size of
the body compared with the wave length is very important. When
the ratio of the cylinder diameter to the wave length is smaller
than 0.2, the body is categorized as a small body. The term small
body implies that the wave flow remains unaffected by the
presence of the body, that is, the cylinder does not diffract the
11
-disturb the incident wave, a diffraction theory such as that due
to MacCamyand Fuchs 11954) is used. The estimation of the forces
on large bodies is outside the scope of the present study, and is
not significant for the design of practical riser systems.
Wave loading on small bodies is calculated by using the well
known Morison equation. Morison et. al. 41950) proposed that the
total force per unit length on a vertical cylinder is the linear
sum of two components. The first component is a drag force
proportional to the square of the horizontal fluid velocity. The
drag force is represented by an empirical drag coefficient, Cd'
having substantially the same value as for steady flow
situations. The second component is an inertia force proportional
to the horizontal component of the fluid acceleration and having
an empirical inertia coefficient,~. The inertia force itself
is made up of two parts1 one is the pressure of the undisturbed
incident wave in the absence of the body which is usually known
as the Froude-Krylov force and the other is the pressure
disturbance due to the presence of the body which accounts for
the added mass effect due to the flow of the water around the
cylinder. Therefore the inertia coefficient was defined as
"l+added mass coefficient". The force coefficients were obtained
experimentally.
The Morison equation has been criticised for representing the
force on a body in time-dependent separated flow by a
linear-quadratic sum. Numerous attempts have been made either to improve
the equation or to present a new equation but so far no success
has been achieved. In spite of its theoretical drawbacks, the
industry, perhaps with due regard to the various uncertainties
and safety factors that are incorporated in design. Moreover,
considerable amounts of experimental work have been carried out
to evaluate the force coefficients, Cd and Cm, since the formulation of the Morison equation.
The Morison equation force coefficients are fluid velocity and
body geometry dependent. '!he reason for this is that their values
must take care of the complex interaction between fluid and
structure and also between drag and inertia forces. Generally,
three experimental methods are used to evaluate Cd and Cm values as follows:
I - placing body in a controlled wave flume
2 - placing body in a harmonic oscillating flow
3 - oscillating body in still water.
Schemes 2 and 3 provide a flow with simple harmonic velocity.
Since in waves the velocity is depth dependent, the horizontal
flow simulated
py
schemes 2 and 3 can be considered as the wavemotion around a particular section of a vertical cylinder, while
bearing in mind that the Morison equation expresses the sectional
force on the cylinder in terms of the horizontal fluid velocity
and acceleration at that section. The advantage of the second and
third methods over the first method is that the high Reynolds
13
-It is common practice to use constant average values of Cd and Cm for the whole cycle of the wave rather than local values. There
are several analytical methods to calculate the average values of
Cd and Cm for the exper imentally measured forces of the whole. cycle as follows:
I - Fourier-averaging technique - the force is expressed
in fourier series form and compared with the actual
measured force to obtain the average values of Cd and
~.
2 - Least squares method - the equations for Cd and Cm
are obtained by using the least squares method to
minimize the errors between the measured and the
calculated forces.
3 - The values of the coefficients obtained by considering
the measured and the calculated forces at the points
corresponding to the maximum velocity and the maximum acceleration.
4 - Wr 1 t ing the Mor ison equation once for the max imum
force and once for the zero force with the
corresponding velocities and accelerations.
5 - calculating Cd over a short wave segment in which the
drag force is dominant, and Cm over a short segment in
which the inertia force is dominant.
Morison et. al. used the 3rd averaging scheme to calculate the
A comprehensive summary of data on force coefficients has been
presented by the British Ship Research Association (1976) and
also by Hogben et. ale (1977). A few of the important papers will
be discussed here.
Keulegan and Carpenter (1958) performed experiments with
cylinders held horizontally at the node of a standing wave. They
correlated the fourier average values of the coefficients with
their period number. Their period number, which is known as the
Keulegan Carpenter number, KC, expresses the ratio of the
particle motion amplitude to the cylinder diameter. The authors
produced graphs for the variation of Cd and Cm with KC. They found a critical range .at which Cd and Cm reached their maximum and minimum values respectively at KC values around 15. In this
range the correlation between the measured force and that
predicted by the Morison equation was poor. The Fourier-averaging
technique was used to obtain the values of Cd and Cm. A residual
force function which contained the higher harmonics of Cd and Cm was introduced. This residual force was larger for the critical
range of KC numbers. These higher harmonics of Cd and Cm were ignored in the evaluation of the Cd and Cm values. The authors also did not find any variation of Cd and Cm with Reynolds number, Re, and thus concluded that the coeff ic ients were
independent of Re.
The Keulegan-Carpenter number is an important factor in assessing
the relative magnitudes of the drag and inertia forces. At low
values of KC, 95 percent of the forces exerted on the body are
inertial, whilst for intermediate values of KC (i.e. in the
15
-important. Finally at high values of Ke, 95 percent of the forces
are of drag type.
Sarpkaya (1976a) performed a series of experiments on horizontal
cylinders in uniform oscillatory flow by means of a
'u'
tubewater tunnel. He introduced another nondimensional variable,
known as the frequency parameter,
e,
which is the ratio of Re toKC. He showed the dependence of the force coefficients on KC as
well as Re. However, the coefficients were found to be
independent of Re for values below about 20,000, and this may
explain the conclusion reached by Keulegan and Carpenter H958).
The results for the coefficients were the same as the Keulgan and
carpenter values.
Sarpkaya and Isaacson (1981) presented the third harmonic of the
residual force function, which was introduced by Keulegan and
Carpenter, as the third term in the Morison equation. They
expressed the coefficient of the new term in terms of t 2-Cm ,.
The authors demonstrated that by using the new modified Morison
equation, the r.m.s. value of the residual forces, which was
presented previously by Sarpkaya (1976a), reduced by 60 percent
in the critical range of KC numbers. They suggested that
additional work along these lines may lead to a substantial
improvement of the Morison equation in the critical region of KC
nuni:>ers.
Garrison et. ale (1977) performed a series of tests in which a
cylinder was oscillated through stillwater. After making
allowance for the lack of the Froude-Krylov force in the inertia
term for this type of flow, the variations of Cd and em with Re