enterica
Xavier Didelot1.
, Rory Bowden1,2.
, Teresa Street1, Tanya Golubchik1, Chris Spencer2, Gil McVean1,2, Vartul Sangal3, Muna F. Anjum4, Mark Achtman5, Daniel Falush5,6, Peter Donnelly1,2*
1Department of Statistics, Oxford University, Oxford, United Kingdom,2Wellcome Trust Centre for Human Genetics, Oxford University, Oxford, United Kingdom, 3Strathclyde Institute of Pharmacy and Biomedical Sciences, University of Strathclyde, Glasgow, United Kingdom,4Veterinary Laboratories Agency, Addlestone, United Kingdom, 5Environmental Research Institute and Department of Microbiology, University College Cork, Cork, Ireland, 6Max Planck Institute for Evolutionary Anthropology, Leipzig, Germany
Abstract
Salmonella entericais a bacterial pathogen that causes enteric fever and gastroenteritis in humans and animals. Although its population structure was long described as clonal, based on high linkage disequilibrium between loci typed by enzyme electrophoresis, recent examination of gene sequences has revealed that recombination plays an important evolutionary role. We sequenced around 10% of the core genome of 114 isolates ofentericausing a resequencing microarray. Application of two different analysis methods (Structure and ClonalFrame) to our genomic data allowed us to define five clear lineages withinS. entericasubspeciesenterica, one of which is five times older than the other four and two thirds of the age of the whole subspecies. We show that some of these lineages display more evidence of recombination than others. We also demonstrate that some level of sexual isolation exists between the lineages, so that recombination has occurred predominantly between members of the same lineage. This pattern of recombination is compatible with expectations from the previously described ecological structuring of theentericapopulation as well as mechanistic barriers to recombination observed in laboratory experiments. In spite of their relatively low level of genetic differentiation, these lineages might therefore represent incipient species.
Citation:Didelot X, Bowden R, Street T, Golubchik T, Spencer C, et al. (2011) Recombination and Population Structure inSalmonella enterica. PLoS Genet 7(7): e1002191. doi:10.1371/journal.pgen.1002191
Editor:Josep Casadesu´s, Universidad de Sevilla, Spain
ReceivedApril 5, 2011;AcceptedJune 4, 2011;PublishedJuly 28, 2011
Copyright:ß2011 Didelot et al. This is an open-access article distributed under the terms of the Creative Commons Attribution License, which permits unrestricted use, distribution, and reproduction in any medium, provided the original author and source are credited.
Funding:This work was funded by a grant from the John Fell Fund of the University of Oxford. PD was supported in part by a Wolfson Royal Society Merit Award. PD and CS were supported in part by Wellcome Trust grants ref. 085475/Z/08/Z and 075491/Z/04. MA was supported by grant 05/FE1/B882 from the Science Foundation of Ireland. The funders had no role in study design, data collection and analysis, decision to publish, or preparation of the manuscript. Competing Interests:The authors have declared that no competing interests exist.
* E-mail: donnelly@stats.ox.ac.uk
.These authors contributed equally to this work.
Introduction
Salmonella enterica subspecies enterica (subsequently referred to simply asenterica) is a major cause of enteric fever in humans and gastroenteritis in humans and animals. Its diversity has tradition-ally been described on the basis of serological differences following the Kauffmann-White classification [1,2]. Certain serovars are linked to particular diseases and hosts. For example, enteric fever is mostly caused by members of serovar Typhi and Paratyphi A, both of which only infect humans [3]. Gastroenteritis on the other hand is most often caused by Enteritidis in humans and Typhimurium in animals [4], although both serovars can infect a wide range of hosts [3]. However, the usefulness of the serological classification of S. enterica is undermined by the fact that unrelated strains sometimes belong to the same serovar [5,6]. In an attempt to shed some new light on the population structure ofenterica, a multi-locus sequence typing scheme (MLST; [7,8]) was developed which relies on the sequencing of 400-500 bp fragments from seven housekeeping genes. This typing technique was originally applied to strains from serovar Typhi [9], and later to the whole of enterica [10,11]. Phylogenies reconstructed from MLST data are highly star-shaped [12] and therefore carry little
information about relationships between isolates. This can be traced back to substantial incongruencies between gene trees [13,12,14], which are often caused by high levels of homologous recombination [15]. This is in contrast for example with the closely related species Escherichia coli which has a well defined population structure made of several clearly defined clades [16].
available at the time of writing in the Genomes OnLine Database; [25]), and their distribution is too focused on highly virulent types to allow an exploration of the population genetics of enterica. Furthermore statistical methodology to analyze such whole-genome data efficiently is currently lacking [26,15].
Reconstructing the clonal relationships between lineages that have evolved under the influence of recombination requires data from a large number of loci [27]. We therefore designed an Affymetrix CustomSeq Resequencing Array to sequence approx-imately 300Kbp from the core genome ofentericaisolates, which represents two orders of magnitude more data per isolate than is provided by MLST. Resequencing arrays are a highly parallel DNA sequencing technology with quick application and low cost, and are based on the principle of sequencing by hybridization [28]. They have been previously applied to a wide diversity of bacterial samples, including monomorphic clones such asBacillus anthracis [29] or Mycobacterium tuberculosis [30], relatively clonal species such asBacillus cereus[31] orStaphylococcus aureus[32], and species with high rates of recombination such asNeisseria meningitidis [33] orFrancisella tularensis[34].
We applied our resequencing array to a global collection of 114 isolates from multiple major lineages ofenterica, with the exception of Typhi. Typhi was excluded because extensive studies using a wide range of molecular techniques [23,35,24,36,37] have revealed that its population biology differs from that of other lineages ofenterica. We therefore excluded Typhi from the present study in order to focus on the remainder ofenterica, which has been studied much less thoroughly. The main aims of this study were to provide an improved description of the population structure of entericaand to clarify the role played by recombination during its evolution. To this end, we analyzed our genetic data using the linkage model of Structure [38,39] and ClonalFrame [40] witha posterioriattribution of the origin of recombination events [41].
Results
Novel nucleotide sequences
For each of the 114 isolates under study (Table S1) we resequenced 146 regions of length 2000-2500bp each from the core-genome ofenterica(Table S2). These 295,137 bp per isolate represent approximately 10% of the core genome ofenterica[42]. Figure 1 illustrates the extent of our resequencing scheme on the
genome of Typhimurium LT2 [17]. On average, 85% of nucleotides were called, with variation across isolates ranging from 75% to 95%. A total of 18,068 of the resequenced sites (6%) were found to be polymorphic in this sample. Regions overlapping the seven MLST loci were included in our resequencing scheme, and by comparing our results with preexisting MLST sequences we estimated the error rate of our method to be lower than one error per 10,000 calls. Only one isolate had more than one error in its MLST gene fragments: isolate 54 (SARB32; ST82) had two errors, one in genehisDand the other in genepurE. An equivalent error rate was found when comparing the sequence of LT2 reported in [17] with our resequenced sequence of LT2. The density of errors was therefore sufficiently low enough that errors would be misinterpreted as mutations, and would not affect our results below which are essentially focused on the recombination process.
Population structure ofSalmonella enterica
We applied the linkage model of Structure [38,39] to our data and identifiedK~6ancestral populations in our sample (Figure S1). The proportion of ancestry from each of these sources is shown for each isolate in Figure 2. The 114 isolates fell into six distinct groups based on the major ancestral source of genetic diversity of each isolate. (Figure 2). Group 1 (light blue) consisted of 14 strains of Choleraesuis, Paratyphi C and Typhisuis, Group 2 (dark blue) comprised 12 strains of Typhimurium and Saint-Paul, Group 3 (orange) contained 17 strains of Montevideo, Javiana, Decatur and others, Group 4 (yellow) consisted of 19 strains of Enteritidis, Gallinarum and Dublin and Group 5 (red) comprised 5 strains of Paratyphi A and Sendai. Finally, Group 6 (cyan) contained the remaining 47 strains from diverse serovars. These groups showed relatively little admixture between ancestral sources (Figure 2), with the exception of Group 6, which seemed to have acted frequently both as a donor and as a recipient of recombinational exchanges (Figure 2).
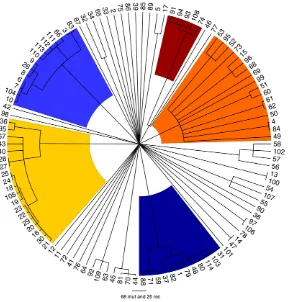
CLONALFRAMEis a method designed to reconstruct the clonal relationships between isolates in a sample, while accounting for the effect of non-vertical genetic transfer which would otherwise confuse such a reconstruction [40]. Figure 3 shows the clonal genealogy inferred from our data by ClonalFrame. The first five groups identified by Structure (Figure 2) corresponded to clades on Figure 3 and are represented with corresponding colors. Based on the combined evidence from the Structure and ClonalFrame analyses, these five groups can confidently be called lineages of enterica. On the other hand, the sixth group found by Structure encompassed the remaining isolates in Figure 3, which did not constitute a clade in Figure 3 and therefore did not represent a true lineage. Instead, seven small groups of two to four isolates formed small clades at this level of analysis according to ClonalFrame, but these were not detected by Structure. The content of the five identified lineages ofentericais summarized in Table 1.
Using Structure and ClonalFrame on MLST data only revealed parts of this population structure, and hardly revealed any relationships within lineages in comparison with the resequencing array data (Figures S3 and S4). Yet the deep phylogeny ofenterica remained largely unresolved when using our resequencing data, and in particular the relationships of the five lineages above with one another and with the rest of the isolates remained unclear (Figure 3). We estimated the age of the five lineages relative to the time of the most common ancestor of the whole ofenterica(Table 1). The common ancestor of lineage 5 was the most recent, followed by that of lineage 1. Lineage 3 was found to be particularly ancient, with an estimated age of two thirds of the age ofenterica.
Author Summary
Salmonella enterica is a species of bacteria that causes severe diseases in humans and animals. We sequenced about a tenth of the genome from a broadly sampled collection of S. enterica. By comparing these genetic sequences, we were able to partially reconstruct the ancestry of this sample. We identified five lineages within
S. enterica, one of which is almost as old as the common ancestor of our sample. We also found evidence for frequent homologous recombination in the ancestry ofS. enterica, where fragments of genes from one individual bacterium are acquired by a distinct individual. These recombination events make the ancestry harder to reconstruct in its entirety, but also contain interesting information. We found in particular that recombination had happened more often between strains belonging to the same lineage than across lineage boundaries. This observation is compatible with the lineages ofS. enterica
Uneven role of recombination inenterica
Widespread recombination has previously been suggested to explain the lack of deep structure inenterica[12,14] and we wanted to assess the role played by recombination in the evolution ofenterica. Measuring the frequency of recombination is often done relative to that of mutation [43] by forming the ratio r=hof rates at which recombination and mutation occurred in the ancestry of a sample. ClonalFrame estimated that recombination happened less frequently than mutation withr=h~0:37(95% credibility interval½0:33,0:41). Recombination can however change several nucleotides in a single event. Another measure of recombination is therefore the ratior=m
of rates at which substitutions are introduced by recombination and mutation [44]. ClonalFrame estimated that recombination and mutation had approximately the same effect in introducing polymorphism withr=m~1:14(95%CI [1.06, 1.23]). Recombina-tion was found to affect segments of length 1826 bp on average (95%CI [1670, 1980]) which is comparable to the lengths of recombination tracts estimated when comparing four genomes of
Typhimurium [40] as well as the lengths of the regions that were exchanged by Typhi and Paratyphi A [22].
We further studied recombination by looking at its specific role and patterns within each of the five lineages ofenterica. The role played by recombination seems to be uneven across these five lineages according to the Structure results in Figure 2. The isolates in recently diversified populations 1 and 5 showed no admixture (v1% of material from other populations) whereas the isolates in
[image:3.612.62.524.57.476.2]population 4, 3 and 2 had acquired 4%, 11% and 12% respectively of their genetic material from a different population (Figure 2). To confirm this observation, we extracted from ClonalFrame output the numbers of mutation events, recombination events, and substitutions introduced by recombination for each of the five lineages (Table 1). Recombination was found to have played a much more important role relative to mutation in lineages 2 and 3 (r=m= 2.17 and 2.95 respectively) than in lineages 1 and 5 (r=m= 0.20 and 0.15 respectively), and a somewhat intermediate role in lineage 4 (r=m= 0.82). These results are in good qualitative Figure 1. The circle represents the Typhimurium LT2 genome[17].The two circles in red represent the coding regions, with the forward strand on the outside and the reverse strand on the inside. The black circle indicates the proportion of 10 other genomes that aligned to each specific region of LT2, with proximity to the center indicating less genomes aligning. The yellow bars represent coverage of our sequencing scheme, and the blue bars coverage of the MLST scheme. This Figure was drawn using DNAPlotter [82].
agreement with those of Structure (Figure 2). Since lineages 1 and 5 are the most recently evolved from a common ancestor, these results point to a possible reduction in the role played by recombination in these two lineages, and maybe even throughoutenterica.
Patterns of genetic flux inenterica
[image:4.612.61.536.64.257.2]ClonalFrame estimated that within the regions imported by recombination, an average ofn~0:32%of the nucleotides were substituted (95%CI [0.31%, 0.33%]). This value of n is Figure 2. Result of applying the linkage model of Structure to our data assumingK = 6populations.Each vertical line represents one of the 114 isolates, ordered on the X axis by the proportion of ancestry from the major ancestral source. The colouring of each vertical line is proportional to the ancestry of each isolate from each of the 6 populations using the following colours: light blue, dark blue, orange, yellow, dark red and cyan representing ancestral populations 1 to 6, respectively.
doi:10.1371/journal.pgen.1002191.g002
Figure 3. Clonal genealogy inferred by ClonalFrame from our data. The first five populations identified in Figure 2 by Structure corresponded to clades of the ClonalFrame clonal genealogy and have therefore been coloured with the same colours as in Figure 2. This figure was drawn using FigTree [83].
[image:4.612.62.352.385.687.2]significantly lower than the average pairwise distance between two members ofentericawhich is around 1% [12]. The same applies to the distribution of genetic diversity introduced by recombination events (Figure S5). This observation goes against the natural tendency of ClonalFrame which is to identify more readily events between distantly related types [40,41], and therefore indicates that recombination happened predominantly between related strains during the evolution ofenterica, with recombination between distinct lineages being rarer.
We attempted to attribute an origin to each recombination event found by ClonalFrame in the five lineages following the method of [41]. Table S3 shows the events for which an origin could be unambiguously attributed, and Figure 4 illustrates the flux of recombination between the five lineages as well as the events coming from other origins withinenterica. In lineages 1, 3 and 5, the majority of events was found to come from within these lineages even if ClonalFrame is predisposed to underestimate the propensity of such events [40]. In lineages 2 and 4 however, the primary source of recombination events was ‘‘External’’, i.e. not contained within one of the five lineages (Figure 4). The origin of these events was not attributed to any isolate or group of isolates in particular, but seemed to come fairly uniformly from all parts of entericaminus the five lineages.
Discussion
Delineation ofenterica
We have sequenced approximately one tenth of the core genome from 114 isolates ofentericafrom global sources in order to study its population structure. We identified five clear lineages, defined as groups of isolates having the same majority of ancestry in the Structure analysis and representing a clade in the ClonalFrame analysis. It is likely that other similar lineages exist and would be identified using a larger sample of strains. For example, the four strains of serovar Heidelberg (labelled 44, 45, 70
and 81) were closely related to each other (Figure 3) and would probably have been called a lineage in our analysis if our sample had contained one or two more similar isolates, since lineage 5 was reconstructed based on only 5 isolates (Table 1). Our analysis did not include any isolate of serovar Typhi, which has previously been shown based on whole-genome comparisons to be highly monomorphic [19,24,36] and unrelated to other serovars [22,45]. In the context of theentericadata reported here, Typhi would thus constitute a separate and independent lineage, with all current Typhi samples descended from a recent common ancestor on this lineage.
One of the five lineages we identified is particularly ancient, estimated to be two thirds of the age ofenterica. In the absence of an internal mutation rate forenterica[46], it is currently not possible to date this age in terms of years. This ancient lineage was designated as ‘‘clade B’’ in a previous study based on MLST [12], which also noted that it might represent the deepest lineage withinentericabut that MLST data was insufficient to confirm this hypothesis. Here we provide such data and confirm the existence of this lineage. The identification of this deep lineage is in sharp contrast with a lack of resolution in the deep ancestry of enterica in general (Figure 3). A star-shaped phylogeny had also been reconstructed before based on MLST data [12]. Two non-mutually exclusive hypotheses can be proposed to explain this observation: a loss of information about clonal relationships due to extensive recombi-nation [47], and the fast growth of the effective population size shortly following the birth of the population [48].
Patterns of recombination inenterica
[image:5.612.62.556.77.338.2]It is now clear that recombination plays a driving role in the evolution of many bacteria [15], includingSalmonella [14]. It has been noted that recombination happens more often within the subspecies ofSalmonella entericathan between members of separate subspecies [13], but little is known about the details of the recombination process within subspeciesenterica. A recent study Table 1.Content of the lineages and results of the CLONALFRAMEanalysis.
Lineage 1 Lineage 2 Lineage 3 Lineage 4 Lineage 5
Color in the Figures Light Blue Dark Blue Orange Yellow Red
Isolates 14 12 17 19 5
Serovars Choleraesuis Typhimurium Montevideo Enteritidis Paratyphi A
Paratyphi C Saint-Paul Javiana Gallinarum Sendai
Typhisuis Decatur Dublin
…
MLST Sequence Types (STs) 66,68,90,114 19,27,36,50 4,20,23,24,48 10,11,73,78,92 85
133,139,145 98,99 65,70,79,80,81
146,147 93,94,96,138
eBURST MLST groups 6,20 1,14,138 40,12,41,17,42 53,4 11
43,133,33,39
prov50,prov111
Age relative to TMRCA ofS. enterica 0.15 0.2 0.66 0.23 0.08
Mutation events 624 467 1879 736 192
Recombination events 48 178 1140 144 14
Substitutions introduced by rec 122 1013 5551 604 28
Relative frequency of rec and mut 0.08 0.38 0.61 0.20 0.07
Relative effect of rec and mut 0.20 2.17 2.95 0.82 0.15
based on MLST data hinted at an unusually high rate of recombination between the Newport-II and Newport-III groups [11]. However, the number of recombination events detectable with MLST is generally too small to draw hard conclusions about rates of recombination. Here we sequenced a hundred times more data per isolate than MLST, which allowed us to reconstruct many recombination events, thus revealing clear patterns. We found evidence for recombination that varied over at least an order of magnitude across lineages ofenterica (Table 1). Different recom-bination rates for individual lineages of a same species have been found previously between the seroresistant and serosensitive clades of Moraxella catarrhalis [49], between lineages I and II of Listeria monocytogenes[50,51], and between the six hypervirulent lineages of Neisseria meningitidis [27]. It is likely that more examples will be found in future studies as improved methods for detecting recombination are applied to large datasets of whole genomes [52].
Recombination events that occurred between distantly related bacteria are easier to detect than events involving close relatives, because they introduce more polymorphism. ClonalFrame is especially biased against the detection of intra-lineage recombina-tion, because it is based on a model of extra-population recombination [40]. In spite of this, we found that recombination was predominantly between members of a lineage in at least three of the five lineages (Figure 4). At least three hypotheses can be formulated to explain this general pattern. Firstly, certain serovars ofentericaare restricted or associated with specific host species [3] which may result in greater opportunities for recombination between related strains, as previously described in Campylobacter jejuni[53]. For instance, lineage 5 consists of isolates of Paratyphi A and Sendai which are restricted to infecting humans [20,22].
However, lineage 1 contains serovars Choleraesuis, Paratyphi C and Typhisuis which share the same antigenic formula but are differentially adapted to infecting swine, humans and swine, respectively [54]. The other three lineages contain isolates from serovars that are usually described as ubiquitous [3]. Secondly, imports from a distant source might reduce the fitness of the recipients and therefore be removed by selection. Thirdly, laboratory experiments have shown that in many bacteria the chances of success of an import decrease exponentially with the genetic distance between donor and recipient due to the DNA mismatch repair system [55,56]. This decrease is particularly strong in enterica, with recombination between Typhi and Typhimurium reported to be 106 times less likely than within
Typhimurium [57,56]. The predominance of recombination events within lineages could thus reflect a fundamental property of recombination rather than ecological structuring or selection.
Speciation inenterica
The genusSalmonellais now generally accepted to contain two species,S. bongoriandS. enterica, the latter of which consists of six subspecies including subspeciesentericawhich is the subject of the present study [58,59]. Many previously named species that had been defined on the basis of phenotypic differences were regrouped into the single speciesS. entericaon the basis of DNA hybridization results [60].
[image:6.612.63.414.61.339.2]The difficulty in defining bacterial species stems from our lack of understanding of the processes involved in their formation [61]. Recombination plays a cohesive role in bacteria, so that lineages can evolve into separate species only if recombination is rare between members of distinct lineages [56,62]. Computer simula-tions have shown that reduced recombination between lineages Figure 4. Recombination flux reconstructed between the five lineages. The numbers next to each edge represent the number of recombination events coming from a given origin into a given lineage. Edges with less than 3 events have been omitted. This figure was drawn using GraphViz [84].
can lead to patterns of genetic diversity that are similar to those observed in nature [12,63]. Our reconstruction of recombination flux within and between the five lineages of enterica (Figure 4) strongly supports the existence of barriers to recombination between members of separate lineages. It is therefore possible that the five lineages we identified in enterica represent incipient species which have already diverged too far from each other for recombination to regroup them. Such incipient species have the potential to eventually become separate species unless an important shift in genetic flow occurred like the one that was recently reported betweenCampylobacter jejuniandcoli[64].
Many biological models of bacterial speciation have been proposed in the literature, and it is interesting although speculative to ask ourselves which ones apply to the diversification pattern we described in enterica. Under a strict host-association, speciation would be expected to happen through the periodic selection model where adaptation to a host progressively drives between-lineages divergence whilst constraining the genetic diversity of each lineage [65,66]. This model might apply to lineage 5 which contains serovars restricted to humans, but is unlikely to apply to the other four lineages which can be found in a range of hosts. Alternatively, speciation inentericacould be driven by co-evolution with certain bacteriophages which have been shown to infect some serovars more readily than others [67]. Under the geographic mosaic model [68,69], such uneven adaptive pressures can increase the rate of divergence between populations, and this effect was demonstrated in laboratory experiments onPseudomonas fluorescens [70]. Future research aimed at testing the geographic mosaic theory will need to investigate whether the underlying process is relevant to the evolution ofenterica[71].
Comparing Structure and ClonalFrame
The results we have described were obtained using two popular analytical tools: Structure [38] and ClonalFrame [40], which are based on very different evolutionary models. Structure assumes that each individual in the sample is a mixture from a number of unrelated ancestral populations. ClonalFrame assumes that the individuals are related via a phylogenetic framework, but that clonal relationships are occasionally obscured by recombination events. Clearly the Structure model makes more sense for highly recombinogenic species (for example H. pylori; [72]) and the ClonalFrame model for mostly clonal bacteria (for exampleYersinia pestis; [73]). However, for many species includingSalmonella enterica, recombination occurs but is not sufficiently frequent to completely erase all clonal relationships. Species with such intermediate population structure are eminently suitable for analysis by both models.
We have demonstrated that a combined approach using both methods can aid interpretations of population structure and ancestry. In order to study genetic flux, we needed to first define lineages on the ClonalFrame phylogeny (Figure 3), and Structure allowed us to determine which clades represent meaningful populations. Conversely, the clustering by Structure (Figure 2) could easily have been misinterpreted in the absence of the phylogenetic information provided by ClonalFrame. Structure suggested the existence of a sixth population which seemed to be both a frequent donor and recipient of recombination events (Figure 2). This sixth population is in fact a random mixture of all ‘‘other’’ strains that did not fall into one of the five true lineages (Figure 3) and therefore does not represent a real evolutionary lineage. We therefore interpret this sixth population as an artifact and do not believe that it represents a true evolutionary lineage. In interpreting the levels of mixed ancestry of these five lineages it is also important to note their different relative ages (Figure 3;
Table 1). Older lineages will have had more opportunities for recombination than recent ones, resulting in greater admixture in some lineages than in others. Once the outputs of the two methods were interpreted correctly in the light of each other, it became clear that they were in good agreement and allowed a more detailed and trustworthy analysis than each approach would have allowed on its own.
Materials and Methods
Bacterial isolates
We analysed a total of 114 previously described isolates of enterica including nine from the Salmonella reference collection A (SARA; [74]), and 63 of the 72 strains in theSalmonellareference collection B (SARB; [75]). The isolates were chosen to span the global diversity ofentericaas measured by serotyping and MLST. Table S1 contains the full list of the 114 isolates, including their serotype and Sequence Type (ST) in the MLST scheme of [9]. A database of isolates that have been typed using this MLST scheme is accessible at http://mlst.ucc.ie/mlst/dbs/Senterica.
Choice of genomic regions to sequence
The genome of Typhimurium LT2 [17] was aligned using Mauve [76,77] against the following ten publicly available genomes from the Genomes OnLine Database (accessible at http://www.genomesonline.org; [25]): Choleraesuis [21], Dublin (University of Illinois, unpublished), Pullorum (University of Illinois, unpublished), Paratyphi A [20], Paratyphi B (University of Washington, unpublished), Typhi CT18 [18], Enteritidis PT4 [78], Gallinarum [78], Hadar (Sanger Institute, unpublished) and Infantis (Sanger Institute, unpublished). The black circle on Figure 1 shows the proportion of these ten genomes that aligned to various parts of the LT2 genome. We selected 146 regions of length 2000-2500bp each from the core genome ofentericawhere at least nine of the ten genomes aligned with LT2. The regions were selected to be distributed evenly around the genome of LT2 (Figure 1), and to include the location of the MLST fragments of the scheme of [9]. This allowed an assessment of the accuracy of the sequencing and direct assessment of analysis based on MLST data. Table S2 contains the location and gene content of each region.
Resequencing scheme
Structure analysis
We used the Bayesian analysis tool Structure version 2.3 [38] to identify the populations present in our data. The linkage model of Structure was used; this explicitly accounts for the correlation between nearby sites that arise in admixed populations [39]. Four independent runs were performed for each value of the number of populations K ranging from 2 to 10. Each run consisted of 100,000 MCMC iterations, of which the first half was discarded as burn-in. Convergence and mixing of the program were found to be acceptable by manual comparison of independent runs with the same value ofK. The optimal value was found to beK~6 by comparing the posterior probabilities of the data given each value ofKfrom 2 to 10 (Figure S1), and identifying the value ofKwhere the posterior probabilities plateau as described in [79]. Applying the method of [80] also resulted in the estimateK~6(Figure S2).
ClonalFrame analysis
We applied the analysis tool ClonalFrame version 1.2 [40] to our data. ClonalFrame is a Bayesian inference method which jointly reconstructs the clonal relationships between the isolates in a sample, as well as the location of recombination events that have disrupted the clonal signal. Four independent runs of ClonalFrame were performed each consisting of 200,000 MCMC iterations, and the first half was discarded as burn-in. Convergence and mixing of the MCMC were found to be satisfactory by manual comparison of the runs and using the method in [81]. The genealogies estimated by ClonalFrame have branch lengths measured in coalescent units of time, which are equal to the effective population size Ne times the duration of a generation. We
multiplied this by the posterior means of the scaled mutation rate
h=2~Nemand the scaled recombination rater=2~Nerin order
to have branch lengths measured in terms of the expected number of mutation and recombination events (wheremandrare the per-generation rates of mutation and recombination).
Attribution of origins to the ClonalFrame recombination events
For each branch of the tree reconstructed by ClonalFrame, we extracted the fragments that had a posterior probability of recombination above 0.5 throughout and which reached 0.95 in
at least one position. Each such recombined fragment was then compared with the homologous sequence of all isolates other than those below the affected branch as described [41]. If a match was found with 0 or 1 difference, the origin of the recombination was attributed to the lineage to which the matching isolate belongs. If no match was found, or if several isolates from different lineages matched, the origin of the recombined fragment was considered unresolved.
Supporting Information
Figure S1 Posterior probability of the number of populations in Structure.
(PDF)
Figure S2 Procedure of Evanno et al. (2005) to determine the number of populations in Structure.
(PDF)
Figure S3 Result of STRUCTUREbased on MLST data only.
(PDF)
Figure S4 Result of CLONALFRAMEbased on MLST data only.
(PDF)
Figure S5 Distribution of genetic diversity introduced by recombination events in CLONALFRAME.
(PDF)
Table S1 List of isolates. (PDF)
Table S2 List of sequenced regions. (PDF)
Table S3 Recombination flux between and within lineages. (PDF)
Author Contributions
Conceived and designed the experiments: XD RB GM DF PD. Performed the experiments: RB TS. Analyzed the data: XD TG CS. Contributed reagents/materials/analysis tools: VS MFA MA. Wrote the paper: XD RB DF PD.
References
1. Kauffmann F (1975) Classification of bacteria: a realistic scheme with special reference to the classification ofSalmonellaandEscherichiaspecies. Munksgaard, Copenhagen.
2. Grimont P, Weill F (2007) Antigenic formulae of theSalmonellaserovars, 9th Edition. WHO Collaborating Centre for Reference and Research onSalmonella, Institut Pasteur, Paris, France.
3. Uzzau S, Brown DJ, Wallis T, Rubino S, Leori G, et al. (2000) Host adapted serotypes ofSalmonella enterica. Epidemiol Infect 125: 229–255.
4. Galanis E, Lo Fo Wong DM, Patrick ME, Binsztein N, Cieslik A, et al. (2006) Web- based surveillance and globalSalmonelladistribution, 2000-2002. Emerg Infect Dis 12: 381–388.
5. Beltran P, Musser JM, Helmuth R, Farmer JJ, Frerichs WM, et al. (1988) Toward a population genetic analysis of Salmonella: genetic diversity and relationships among strains of serotypes S. choleraesuis, S. derby, S. dublin, S. enteritidis, S. heidelberg, S. infantis, S. newport, and S. typhimurium. Proceedings of the National Academy of Sciences of the United States of America 85: 7753–7757. 6. Selander RK, Beltran P, Smith NH, Helmuth R, Rubin FA, et al. (1990) Evolutionary genetic relationships of clones ofSalmonellaserovars that cause human typhoid and other enteric fevers. Infect Immun 58: 2262–2275. 7. Maiden MCJ, Bygraves JA, Feil E, Morelli G, Russell JE, et al. (1998) Multilocus
sequence typing: A portable approach to the identification of clones within populations of pathogenic microorganisms. PNAS 95: 3140–3145.
8. Maiden MC (2006) Multilocus sequence typing of bacteria. Annual Review of Microbiology 60: 561–588.
9. Kidgell C, Reichard U, Wain J, Linz B, Torpdahl M, et al. (2002)Salmonella typhi, the causative agent of typhoid fever, is approximately 50,000 years old. Infect Genet Evol 2: 39–45.
10. Torpdahl M, Skov MN, Sandvang D, Baggesen DL (2005) Genotypic characterization of Salmonella by multilocus sequence typing, pulsed-field gel electrophoresis and amplified fragment length polymorphism. J Microbiol Methods 63: 173–184.
11. Sangal V, Harbottle H, Mazzoni CJ, Helmuth R, Guerra B, et al. (2010) Evolution and population structure of Salmonella enterica serovar Newport. J Bacteriol 192: 6465–6476.
12. Falush D, Torpdahl M, Didelot X, Conrad DF, Wilson DJ, et al. (2006) Mismatch induced speciation inSalmonella: model and data. Phil Trans R Soc B 361: 2045–53. 13. Brown EW, Mammel MK, LeClerc JE, Cebula TA (2003) Limited boundaries for extensive horizontal gene transfer amongSalmonellapathogens. Proc Natl Acad Sci 100: 15676–15681.
14. Octavia S, Lan R (2006) Frequent recombination and low level of clonality withinSalmonellaenterica subspecies I. Microbiology 152: 1099–1108. 15. Didelot X, Maiden MC (2010) Impact of recombination on bacterial evolution.
Trends Microbiol 18: 315–322.
16. Tenaillon O, Skurnik D, Picard B, Denamur E (2010) The population genetics of commensalEscherichia coli. Nature Reviews Microbiology 8: 207–217. 17. McClelland M, Sanderson KE, Spieth J, Clifton SW, Latreille P, et al. (2001)
Complete genome sequence ofSalmonella entericaserovar Typhimurium LT2. Nature 413: 852–856.
18. Parkhill J, Dougan G, James KD, Thomson NR, Pickard D, et al. (2001) Complete genome sequence of a multiple drug resistantSalmonella entericaserovar Typhi CT18. Nature 413: 848–852.
20. McClelland M, Sanderson KE, Clifton SW, Latreille P, Porwollik S, et al. (2004) Comparison of genome degradation in Paratyphi A and Typhi, human-restricted serovars ofSalmonella enterica that cause typhoid. Nat Genet 36: 1268–1274.
21. Chiu CH, Tang P, Chu C, Hu S, Bao Q, et al. (2005) The genome sequence of
Salmonella entericaserovar Choleraesuis, a highly invasive and resistant zoonotic pathogen. Nucleic Acids Res 33: 1690–1698.
22. Didelot X, Achtman M, Parkhill J, Thomson NR, Falush D (2007) A bimodal pattern of relatedness between theSalmonellaParatyphi A and Typhi genomes: Convergence or divergence by homologous recombination? Genome Res 17: 61–68.
23. Roumagnac P, Weill FX, Dolecek C, Baker S, Brisse S, et al. (2006) Evolutionary History ofSalmonellaTyphi. Science 314: 1301–1304.
24. Holt KE, Parkhill J, Mazzoni CJ, Roumagnac P, Weill FX, et al. (2008) High-throughput sequencing provides insights into genome variation and evolution in
SalmonellaTyphi. Nat Genet 40: 987–993.
25. Liolios K, Chen IMA, Mavromatis K, Tavernarakis N, Hugenholtz P, et al. (2010) The Genomes On Line Database (GOLD) in 2009: status of genomic and metagenomic projects and their associated metadata. Nucleic Acids Research 38: D346–D354.
26. Falush D (2009) Toward the Use of Genomics to Study Microevolutionary Change in Bacteria. PLoS Genet 5: e1000627. doi:10.1371/journal. pgen.1000627.
27. Didelot X, Urwin R, Maiden MCJ, Falush D (2009) Genealogical typing of Neisseriameningitidis. Microbiology 155: 3176–3186.
28. Bains W, Smith GC (1988) A novel method for nucleic acid sequence determination. J Theor Biol 135: 303–307.
29. Zwick ME, Mcafee F, Cutler DJ, Read TD, Ravel J, et al. (2005) Microarray-based resequencing of multipleBacillus anthracisisolates. Genome Biol 6: R10. 30. Sougakoff W, Rodrigue M, Truffot-Pernot C, Renard M, Durin N, et al. (2004)
Use of a high-density DNA probe array for detecting mutations involved in rifampicin resistance in Mycobacterium tuberculosis. Clin Microbiol Infect 10: 289–294.
31. Zwick ME, Kiley MP, Stewart AC, Mateczun A, Read TD (2008) Genotyping of
Bacillus cereusStrains by Microarray-Based Resequencing. PLoS ONE 3: e2513. doi:10.1371/journal.pone.0002513.
32. Dunman PM, Mounts W, McAleese F, Immermann F, Macapagal D, et al. (2004) Uses of Staphylococcus aureus GeneChips in genotyping and genetic composition analysisic composition analysis. J Clin Microbiol 42: 4275–4283. 33. Corless CE, Kaczmarski E, Borrow R, Guiver M (2008) Molecular
characterization of Neisseria meningitidis isolates using a resequencing DNA microarray. J Mol Diagn 10: 265–271.
34. Pandya GA, Holmes MH, Petersen JM, Pradhan S, Karamycheva SA, et al. (2009) Whole genome single nucleotide polymorphism based phylogeny of
Francisella tularensisand its application to the development of a strain typing assay. BMC Microbiol 9: 213–213.
35. Octavia S, Lan R (2007) Single-nucleotide-polymorphism typing and genetic relationships ofSalmonella entericaserovar Typhi isolates. J Clin Microbiol 45: 3795–3801.
36. Achtman M (2008) Evolution, population structure, and phylogeography of genetically monomorphic bacterial pathogens. Annu Rev Microbiol 62: 53–70. 37. Octavia S, Lan R (2009) Multiple-locus variable-number tandem-repeat analysis
ofSalmonella entericaserovar Typhi. J Clin Microbiol 47: 2369–2376. 38. Pritchard J, Stephens M, Donnelly PJ (2000) Inference of population structure
using multilocus genotype data. Genetics 155: 945–959.
39. Falush D, Stephens M, Pritchard J (2003) Inference of population structure using multilocus genotype data linked loci and correlated allele frequencies. Genetics 164: 1567–1587.
40. Didelot X, Falush D (2007) Inference of Bacterial Microevolution Using Multilocus Sequence Data. Genetics 175: 1251–1266.
41. Didelot X, Barker M, Falush D, Priest F (2009) Evolution of pathogenicity in the
Bacillus cereusgroup. Systematic and Applied Microbiology 32: 81–90. 42. Anjum MF, Marooney C, Fookes M, Baker S, Dougan G, et al. (2005)
Identification of Core and Variable Components of the Salmonella enterica
Subspecies I Genome by Microarray. Infect Immun 73: 7894–7905. 43. Milkman R, Bridges MM (1990) Molecular Evolution of the Escherichia coli
Chromosome. III. Clonal Frames. Genetics 126: 505–517.
44. Feil E, Maiden M, Achtman M, Spratt B (1999) The relative contributions of recombination and mutation to the divergence of clones ofNeisseria meningitidis. Mol Biol Evol 16: 1496–1502.
45. Holt KE, Thomson NR, Wain J, Langridge GC, Hasan R, et al. (2009) BMC Genomics. BMC Genomics 12: 1–12.
46. Morelli G, Didelot X, Kusecek B, Schwarz S, Bahlawane C, et al. (2010) Microevolution ofHelicobacter pyloriduring prolonged infection of single hosts and within families. PLoS Genet 6: e1001036. doi:10.1371/journal.pgen.1001036. 47. Schierup MH, Hein J (2000) Consequences of recombination on traditional
phylogenetic analysis. Genetics 156: 879–891.
48. Fiala KL, Sokal RR (1985) Factors determining the accuracy of cladogram estimation evaluation using computer-simulation. Evolution 39: 609622. 49. Wirth T, Morelli G, Kusecek B, van Belkum A, van der Schee C, et al. (2007)
The rise and spread of a new pathogen: seroresistant Moraxella catarrhalis. Genome Res 17: 1647–1656.
50. den Bakker H, Didelot X, Fortes E, Nightingale K, Wiedmann M (2008) Lineage specific recombination rates and microevolution inListeria monocytogenes. BMC Evolutionary Biology 8: 277.
51. Orsi R, Sun Q, Wiedmann M (2008) Genome-wide analyses reveal lineage specific contributions of positive selection and recombination to the evolution of
Listeria monocytogenes. BMC Evolutionary Biology 8: 233.
52. Didelot X, Lawson D, Darling A, Falush D (2010) Inference of homologous recombination in bacteria using whole-genome sequences. Genetics 186: 1435–1449.
53. McCarthy N, Colles F, Dingle K, Bagnall M, Manning G, et al. (2007) Population genetic approaches to assigning the source of human pathogens: host associated genetic import inCampylobacter jejuni. Emerging infectious diseases 13: 267–272.
54. Liu WQ, Feng Y, Wang Y, Zou QH, Chen F, et al. (2009) Salmonella paratyphi C: genetic divergence from Salmonella choleraesuis and pathogenic convergence withSalmonella typhi. PLoS ONE 4: e4510. doi:10.1371/journal.pone.0004510. 55. Majewski J (2001) Sexual isolation in bacteria. FEMS microbiology letters 199:
161–169.
56. Fraser C, Hanage W, Spratt B (2007) Recombination and the nature of bacterial speciation. Science 315: 476–480.
57. Zahrt TC, Maloy S (1997) Barriers to recombination between closely related bacteria: MutS and RecBCD inhibit recombination between Salmonella typhimuriumandSalmonella typhi. Proc Natl Acad Sci U S A 94: 9786–9791. 58. Tindall BJ, Grimont PA, Garrity GM, Euze´by JP (2005) Nomenclature and
taxonomy of the genusSalmonella. Int J Syst Evol Microbiol 55: 521–524. 59. Heyndrickx M, Pasmans F, Ducatelle R, Decostere A, Haesebrouck F (2005)
Recent changes inSalmonellanomenclature: the need for clarification. Vet J 170: 275277.
60. Crosa J, Brenner D, Ewing W, Falkow S (1973) Molecular relationships among the Salmonellae. J Bacteriol 115: 307315.
61. Achtman M, Wagner M (2008) Microbial diversity and the genetic nature of microbial species. Nature Reviews Microbiology 6: 431–440.
62. Fraser C, Alm EJ, Polz MF, Spratt BG, Hanage WP (2009) The bacterial species challenge: making sense of genetic and ecological diversity. Science 323: 741–746.
63. Hanage WP, Spratt BG, Turner KME, Fraser C (2006) Modelling bacterial speciation. Phil Trans R Soc B 361: 2039–44.
64. Sheppard S, McCarthy N, Falush D, Maiden M (2008) Convergence of
Campylobacter Species: Implications for Bacterial Evolution. Science 320: 237–239.
65. Cohan FM (2001) Bacterial species and speciation. Systematic biology 50: 513–24.
66. Cohan FM, Perry EB (2007) A systematics for discovering the fundamental units of bacterial diversity. Curr Biol 17: 373–386.
67. Carey-Smith GV, Billington C, Cornelius AJ, Hudson JA, Heinemann JA (2006) Isolation and characterization of bacteriophages infecting salmonella spp. FEMS Microbiol Lett 258: 182–186.
68. Thompson J (1999) Specific hypotheses on the geographic mosaic of coevolution. American Naturalist. pp 1–14.
69. Thompson J (2005) The geographic mosaic of coevolution. University of Chicago Press.
70. Buckling A, Rainey PB (2002) The role of parasites in sympatric and allopatric host diversification. Nature 420: 496–499.
71. Gomulkiewicz R, Drown DM, Dybdahl MF, Godsoe W, Nuismer SL, et al. (2007) Dos and don’ts of testing the geographic mosaic theory of coevolution. Heredity 98: 249–258.
72. Falush D, Wirth T, Linz B, Pritchard JK, Stephens M, et al. (2003) Traces of human migrations inHelicobacter pyloripopulations. Science 299: 1582–1585. 73. Morelli G, Song Y, Mazzoni CJ, Eppinger M, Roumagnac P, et al. (2010)
Yersinia pestis genome sequencing identifies patterns of global phylogenetic diversity. Nat Genet 42: 1140–1143.
74. Beltran P, Plock SA, Smith NH, Whittam TS, Old DC, et al. (1991) Reference collection of strains of the Salmonella typhimurium complex from natural populations. J Gen Microbiol 137: 601–606.
75. Boyd EF, Wang FS, Beltran P, Plock SA, Nelson K, et al. (1993)Salmonella reference collection B (SARB): strains of 37 serovars of subspecies I. J Gen Microbiol 139: 1125–1132.
76. Darling AC, Mau B, Blattner FR, Perna NT (2004) Mauve: multiple alignment of conserved genomic sequence with rearrangements. Genome Res 14: 1394–1403.
77. Darling A, Mau B, Perna N (2010) progressiveMauve: Multiple Genome Alignment with Gene Gain, Loss and Rearrangement. PLoS ONE 5: e11147. doi:10.1371/journal.pone.0011147.
78. Thomson NR, Clayton DJ, Windhorst D, Vernikos G, Davidson S, et al. (2008) Comparative genome analysis of Salmonella Enteritidis PT4 and Salmonella
Gallinarum 287/91 provides insights into evolutionary and host adaptation pathways. Genome Res 18: 1624–1637.
79. Pritchard JK, Wena X, Falush D (2009) Documentation for structure software: Version 2.3, http://pritch.bsd.uchicago.edu/structure.html..
80. Evanno G, Regnaut S, Goudet J (2005) Detecting the number of clusters of individuals using the software structure: a simulation study. Mol Ecol 14: 2611–2620.
82. Carver T, Thomson N, Bleasby A, Berriman M, Parkhill J (2009) DNAPlotter: circular and linear interactive genome visualization. Bioinformatics 25: 119–120. 83. Rambaut A (2008) FigTree, a graphical viewer of phylogenetic trees, Available
from http://tree.bio.ed.ac.uk/software/figtree/.