City, University of London Institutional Repository
Citation
: Bleisch, S., Dykes, J. and Nebiker, S (2008). Evaluating the effectiveness of
representing numeric information through abstract graphics in 3D desktop virtual
environments. Cartographic Journal, The, 45(3), pp. 216-226.
This is the unspecified version of the paper.
This version of the publication may differ from the final published
version.
Permanent repository link:
http://openaccess.city.ac.uk/173/
Link to published version
:
Copyright and reuse:
City Research Online aims to make research
outputs of City, University of London available to a wider audience.
Copyright and Moral Rights remain with the author(s) and/or copyright
holders. URLs from City Research Online may be freely distributed and
linked to.
City Research Online:
http://openaccess.city.ac.uk/
[email protected]
R E F E R E E D P A P E R
Evaluating the Effectiveness of Representing Numeric
Information Through Abstract Graphics in 3D Desktop
Virtual Environments
Susanne Bleisch, Jason Dykes and Stephan Nebiker
Institute of Geomatics Engineering, School of Architecture, Civil Engineering and Geomatics, University of Applied Sciences Northwestern Switzerland (FHNW), CH-4132 Muttenz / Switzerland
Email [email protected]
The use of bars to represent numeric values in desktop virtual environments that provide information in 3D through monocular depth cues is evaluated. Using empirical experiments we test hypotheses regarding the effectiveness of participants in judging the heights of different bar combinations in four different settings (static 2D and 3D desktop virtual environment with and without frames). The results show that the participants are highly successful in identifying the taller of two bars. However, there are significant differences between the static 2D and 3D desktop virtual environment settings in terms of accuracy and task completion times when comparing bars. Characteristics such as the participant’s spatial abilities or the position of the bars in the landscape do not influence the effectiveness of the judgements in our study.
INTRODUCTION
The goal of this study is to explore the degree to which bars of specific height can be utilised to represent numeric information at geographic locations in 3D desktop virtual environments. It is one of an on-going series of experiments driven by the widespread and increasing availability of data and technology through which such interactive 3D repre-sentations can be fashioned. Through these experiments we are evaluating the notion that the visual integration of 3D landscape models with the graphical representation of numeric values may, in contexts such as those specified below, provide a mechanism for the effective synthesis and graphical analysis of geographic information. The use and interpretation of 3D ‘spatial bar charts’ may in turn lead to faster, better informed decisions. This is dependent upon an ability to interpret and compare numeric information represented in abstract ways in 3D desktop virtual environ-ments that use monocular depth cues such as perspective, size gradient or ‘structure-from-motion’ (Ware, 2004).
Landform related data is currently available from a number of diverse sources including environmental mon-itoring stations (e.g. Lehning, 2008), usage logs of mobile applications and specialist atlases (e.g. Piatti and Hurni, 2007). The availability of such data is likely to increase in the near future, especially with the extended utilisation of sensor networks (Bottset al., 2006; Morville, 2005; Gross, 1999).
Desktop virtual reality environments or geo-browsers such as Google Earth (Google, 2008) and NASA World Wind (NASA, 2008) are hugely popular and a whole host of different data and information, such as that relating to landform, is being integrated into these interfaces to the Earth (Nebikeret al., 2007; Butler, 2006). The popularity and accessibility of these desktop-based applications that are useable without any special hardware reinforces the need for research into the effectiveness of the technology (Slocumet al., 2001), how such visualisation may be used for exploratory data analysis (Thomas and Cook, 2005; Gahegan et al., 2001) and how we can define rules and recommendations for appropriate representations of the kind of additional information that geovisualisation relies upon in 3D environments (Polys and Bowman, 2004; Jobst and Germanchis, 2007).
Evaluating the effectiveness of combining graphical displays of numeric information with virtual landscape representations is important in this context. We do so by measuring responses to known stimuli. This is a somewhat psychophysical approach, although we do not control all parameters due to the interactive and exploratory nature of 3D desktop virtual environments. In desktop-based appli-cations, the 3D virtual environment is projected onto the 2D screen and depth cues are used to ensure that the scene is perceived as being 3D. The most accessible and popular applications use monocular depth cues rather than
binocular depth perception such as stereoscopic viewing (Ware, 2004) or ‘True 3D’ (Kirschenbauer, 2005). These have an influence on the shape and size of symbols used to represent data in the virtual environment and we analyse the way in which users are able to overcome these effects in desktop virtual environments by providing specific repre-sentations and allowing interaction with the application.
The results of this study will be used in complimentary research in which users experiment with more diverse and dense data sets and analysis tasks through which we hope to gain insight into their cognitive abilities in relating data to landform. Ultimately, we plan to involve domain experts in real applications in evaluating displays that combine abstract information with virtual realism in 3D environ-ments. In combination, this series of studies that draw upon psychophysical, cognitive and user-centred approaches (e.g. Gilmartin, 1981, Slocum et al., 2001; Fuhrmann et al., 2005) will help to advance our understanding of the use of geovisualisation with 3D desktop virtual environments as an analytical device ‘in-vivo’ and to develop appropriate recommendations and practice.
Design of display graphics
Geo-browsers have a focus on photorealism, but may be used as a basis for exploring, analysing and comparing numeric information related to the landscape visualised (MacEachren et al., 1999). In statistical graphics, it is common to use the length and area of abstract symbols to effectively show quantity (Tufte, 2001; Cleveland and McGill, 1984). Thus, typical displays for the comparison of different measurements include bar charts, spine plots and mosaic plots. Judging the height of bars positioned at different locations in two dimensional space is effectively a judgement of length or ‘position [on a] non-aligned scale’ (Cleveland and McGill, 1984, p. 532). Cleveland and McGill found this to be the third (length) or second (position on a non-aligned scale) most effective mode of representation for extracting quantitative information from graphs in their experiments. Thus, the application of bars differing in size may also be effective for displaying quantitative spatial information in 3D desktop virtual environments. However, in this situation a problem occurs. Changes in length and area are perceptual cues that make the viewer perceive the environment as 3D (Ware, 2004; Kraak, 1988). For example, bars representing different measurements at different locations will not only differ in height due to the value they represent but also due to the depth cue they provide according to their position (e.g. smaller in the background). In the real world, most people are aided in their judgment and perception of the environment through their ability to see in stereo. However, this ability is limited to the immediate vicinity. For objects that are more distant and sometimes also for closer objects, we rely on depth cues such as differences in size, occlusion or shading. Ware (2004, p. 289) even argues that ‘stereoscopic depth can play no role at all at distances beyond 30 m’. Thus, we may be well-trained in judging objects according to depth cues rather than seeing them stereoscopically. Ware (2004, p. 262) paraphrases Hagen (1974) stating ‘when we perceive pictures of objects, we enter a kind of dual perception mode. To some extent, we
have a choice between accurately perceiving the size of the depicted object as though it were in a 3D space and accurately perceiving the size of the object at the picture plane.’ Rock (1998) explains that in the real world the user is able to judge the size of objects (relative differences) because the position in the perceived 3D environment is known (size constancy).
We use these statements and ideas as a basis for empirical experiments investigating the judgements made by a set of users when perceiving and comparing the sizes of objects in 3D desktop virtual environments that they explore inter-actively. Billboards, or sprites (Akenine-Mo¨ller and Haines, 2002) of different height were inserted into a 3D environment to produce 3D bar charts in a geo-browser. These are planar objects that always face the user and thus allow navigation, but avoid further judgement difficulties such as those incurred when asking participants to consider volumes or to examine objects from different angles. The absolute width of the billboards is constant but varies visually according to the position of the bar to provide a depth cue in the virtual environment. The height of the billboard varies in relation to the quantitative value displayed and also according to the depth cue that it provides. According to Tufte’s principles of graphical excellence (Tufte, 2001) data graphics should make efficient use of ink. For example, displaying one-dimen-sional data through areas that are two-dimenone-dimen-sional may confuse those interpreting the graphic. In the case described here, the use of area is justified as one dimension is used as depth cue. Tufte also states that ‘redundancy, upon occasion, has its uses: […] facilitating comparison over various parts of the data […]. (p. 98)’. To improve readability of data graphics in the 3D setting it might make sense to use a reference grid that has been shown to facilitate comparison between different panels in other contexts (Cleveland, 1994, application of Weber’s Law in Baird and Noma, 1978). We compare data graphics consisting of bars of known length in static 2D and interactive 3D contexts and compare graphics that use frames of a fixed size (reference grid) with those that are frame free.
Research aims
and skills and abilities in spatial reasoning and navigation. To achieve this aim, we design and implement experiments involving bar height estimation and comparison to test the following hypotheses:
H1: Users are able to identify the taller of two bars in a 3D desktop virtual environment as well as they can in static 2D graphics.
H2: The effectiveness of estimating differences between two bars is not significantly different in the 2D and 3D settings.
H3: The efficiency of task completion is improved by the use of a reference grid (frame) (in the 2D and 3D settings).
H4: The efficiency of estimating absolute values from bar lengths (with a reference grid, frame)1 is not significantly different in the 2D and 3D settings. The results are considered in relation to a number of factors that may influence task performance, including the positions of the bars in the landscape and the general spatial abilities of participants in the experiment (see Results section for the detailed questions).
EXPERIMENT
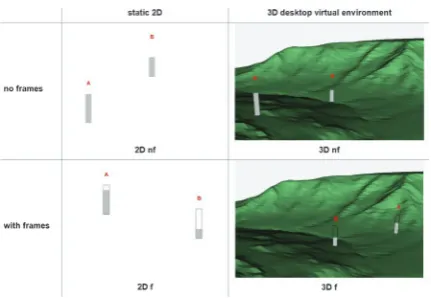
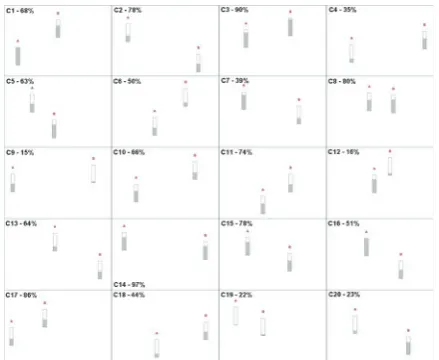
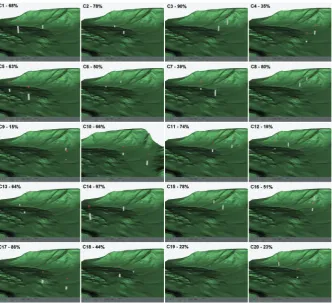
[image:4.595.317.533.77.226.2]To explore these issues we conducted an experiment using a 262 factorial within-subject design randomising the order of the experiment assignments. The two independent variables are nature of representation (static 2D vs. 3D desktop virtual environment) and ancillary graphics (bars with and without frames). Whilst we do not isolate dimensionality from other aspects of the 3D desktop virtual environment representation (including interactivity and different information content), we refer to this representa-tion as ‘3D’ as our users found this a useful way of describing the distinction. Our experiment uses 20 different combinations of two values randomly selected from the range 1–99. The 20 combinations (subsequently named C1–C20) represent the range of possible bar combinations with the smaller bar varying from being between 15% of the height of the taller bar up to 97%. These 20 combinations are displayed at random locations in four different settings: the bars with frames and without frames on a surface in a 3D desktop virtual environment and as static 2D bar charts (Figure 1). The surface used in the 3D setting consists of an undulating part of the real world, made unrecognisable. We use this consistently in all 20 combinations which provide a range of comparative tasks that may be indicative of the kinds of comparisons made from a real data set. Two tasks are completed in which participants are asked to interpret numeric information from bar displays in all four settings (2D and 3D with and without frames): identifying the taller bar and comparing two bars (estimating how tall the shorter bar is compared with the taller). Additionally, the task of estimating absolute bar heights from bar displays with frames in the 2D and 3D setting was completed. This allows us to evaluate the participant’s accuracy in estimating
the height of a single bar in contrast to the task of comparing the two bars.
Participants and implementation
The experiment was conducted with a group of 26 final semester bachelor geomatics students who had some experience of using 3D displays. Each participant com-pleted each task with a random selection of 10 of the 20 bar combinations in each setting (‘2D f’, ‘2D nf’, ‘3D f’ and ‘3D nf’). A subgroup of 18 participants conducted the additional experiment of estimating absolute bar heights in the ‘2D f’ and ‘3D f’ settings. The information was displayed using JPEG images (2D) and X3D environments (3D). The 3D environments were viewed and navigated using the Flux Player software. The participants were encouraged to navigate in the virtual 3D environment if they thought it helped accomplish the tasks but were reminded that this was an efficiency test and that comple-tion times were being recorded. The experiments in 2D and 3D were administered and the participant’s answers and task times were recorded using the quiz facility of the WebCT e-Learning platform with which participants were familiar. They performed the experiment on generally available desktop computers at our institution in controlled and consistent conditions. After performing the different tasks, the participants were given the option of commenting in writing on any aspect of the experiment and their performance. This helps us to triangulate between the subjective opinions and ideas of the participants and the more formal numeric data analysis (Elmeset al., 2006).
Collected data
The data collected for each task included a statement regarding which of the two bars participants judged to be taller (A, B or equal), the percentage value when estimating the height of the shorter bar in comparison to the taller bar and the time needed to fulfil those two tasks (judging the displays and recording the answers). For the 3D settings the time recorded also includes the duration of starting and closing the 3D scene, which takes an average of 3 s but depends on the load on the Internet connection. The
1Note that absolute height judgements of bars are only possible with a reference grid.
The bars without frames could only be judged absolutely by providing further scale references or functionality.
accuracy of the comparison of the two bars in each setting is evaluated using the difference between the participant’s estimated value and the actual percentage value (e.g. smaller bar is 67% of the taller bar, if the participant’s estimation is 70%, then the difference ofz3 is used for the evaluation of the results). The expected values for these differences are 0 for precise estimations by the participants. There is a slight bias in the data as people tend to estimate the differences in 5 or 10 s (e.g. estimation of 65 or 70% and not 67%). But the data compensates for this bias as under and over judgments can be assumed to be made with equal frequency.
Three of the 1400 data sets collected were ignored because of null responses. The data were checked for errors and inconsistencies, such as participants using 0 instead of 100 to record equality or entries using decimals instead of percentages for comparison. Such cases were corrected before analysis.
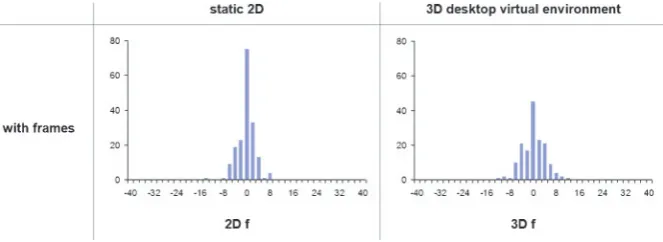
For the analysis of the estimation of the absolute bar height in the 2D and 3D settings with frames the differences between the estimated and the actual bar heights are used. The expected value for this difference is 0. Figure 4 shows the histograms of the differences in the 2D and 3D setting. From the 360 data sets collected, 24 were ignored as in these cases participants compared the two different bars rather than estimating the absolute heights of the two bars. The data set sizes aren5179 for ‘2D f’ andn5157 for ‘3D f’.
Data analysis
The quantitative data were statistically analysed to test our hypotheses (see Research aims subsection above). The data sets approximate to a normal distribution (differences – shown in Figure 2 and Figure 4) or lognormal distribution (times – shown in Figure 3) and so it is appropriate to describe them by their means, standard deviations and minimum and maximum values. Different aspects of the data are compared and related to influencing factors by calculating correlations between the data sets.
Student t-tests were employed for hypothesis testing, using a significance level of 95% (a 5 0.05), to test for differences of the mean from 0. Differences between the data sets of the different settings are evaluated using ANOVA and Tukey-Tests (Zar, 1984).
RESULTS
H1: Identification of the taller bar
[image:5.595.325.542.77.227.2]The analysis shows that the participants were able to identify the taller bar in all four settings (2D and 3D with and without frames) in almost 100% of the cases (Figure 5). In each setting, a number of bar combinations, mostly with proportions higher than 80%, were judged as being equal (Figure 6, and shown by the grey portions in Figure 5). Figure 2. Histograms of the differences of the bar comparison in
[image:5.595.61.280.78.226.2]all four settings (class width 52, n5260 per setting). Differences are normally distributed
Figure 3. Histograms of task completion times in all four settings (class width 5 5 s, n5260 per setting), 3 s of 3D scene start-up time were subtracted in the two 3D settings ‘3D f’ and ‘3D nf’. Task completion times are lognormally distributed
[image:5.595.136.468.608.729.2]The bar combinations for which the incorrect bar was selected as being the taller one are shown in Table 1 for each setting. These combinations are equivalent to the orange portions of Figure 5. The percentage values show the height of the smaller bar in proportion to the larger. Images of all bar combinations (C1–C20) in the 2D and 3D settings can be found in Figure 13 and Figure 14.
H2 and H3: Estimating the difference between two bars
The task of comparing the absolute values of the two bars (Figure 7 and Figure 8) is completed with the same level of success in the 3D settings as in the 2D settings. The frames do not improve the accuracy of the comparison but the participants are a little faster and seven qualitative state-ments mention that the tasks feel easier to complete with frames. Two different statements note that for the settings with frames (2D and 3D) the task of comparing the two bars is more complex. Rather than comparing the two bars directly participants initially estimated the height of each
bar and then performed the comparison from those values. Despite this reported complexity these participants are more content with task completion in the settings with frames.
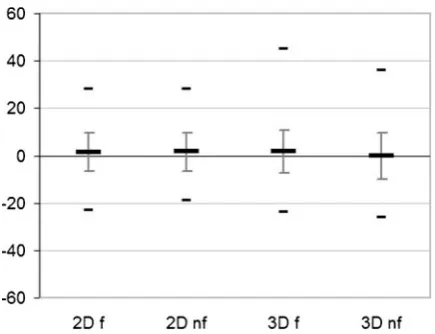
Applying a Student t-test shows that the means of the differences between estimated and actual values for the settings ‘2D f’, ‘2D nf’ and ‘3D f’ (Figure 7) are significantly different from 0 (a 5 0.05). The mean of the differences in setting ‘3D nf’ is not significantly different from 0. Using ANOVA and Tukey-Tests to test the hypothesis that the means of the differences per setting are equal (H0: m2Df 5 m2Dnf 5 m3Df 5 m3Dnf)
[image:6.595.316.534.77.244.2]results in the rejection of H0. The alternative hypothesis
[image:6.595.56.271.77.229.2]Figure 5. Correct and incorrect judgments of the taller bar. Grey values indicate bar combinations judged as being of equal size. (n5260 per setting)
Table 1. Selection of incorrect bar as being the higher bar for each setting (proportion of the two bars as a percentage)
2D f 2D nf 3D f 3D nf
16C19 – 22% 16C6 – 50% 16C9 – 15% 16C3 – 90%
16C13 – 64% 16C6 – 50% 26C14 – 97%
16C10 – 66% 16C5 – 63%
16C1 – 68% 16C3 – 90%
16C14 – 97% Figure 6. Frequency of bar combinations judged as being of equal
size (proportion of the two bars as a percentage)
[image:6.595.52.270.277.391.2]Figure 7. Mean, standard deviation, and minimum/maximum values of the differences between estimated and actual values in all four settings (n5260 per setting)
[image:6.595.39.544.681.753.2]H1:m2Df5m2Dnf5m3Df?m3Dnfis accepted ata50.05.
This analysis allows us to conclude that participants in our experiment tended to slightly, but significantly, over-estimate the size of the smaller bar in respect to the taller bar in the two 2D settings and in the ‘3D f’ setting, but not in the case of ‘3D nf’.
Using ANOVA and Tukey-Tests to test the hypothesis that the means of the times per setting are equal (H0:m2Df
5m2Dnf5 m3Df 5m3Dnf) results in the rejection of H0.
Alternatively, the hypothesis H1:m2Df5m2Dnf?m3Df?
m3Dnfis accepted (note that 3 s of 3D scene start-up time
were subtracted in the two 3D settings ‘3D f’ and ‘3D nf’). Estimating the differences in size between the two bars takes significantly more time in the 3D settings and within the 3D settings significantly more time for the ‘3D nf’ setting. The qualitative statements show that some parti-cipants felt they spent a considerable amount of time navigating the 3D scenes. Whilst navigation, exploration and spending time with the scene content may reduce efficiency as measured here it may have benefits that we are not measuring in these experiments such as increased confidence in results or understanding of topography and the spatial arrangement of the measurements. Such aspects will be the focus of future experiments.
H4: Estimating absolute bar heights
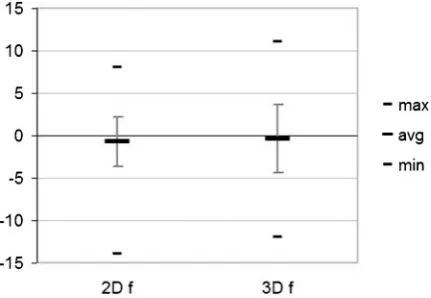
The task of estimating absolute bar heights from displays with frames is completed with the same level of success in the 3D setting as in the 2D setting (Figure 9 and Figure 10). Applying a Student t-test shows that the mean of the differences (Figure 9) is significantly different from 0 for the setting ‘2D f’ (a 5 0.05). Here, the participants tend to slightly underestimate the bar heights when res-ponses are compared with the actual values. Nevertheless, the high accuracy of bar height estimation especially in the ‘3D f’ setting helps explain why the task of comparing two bars in the settings with frames is still highly accurate even though participants stated that they tend not to compare the bars directly but rather estimate the heights indepen-dently first before undertaking the comparison.
Using a Tukey-Test for the means of the task completion times, the alternative hypothesis m2Df ?m3Df is accepted
with the 3D setting once again taking longer (note that 3
seconds of 3D scene start-up time were subtracted in the setting ‘3D f’).
Influence of general spatial abilities of the participants
The results gained from participants in the two 3D settings are compared with general spatial abilities as measured by the Santa Barbara Sense of Direction test (Hegarty, Richardson et al., 2002) to provide some insights into one of a number of possible influences. The SBSOD test was conducted with a subgroup of 10 participants, all of whom achieved a reasonably high sense of direction (SOD) value, confirming that our efforts to focus on users with spatial and navigation skills had been successful. This small number, however, means that any results can only be used to suggest trends. The correlation coefficients r(Table 2) and scatter plots (Figure 11) do not strongly suggest that correlations exist between the SOD of the participants and their task performance in the two 3D settings when measured using absolute means of differences between estimated and actual values of bar size differences. The task performance in one 3D setting is, however, strongly correlated (r 5 0.727) with the task performance in the other 3D setting (comparing the means of differences per participant) showing some consistency in the performance and response of individual users.
Influence of various aspects on the experiment outcomes
Various different aspects of the experiments conducted here may have an influence on the results reported above. We calculated correlations to answer the following questions that relate to the geography of our examples and the time that users spent on the tasks:
[image:7.595.63.279.80.229.2]Figure 9. Mean, standard deviation, and minimum/maximum values of the differences between recorded and absolute values when estimating absolute values
[image:7.595.313.554.707.753.2]Figure 10. Mean, standard deviation (calculated from lognormal distribution), and minimum/ maximum values of tasks completion time for estimating and recording absolute values
Table 2. Correlation coefficients (r) describing the relationships between sense of direction (SOD) of participants and the participant’s task performance (absolute means of differ-ences) in the two 3D settings and between the two 3D settings (with and without frames, means of differences)
3D nf 3D f
SOD 20.035 0.376
1) Do participants perform better when they spend more time on the different tasks?
2) 2D settings: Are bar combinations easier to evaluate when more closely aligned along a common base line? 3) 3D settings: Are bar combinations more accurately compared if they are nearer to each other in the landscape?
1) Coefficients of correlation between the means of completion times and the absolute means of the bar comparison differences were calculated for each parti-cipant and setting. Table 3 shows that task perfor-mance does not seem to be correlated with the time taken to perform the tasks. Participants may need more time to fulfil the tasks but are not performing more effectively in terms of our metrics.
2) We calculated coefficients of correlation between absolute means and the standard deviations of the bar comparison differences per bar combination in the two 2D settings with values describing the absolute vertical non-alignment of the bar combinations, the horizontal distance between bars and the 2D diagonal distance between the two bars. Table 4 shows that the performance per bar combination (measured as the absolute means of the differences per bar combination) in the two 2D settings is not correlated with the absolute vertical bar non-alignment. The standard
deviations of the differences show a weak positive correlation with the absolute vertical bar non-alignment. This suggests that the bar comparison results may vary more the further the two bars are vertically separated coinciding to some degree with the findings of Cleveland and McGill (1984) regarding non-alignment in the 2D setting.
[image:8.595.129.464.76.187.2] [image:8.595.42.546.556.591.2]3) We correlated the absolute means and the standard deviations of the differences of bar comparison in the 3D settings with the 3D distance (calculated from horizontal and vertical differences between the two bars) between the bars per bar combination. Table 5 shows that the performance per bar combination (measured as the absolute means of the differences per bar combination) in the two 3D settings is not correlated with the 3D distance between the two bars. The standard deviations of the differences are to some degree correlated with the 3D distance, though this is a weak correlation. This suggests that here, as in the 2D settings, bigger vertical or horizontal differences between the two bars may result in higher variation in the results but there is no evidence that it results in less accuracy. Similar experiments may be conducted in areas were the topography varies more dramatically. The effects of horizontal, vertical or 3D distances between bar locations may be more influential in such Figure 11. Scatter plots of the relationships between sense of direction (SOD) of participants and the participant’s task performance (absolute means of differences) in the two 3D settings and between the two 3D settings (with and without frames, means of differences)
Table 3. Correlation coefficients for the correlation between the participant’s mean task performance time and their absolute mean of bar comparison differences per setting
Absolute mean of differences 2D f 2D nf 3D f 3D nf
Mean times 20.198 20.261 20.181 20.153
Table 4. Correlation coefficients for the correlation between the means and standard deviations of differences of bar comparisons and the absolute vertical non-alignment per bar combination, the horizontal distance and the diagonal distance
Correlation between… Absolute means of differences Standard deviations of differences
Absolute vertical bar non-alignments 0.178 0.365
Horizontal distances between bars 0.043 20.119
Diagonal distances between bars 0.060 20.054
Table 5. Correlation coefficients for the correlation between the mean of differences of bar comparison per bar combination and the 3D dis-tance between the two bars per bar combination
Correlation between… Absolute means of differences Standard deviations of differences
[image:8.595.42.546.627.683.2] [image:8.595.41.546.717.753.2]landscapes as may be the case in sections of a landscape in which occlusion is an issue.
Comparing the different bar combinations
The same 20 combinations of bars (C1–C20) are used for the different tasks in all four of our settings (2D and 3D with and without frames). Thus, the performance per bar combination can be evaluated and compared between the different settings. Figure 12 shows the participants’ perfor-mance per bar combination in all four settings (‘2D f’, ‘2D nf’, ‘3D f’ and ‘3D nf’). The results shown here can only suggest trends as the sizes of the datasets per bar combination and setting are small (8(n>18). Certain bar combinations, seem more difficult to compare in all four settings than others. For example, performance is strong with combinations C9, C16 or C20 and less strong with C2, C10 and C13, which seem more difficult combinations (images of the bar combinations in the 2D and 3D settings are shown in Figure 13 and Figure 14). This suggests that small bars with little difference are more difficult to compare than taller bars or bars with a big difference in height. In practice, we are unlikely to be able to freely define the size of the bars that represent real measurements recorded in the field. However, appropriate scaling of the data may improve the readability and comparison of data displays where bars are small and these results support the case for interactive tools that aid comparison between bar values in certain cases.
CONCLUSIONS AND IMPLICATIONS
The results reported here show that when pairs of bars of varying height and constant width are used to represent numeric values in 3D desktop virtual environments, the numbers represented can be estimated and compared effectively. Skilled users are very successful in separating the perception of monocular depth cues such as perceived variations in the width and height of the bars in the
landscape from the actual values the bars represent by their heights. It seems that we are indeed well-trained in judging objects according to depth cues rather than seeing them stereoscopically as indicated in the Introduction. This knowledge serves as a basis for studies evaluating more dense and multivariate data sets with more complex tasks in virtual 3D environments.
Research Hypotheses
Revisiting the research hypotheses we find the following:
H1: Users are able to identify the taller of two bars in a 3D desktop virtual environment as well as they can in static 2D graphics.
[image:9.595.59.553.81.276.2]Informally, the evidence suggests that the participants are able to identify the taller of two bars in all four settings. Thus hypothesis 1 is accepted. As we have shown above, the taller bar could be identified in Figure 12. Mean, standard deviation, and minimum/maximum values of bar comparison differences per bar combination (C1–C20) for all four settings (‘2D f’, ‘2D nf’, ‘3D f’ and ‘3D nf’)
[image:9.595.324.544.539.719.2]almost 100% of the cases in all four settings (‘2D f’, ‘2D nf’, ‘3D f’ and ‘3D nf’). Most errors occurred where the smaller bar was sized 86% or more of the larger bar, independent of absolute bar size. Even though the identification of the tallest bar in a display is easily computed and indicated, for example by a different colour, it is assumed that the successful completion of this basic task is helpful for mastering more complex tasks such as identifying clusters of bars that are taller than the surrounding bars or relating bar heights to landform.
H2: The effectiveness of estimating differences between two bars is not significantly different in the 2D and 3D settings.
The results discussed above show that we reject hypothesis 2 as there are significant differences between the 2D and 3D settings.
H3: The efficiency of task completion is improved by the use of a reference grid (frame) (in the 2D and 3D settings).
Hypothesis 3 is rejected for the 2D settings as there were no significant differences found between the settings with and without frames in 2D. However, in the 3D setting with frames the tasks take significantly less time than in the 3D setting without frames. In general, participants tend to slightly overestimate the size of the smaller bar in respect to the taller bar. However, the use of frames does not have significant effects on the accuracy of the judgments of bar differences in either positive or negative ways. The task of comparing bar heights took significantly more
time in the 3D settings compared with the 2D settings and was thus less efficient. This effect may be attributed to the fact that the participants navigated in the 3D scenes before making a judgement of bar heights. Ware (2004) mentions that no interaction or navigation can ever be as fast as simple eye movement such as needed for the 2D settings and our findings support this contention. Further experiments will need to evaluate whether the additional efforts in terms of time are worthwhile compared with possible gains that may be achieved when judging numeric values in the context of 3D landscapes.
H4: The efficiency of estimating absolute values from bar lengths (with a reference grid, frame) is not significantly different in the 2D and 3D settings.
The results discussed above require that hypothesis 4 is rejected. There were significant differences found between the 2D and 3D settings with frames. However, the results are very accurate and the differences in time between the two settings may be mainly attributed to the navigation in the 3D space.
Influencing Factors
[image:10.595.128.461.78.381.2]We also consider the influences of recorded characteristics that may affect performance. These include the effects of participants’ general spatial ability on task performance and the task completion times, the position of the bars in the landscape, the vertical non-alignment of the bars in the 2D settings and the different combinations of bars.
Spatial abilities of the participants:The Santa Barbara Sense of Direction test allowed us to confirm that our participants were characteristic of the ‘typical users’ in whom we have interest – assuming that this is a suitable measure of spatial abilities. However, our analysis does not allow us to establish this factor as an influence on task performance. Some consistency in the performance and response of individual users is shown as the task performance in one 3D setting is highly correlated with the task performance in the other 3D setting. Further research may use more discriminating tests within our target user-group.
Task completion times: There is no significant evidence of a correlation between task performance and task com-pletion time in either of the settings. Participants taking more time to complete a task may have more difficulties with the task or be participating in additional activity.
Vertical non-alignment of bars in the 2D settings: There is no evidence of a correlation between accuracy of task performance per bar combination in the 2D settings and the absolute vertical non-alignment of the bars. However, the standard deviation of the differences exhibits a weak correlation with non-alignment suggesting that the results vary more when bars are not aligned along a common baseline. This is to some degree consistent with the findings of Cleveland and McGill (1984) who note that judging positions along a common scale is easier than judging positions along non-aligned scales when considering 2D graphics.
Position of bars in the 3D landscape:The position of the bars in the landscape (3D distance between bars) does not seem to influence the accuracy of task performance. But as is the case for non-alignment in the 2D setting, the 3D distance between the bars shows a weak positive correlation with the standard deviation of the differences. Whilst this is not a significant finding it suggests that greater distances between two bars may result in variability in the judgment of results. There may be an effect relating to the geography of data analysis in virtual worlds whereby comparisons between closer symbols are more efficient than comparisons between distant symbols. Further research may need to consider the effects of this issue when more than two bars are under consideration concurrently.
Bar combinations: Certain bar combinations, especially combinations of small bars with minor differences in height seem more difficult to compare (in all four settings) than others. However, this is only a trend as the data set sizes per bar combination are small (8(n>18). In practice, such knowledge may help to appropriately scale the data to improve the readability and comparison of data displays where bars are small or at least support the need to provide interactive tools that aid comparison between bar values.
Concluding Comments
These results provide some insights into the effectiveness of using abstract symbols to represent numeric data values in 3D desktop virtual environments or geo-browsers and
associated efficiencies and lead to a number of inferences. It is suggested that the key difference between the 3D and 2D settings is in task completion time (efficiency) rather than effectiveness. However, it is difficult to isolate dimension-ality, interactivity or information content when making this conclusion. It may be that tasks that justify 3D desktop virtual environments involve the assimilation and visual synthesis of additional (spatial) information that cannot be represented effectively in 2D. Such tasks may be more complex and justify longer completion times. Further studies will focus on measuring possible additional benefits when judging and relating abstract symbols to the land-scape by navigation and interaction which may make the additional efforts in terms of time worthwhile. Our results indicate that fundamental estimation and comparison tasks – the foundation of data graphics – are not affected by a combination of factors such as monocular depth cues or interactivity which contribute to 3D desktop virtual environments.
Using bars with frames appears to help users in 3D desktop virtual environments. They are more confident in their judgments and also faster in doing so in the virtual environment. Even though some participants state that it is more complex, the completion times show that frames seem to reduce the need to navigate or explore the virtual environment. This is somewhat backed-up by a single statement noting that more navigation, especially zooming in, was needed for the virtual environment setting without frames and this had an effect on task completion times. Frames are one of a number of additional graphical and or numeric devices that might improve the efficiency of task completion. Developers using 3D desktop virtual environ-ments to combine landscape information with statistical graphics may want to consider using some kind of reference grid, such as the frames in this study, for their displays. We will test in subsequent evaluations if this recommendation holds true for more dense displays and more complex analysis tasks.
BIOGRAPHICAL NOTES
Susanne Bleisch is a PhD candidate at the giCentre, City University London and a scientific collabora-tor for the e-learning projects CartouCHe (3D cartography), GITTA (Geographic Information Technology and Training Alliance) and eLML
(eLesson Markup
Language) at the Institute of Geomatics Engineering of the University of
Applied Sciences
Northwestern Switzerland – FHNW. She has studied Geomatics at FHNW in Muttenz, Switzerland and obtained her Masters degree in Geographic Information from City University in London. Her research interests are in 3D geovisualisation, cartography and geoinformatics and e-learning.
ACKNOWLEDGEMENTS
The authors would like to thank Prof. Dr. Beat Fischer from the University of Applied Sciences Northwestern Switzerland FHNW in Muttenz for helpful discussion and comments related to the statistical analysis of the data. We are grateful to the test participants for their willingness to participate and their efforts in judging the different displays. The authors also thank the three anonymous reviewers of this paper for their comments and suggestions which have been used to improve the work.
REFERENCES
Akenine-Mo¨ller, T. and E. Haines (2002). Real-Time Rendering. Natick, A K Peters.
Baird, J. C. and E. Noma (1978). Fundamentals of Scaling and Psychophysics. New York, Wiley.
Boots, M., Percivall, G., Reed, C. and Davidson, J. (2006). OGC Sensor Web Enablement: Overview and High Level Architecture. OGC Whitepaper.
Butler, D. (2006). ‘The web-wide world.’Nature439(16): 776–778. Cleveland, W. S. and R. McGill (1984). ‘Graphical Perception: Theory, Experimentation, and Application to the Development of Graphical Methods.’Journal of the American Statistical Association 79 (387): 531–554.
Cleveland, W. S. (1994).The Elements of Graphing Data. New Jersey, Hobart Press.
Elmes, D. G., Kantowitz, B. H., and Roediger, H. L. (2006).
Research Methods in Psychology. Belmont, Thomson Wadsworth.
Fuhrmann, S., Ahonen-Rainio, P., Edsall, R. M., Fabrikant, S. I., Koua, E. L., Tobon, C., Ware, C. and Wilson, S. (2005). Making Useful and Useable Geovisualisation: Design and Evaluation Issues.
Exploring Geovisualisation. J. Dykes, A. M. MacEachren and M.-J. Kraak. Amsterdam, Elsevier, pp. 553–566.
Gahegan, M., Wachowicz, M., Harrower, M. and Rhyne, T.-M., (2001). ‘The Integration of Geographic Visualisation with Knowledge Discovery in Databases and Geocomputation.’
Cartography and Geographic Information Science 28(1): 29– 44.
Gilmartin, P. P. (1981). ‘The Interface of Cognitive and Psychophysical Research in Cartography.’ Cartographica 18(3): 9–20.
Google. (2008). Google Earth – Explore, Search and Discover. Retrieved 12 Jan, 2008, from http://earth.google.com.
Gross, N. (1999). The earth will don an electronic skin.
BusinessWeek.
Hegarty, M., A. E. Richardsonet al.(2002). ‘Development of a self-report measure of environmental spatial ability.’Intelligence30: 425–447.
Jobst, M. and Germanchis, T., (2007). ‘The Employment of 3D in Cartography – An Overview.’ Multimedia Cartography. W. Cartwright, M. P. Peterson and G. Gartner. Berlin, Springer, pp. 217–228.
Kirschenbauer, S. (2005). ‘Applying "True 3D" Techniques to Geovisualisation: An Empirical Study.’ Exploring Geovisualisation. J. Dykes, A. M. MacEachren and M.-J. Kraak. Amsterdam, Elsevier, pp. 363–387.
Kraak, M.-J. (1988). Computer-assisted Cartographical Three-dimensional Imaging Techniques. Delft, Delft University Press. Lehning, M. (2008). Wannengrat field test site. Retrieved 14 March
2008, from http://www.wsl.ch/forschung/forschungsunits/ schnee/Schneedecke_und_Mikrometeorologie/Wind-flow-trans-portation-and-surface-interactions/Wannengrat/
index_EN?redir51&
MacEachren, A. M., Edsall, R., Haug, D., Baxter, R., Otto, G., Masters, R., Fuhrmann, S. and Quian, L. (1999). Virtual environments for geographic visualisation: potential and challenges. Proceedings of the ACM Workshop on New Paradigms in Information Visualisation and Manipuation. Kansas City, pp. 35– 40.
Mackinly, J. (1986). ‘Automating the design of graphical presentations of relational information.’ACM Transactions on Graphics5(2): 110–141.
Morville, P. (2005).Ambient Findability. Sebastopol, CA, O’Reilly. Nebiker, S., Christen, M., Eugster, H., Flu¨ckiger, K. and Stierli, C. (2007). Integrating mobile geo sensors into collaborative virtual globes – design and implementation issues. Proceedings of the 5th International Symposium on Mobile Mapping Technology MMT’07, Padua.
NASA. (2008). NASA World Wind. Retrieved 12 Jan, 2008, from http://worldwind.arc.nasa.gov.
Piatti, B. and L. Hurni (2007). Towards a European Atlas of Literature: Developing Theories, Methods, and Tools in the Field of ‘Literary Geography’. XXIII International Cartographic Conference ICC, Moscow.
Polys, N. F. and Bowman, D. A., (2004). ‘Design and display of enhancing information in desktop information-rich virtual environments: challenges and techniques.’ Virtual Reality 8(1): 41–54.
Rock, I. (1998).Wahrnehmung: Vom visuellen Reiz zum Sehen und Erkennen. Heidelberg, Spektrum Akademischer Verlag. Slocum, T. A.; Blok, C.; Jiang, B.; Koussoulakou, A.; Montello, D. R.;
Fuhrmann, S. and Hedley, N. R.. (2001). ‘Cognitive and Usability Issues in Geovisualisation.’ Cartography and Geographic Information Science28(1): 61–75.
Thomas, J. J. and Cook, K. A., (2005). Illuminating the Path: The Research and Development Agenda for Visual Analytics, IEEE Computer Society.
Tufte, E. R. (2001). The Visual Display of Quantitative Information. Cheshire, Graphics Press.
Ware, C. (2004). Information Visualisation – Perception for Design. San Francisco, Elsevier.