Open Access
Research article
The effect on behavior and bone mineral density of individualized
bone mineral density feedback and educational interventions in
premenopausal women: a randomized controlled trial
[NCT00273260]
Tania Winzenberg*
1, Brian Oldenburg
2, Sue Frendin
3, Laura De Wit
1,
Malcolm Riley
4and Graeme Jones
1Address: 1Menzies Research Institute, University of Tasmania, Hobart, Australia, 2School of Public Health, Queensland University of Technology,
Brisbane, Australia, 3Department of Health and Human Services, Government of Tasmania, Hobart, Australia and 4Nutrition and Dietetic Unit,
Monash University, Melbourne, Australia
Email: Tania Winzenberg* - [email protected]; Brian Oldenburg - [email protected]; Sue Frendin - [email protected]; Laura De Wit - [email protected];
Malcolm Riley - [email protected]; Graeme Jones - [email protected] * Corresponding author
Abstract
Background: Limited information is available on ways to influence osteoporosis risk in premenopausal women. This study tested four hypotheses regarding the effects of individualized bone density (BMD) feedback and different educational interventions on osteoporosis preventive behavior and BMD in pre-menopausal women, namely: that women are more likely to change calcium intake and physical activity if their BMD is low; that group education will be more efficacious at changing behavior than an information leaflet; that BMD feedback and group education have independent effects on behavior and BMD; and, that women who improve their physical activity or calcium intake will have a change in bone mass over 2 years that is better than those who do not alter their behavior.
Methods: We performed a 2-year randomized controlled trial of BMD feedback according to T-score and either an osteoporosis information leaflet or small group education in a population-based random sample of 470 healthy women aged 25–44 years (response rate 64%). Main outcome measures were dietary calcium intake, calcium supplement use, smoking behavior, physical activity, endurance fitness, lower limb strength and BMD. We used paired t-tests, one-way ANOVA and linear regression techniques for data analysis.
Results: Women who had feedback of low BMD had a greater increase in femoral neck BMD than those with normal BMD (1.6% p.a. vs. 0.7% p.a., p = 0.0001), but there was no difference in lumbar spine BMD change between these groups (0.1% p.a. vs. 0.08% p.a., p = 0.9). Both educational interventions had similar increases in femoral neck BMD (Leaflet = +1.0% p.a., Osteoporosis self-management course = + 1.3% p.a., p = 0.4). Femoral neck BMD change was only significantly associated with starting calcium supplements (1.3 % p.a, 95%CI +0.49, +2.17) and persistent self-reported change in physical activity levels (0.7% p.a., 95%CI +0.22, +1.22).
Conclusion: Individualized BMD feedback combined with a minimal educational intervention is effective at increasing hip but not spine bone density in premenopausal women. The changes in behavior through which this was mediated are potentially important in the prevention of other diseases, thus measuring BMD at a young age may have substantial public health benefits, particularly if these changes are sustained.
Published: 23 January 2006
BMC Public Health 2006, 6:12 doi:10.1186/1471-2458-6-12
Received: 15 July 2005 Accepted: 23 January 2006
This article is available from: http://www.biomedcentral.com/1471-2458/6/12
© 2006 Winzenberg et al; licensee BioMed Central Ltd.
Background
Osteoporosis is a major and growing public health prob-lem, particularly in women[1], with an estimated 10 mil-lion people already having osteoporosis in the US and 18 million more having low bone mass[2]. In the United States, the direct financial costs alone of osteoporosis are estimated at $10 to $15 billion annually. Low bone min-eral density (BMD) is a major risk factor for osteoporotic fracture[3]. BMD in later life is a function of peak bone mass and the rate of subsequent bone loss[4]. Although bone mineral density is lost most rapidly post-menopau-sally, it has also been shown that premenopausal women have significant age-related BMD loss [5-7] and that pre-menopausal bone mass contributes to fracture risk in later life[8].
Modifiable risk factors for low BMD include low calcium intake, smoking and low levels of physical activity[2]. Limited information is available currently on how to influence these risk factors in premenopausal women. Three uncontrolled studies have suggested that BMD screening with feedback of results combined with an information leaflet increases self-reported osteoporosis preventive behavior change at twelve months, in women aged 30 to 80 years[9] and in exclusively premenopausal women[10,11]. In particular, greater changes were reported in women with low BMD. However, there have been no longer-term follow-up studies or studies of the effect, if any, of these behavior changes on BMD. Simi-larly, studies of educational interventions in pre-meno-pausal women that have not included a bone density feedback component [12-15] have been short-term and have not studied effects of behavior change on BMD.
The aim of this study was to determine the effects of indi-vidualized bone mineral density (BMD) feedback and two different educational interventions on osteoporosis pre-ventive behavior and 2-year change in BMD in pre-meno-pausal women. Specifically, we aimed to test the following hypotheses:
1. Women are more likely to change calcium intake and physical activity if their BMD is low.
2. Group education (in the form of the Osteoporosis Pre-vention and Self Management course) will be more effica-cious at changing these lifestyle behaviours than an information leaflet alone.
3. Bone density feedback and educational intervention have independent effects on behavior and BMD change.
4. Women who improve their physical activity or dietary calcium intake will have a change in bone mass over 2 years that is 0.34–0.54% per annum better (depending on
site and lifestyle factor) than those who do not alter their behaviour.
Methods
The study was performed in Southern Tasmania in 2000– 2003. The population of the region is predominantly Cau-casian and as at June 1999 numbered 194 389 with 28 839 women aged between 25 and 44 years of age[16]. Subjects were selected at random with equal probabilities of selection using the Tasmanian Electoral Roll as the sam-pling frame. Voting is compulsory in Australia and this register of electors provides a comprehensive population listing that is estimated to be 95% complete for persons of these ages [17]. Subjects were excluded if they had previ-ously had measurement of bone densitometry, had thy-roid disease, renal failure, malignancy or rheumatoid arthritis, had a history of hysterectomy, were on hormone replacement therapy or were pregnant or planning preg-nancy within 2 years of study entry, or were lactating. A total of 146 subjects were excluded on these grounds (Fig-ure 1). Ethics approval was obtained from the Royal Hobart Hospital Ethics Committee and all subjects gave written informed consent.
Interventions
Details of the interventions used have previously been published[18], but a brief description is given below.
Bone density feedback
Education
Subjects were randomized, before their BMD result was known, to receive one of two interventions: an informa-tion leaflet produced by Osteoporosis Australia "Under-standing Osteoporosis"; or the Osteoporosis Prevention and Self-management Course (OPSMC). Prior to
recruit-ment, a random number drawn from a (0,1) uniform dis-tribution (using the random number generator in SAS) was allocated to a participant number (which were con-secutive integer values starting at 1). The random numbers were rounded to 0 if less than 0.5, or 1 if greater than or equal to 0.5. The 0 or 1 produced the assignment to one Flow of subjects through the trial
Figure 1
Flow of subjects through the trial.
947 women assessed for eligibility
251 BMD and Assigned to leaflet
219 BMD and Assigned to OPSMC
At Year 1:
119 assessed 1 discontinued
At Year 1:
127 assessed 1 discontinued
At Year 1:
111 assessed 0 discontinued
At Year 1:
106 assessed 2 discontinued 120 Low T-score and
received leaflet 1 subject declined to continue
128 Normal T-score and received leaflet
2 subjects declined to continue
111 Low T-score and received OPSMC 0 subjects declined to continue
108 Normal T-score and received OPSMC 0 subjects declined to continue
At Year 2:
106 assessed 12 discontinued
At Year 2:
113 assessed 14 discontinued
At Year 2:
104 assessed 8 discontinued
At Year 2:
92 assessed 14 discontinued 477 Excluded:
146 Did not meet inclusion criteria 269 Refused to participate 62 Uncontactable
470 randomized
2-year analysis*: 106 included 14 excluded
2-year analysis: 104 included 8 excluded 2-year analysis:
113 included 17 excluded
2-year analysis:
92 included 16 excluded
of the two intervention groups. Participants were allo-cated a participant number on recruitment. While there was no allocation concealment, allocations were imple-mented sequentially for each participant number with no variations to the order in which the numbers were assigned.
The OPSMC is a chronic disease self-management course based on the work of Lorig[22,23] developed by the Arthritis Foundation of Victoria and utilized by Oste-oporosis Australia. This small group patient education program aims to increase knowledge, improve confidence and awareness and self-management of osteoporosis pre-vention with an emphasis on promoting appropriate life-style change. There were a maximum of 16 subjects per group and sessions were held at regular intervals for 2 hours per week for four weeks. Participants randomized to the leaflet intervention received the same osteoporosis information leaflet as in our previous study [11]. The leaf-let provides a description of osteoporosis, an overview of the role of lifestyle factors such as diet, exercise and smok-ing and outlines ideal levels of calcium intake and exer-cise. It was considered unethical to provide no educational information to subjects so the leaflet was given as minimal information. Participants randomized to the leaflet intervention received their BMD feedback with the leaflet and participants randomized to the OPSMC received their BMD feedback at the first session of the course.
Primary outcome measures were bone mineral density at the femoral neck and lumbar spine, and the physical activ-ity and calcium intake measures described below.
Usual calcium intake was assessed at yearly intervals by a short food frequency questionnaire (FFQ) designed spe-cifically to measure calcium intake, with a reference period of the last 12 months. The FFQ has been validated in Caucasian Australian women against 4 day weighed dietary records. The correlation between methods for esti-mated calcium intake was high (r = 0.79, p = 0.001)[24]. Calcium content of food categories was assigned using Australian food composition tables[25], and usual cal-cium intake estimated in mg/day. Information on whether respondents were taking calcium supplements was also obtained by questionnaire. Respondents were classified as taking calcium supplements if they reported taking a supplement containing calcium alone or as a main ingredient, and at a frequency of not less than 4 times per week.
Physical activity was assessed in three ways. Energy expenditure and sports participation was assessed annu-ally by a questionnaire validated in US adolescents[26] which has been modified for Tasmanian conditions and
used previously in women in this age group where it was associated with bone mass at the femoral neck[27]. In this questionnaire, strenuous physical activity levels were assessed by how many days in the last 14 the subjects reported performing at least 20 minutes of strenuous exer-cise and light exerexer-cise, measured in five categories (1 = 0 days, 2 = 1–2 days, 3 = 3–5 days, 4 = 6–8 days, 5 = 9 or more days). Muscle strength and endurance fitness was assessed at baseline and two years. Muscle strength was assessed by dynamometry in the lower limb. The intrac-lass correlation coefficient for lower limb strength was 0.88 (95% CI 0.84, 0.92) at baseline and 0.82 (95% CI 0.73, 0.92) at 2 years. Endurance fitness was assessed by bicycle ergometer where physical work capacity at 170 beats per minute was estimated by progressively increas-ing sub maximal workloads[28]. This measure correlates well with treadmill assessment of VO2 max[29].
Other factors measured at baseline and 2 years were: height by stadiometer (The Leicester height measure, Invicta Plastics Ltd, Oadby, England) and weight by a sin-gle set of calibrated scales (Heine, Dover NH USA). Body mass index was calculated (kg/m2). Questionnaire assess-ment was made of smoking history (current/former/ never, cigarettes per day, age at uptake, age at ceasing), breastfeeding history (ever breastfed, time since last breastfeeding), number of children, family history of oste-oporosis and/or fracture, as well as fracture history in the subject, education level (4 point scale: less than grade 10, up to grade 10, completed grade12, tertiary), employment status of main financial provider in the household (employed or unemployed), hours of employment of the respondent (0, less than or equal to 20 or >20 hours per week) and marital status.
At one and two years, subjects were followed up by mail, using the questionnaires described above, and by asking a series of yes/no questions to assess self-reported change in smoking, dietary calcium intake, calcium supplement use and physical activity.
As the subjects were aware of both their BMD status and of the intervention they received, blinding of assessors was not attempted.
Statistical analysis
All statistical analyses were based on the a priori hypoth-eses above. We performed statistical power calculations which indicated that we had power of 0.8 (α = 0.05 (two-tailed)) to detect clinically meaningful changes in calcium intake and physical activity, and differences in BMD of 1% or better.
study sample, and one-way ANOVA to compare BMD within the four intervention groups. Simple linear regres-sion and one-way ANOVA were used for continuous and categorical measures respectively to examine the relation-ships between BMD change and intervention groupings, and changes in osteoporosis preventive behaviors. Multi-ple regression modeling, including potential confound-ers, was then used to examine the relationships between T-score group and educational intervention and BMD change as well as changes in behavior and BMD change, at both the femoral neck and lumbar spine. A number of behaviors were measured in different ways, for example changes in physical activity, smoking, calcium intake and calcium supplement use were measured by detailed ques-tionnaires, as well as by simple self-report (change in behavior – yes/no). In our modeling, we assessed associa-tions between changes in BMD and each method of meas-uring a behavior separately. In multivariate analysis, for behaviors measured in more than one way, we reported the effects using the using most objective measure e.g. FFQ assessment of calcium supplement use and dietary calcium intake rather than simple self-report of changes in calcium supplement use and dietary calcium. For simple self-reported physical activity change and smoking change, which were measured at both 1 and 2 years, we reported on effects of persistent improvement i.e. improved behavior reported at both 1 and 2 years.
The analysis was performed in 3 ways
(1) by available data analysis, which included all subjects who reached 2 years of follow-up;
(2) by intention to treat, in which all randomised individ-uals were included in the analysis. We imputed missing data at 2 years using the method of last observation
car-ried forward [30] for measured variables, and imputed no change for self-reported behavioral change variables; and
(3) by per protocol analysis defined in two ways: firstly, by whether subjects attended at least one of four educa-tional session of the OPSMC, and secondly, by whether they attended all four OPSMC sessions.
A sensitivity analysis was also performed omitting sub-jects with a baseline T-score < -2.5, which may lead to pharmacological treatment for osteoporosis in our loca-tion. No adjustment was performed for multiple compar-isons.
All analyses were performed in Stata version 7 (Stata Cor-poration, Texas, USA). Statistical significance was set as p < 0.05 (two-tailed).
Results
A total of 470 women (response rate of 64%) were recruited. Of these, 415 (88%) reached final follow-up. There were no statistically significant differences in base-line demographics and proportions of participants receiv-ing the OPSMC and low T-score feedback between those completing the study and those withdrawing (data not shown).
[image:5.612.53.557.100.264.2]Table 1 shows the baseline characteristics of women in each intervention group. As expected, women in the low T-score categories, were shorter and lighter than those in the high T-score category. There was a trend (p = 0.05) for a greater proportion of women in the low T-score groups to be taking calcium supplements, but the proportion in both groups was small. The groups were otherwise simi-lar. Only three subjects had a femoral neck or lumbar spine T-score of less than -2.5.
Table 1: Comparison of baseline characteristics of each intervention group.
T-score ⬉ 0 and leaflet (n = 128)a
T-score ⬉ 0 and OPSMC (n = 108)
T-score<0 and leaflet (n = 119)
T-score<0 and OPSMC (n = 112)
Age (years) 37.9 (5.3) 37.4 (5.8) 38.4 (5.0) 37.4 (5.3)
Height (cm) 164.2 (6.4) 164.2 (5.6) 162.7 (6.5) 161.5 (6.5)
Weight (kg) 73.9 (15.2) 75.3 (13.6) 65.4 (10.0) 63.5 (10.8)
BMI (kg/m2) 27.5 (5.7) 27.9 (4.4) 24.8 (4.1) 24.4 (4.0)
Femoral Neck BMD (g/cm2) 1.01 (0.09) 1.03 (0.11) 0.83 (0.08) 0.84 (0.12)
Lumbar Spine BMD (g/cm2) 1.16 (0.09) 1.18 (0.10) 0.99 (0.07) 0.99 (0.08)
Calcium Intake (mg/day) 805 (429) 795 (406) 753 (368) 803 (389)
Calcium Supplement Use, % 1 0 3 4
Work Capacity (W)a 2.3 (0.7) 2.3 (0.7) 2.3 (0.7) 2.3 (0.6)
Average Leg Strength (kg)b 1.3 (0.4) 1.3 (0.4) 1.4 (0.4) 1.4 (0.4)
Median Strenuous Activity Level 3 3 3 3
Currently smoking, % 20 16 18 13
Across the whole study sample, from baseline to 2 years there was a 1.1% p.a. (95%CI +0.9, +1.4) increase in fem-oral neck BMD from baseline to 2 years and no change in lumbar spine BMD (+0.09 %p.a., 95%CI -0.06, +0.20).
Table Two compares BMD changes between low and high T-score groups and between the leaflet and OPSMC edu-cational intervention groups. Subjects in the low T-score group had a greater percentage rate of change in femoral neck BMD as well as higher absolute change (Figure 2). By comparison, there was no difference in the rate of change in femoral neck BMD between the leaflet and OPSMC
[image:6.612.52.561.100.205.2]groups. There were no differences in rates of lumbar spine BMD change between either T-score or education groups.
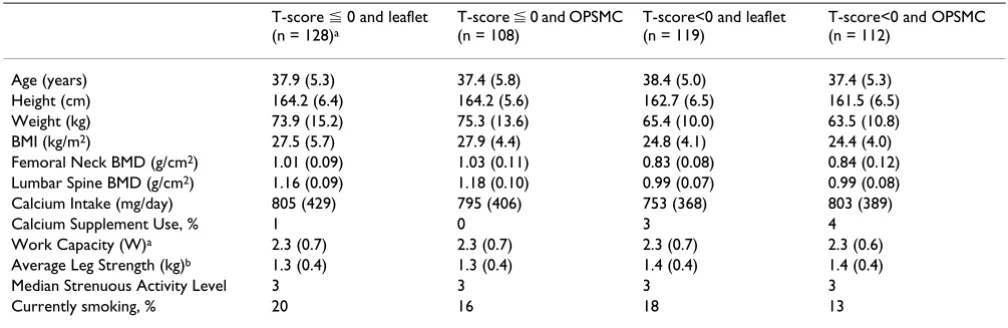
Figure 3 shows differences in osteoporosis preventive behaviors at two years by T-score group and by educa-tional intervention. A greater proportion of subjects in the low T-score group commenced taking calcium supple-ments (as measured by FFQ) and reported changes in physical activity than in the high T-score group, but there were no differences between education groups. Levels of dietary calcium intake and smoking cessation were similar across both T-score and educational groups. Figure 4 dem-Table 2: Effect of bone density feedback and group education on BMD change.
Univariate β (95% CI) Multivariate βa,b (95% CI) Multivariate βa,c (95% CI) Multivariate βa,d (95% CI)
Femoral Neck BMD change (% p.a.)
T-score (<0 vs >0) +0.93 (+0.46,+1.4) +0.86 (+0.39,+1.34) +0.85 (+0.38,+1.30) +0.86 (+0.39,+1.34)
OPSMC v leaflet +0.22 (-0.26,+0.70) +0.14 (-0.32,+0.62) +0.38 (-0.20,+0.96) +0.19 (-0.29,+0.68)
Lumbar Spine BMD change (% p.a.)
T-score (<0 vs >0) +0.02 (-0.29,+0.32) -0.01 (-0.32,+0.30) -0.02 (-0.32,+0.30) -0.01 (-0.32,+0.30) OPSMC v leaflet +0.10 (-0.21,+0.40) +0.09 (-0.21,+0.40) +0.21 (-0.16,+0.59) +0.02 (-0.30,+0.34)
aadjusted for other items in column, age, and difference in weight and height between baseline and 2 years. b available data analysis
cper protocol analysis defined as subjects attending all OPSMC sessions dper protocol analysis defined as subjects attending at least one OPSMC session
Change in BMD by T-score group and educational intervention over 2 years Figure 2
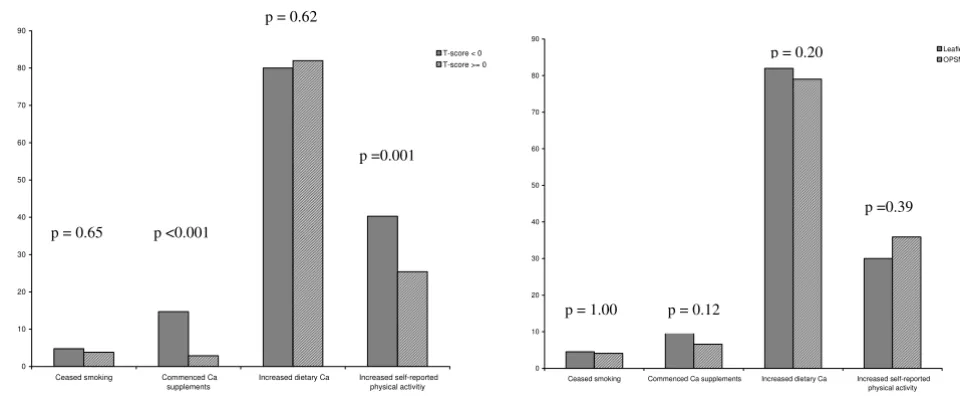
[image:6.612.66.546.453.674.2]onstrates that T-score group, not educational intervention is the main determinant of commencing use of calcium supplements. There were no significant differences in changes in strenuous activity levels, average leg strength change, and change in work capacity between T-score groups or between educational groups (data not shown).
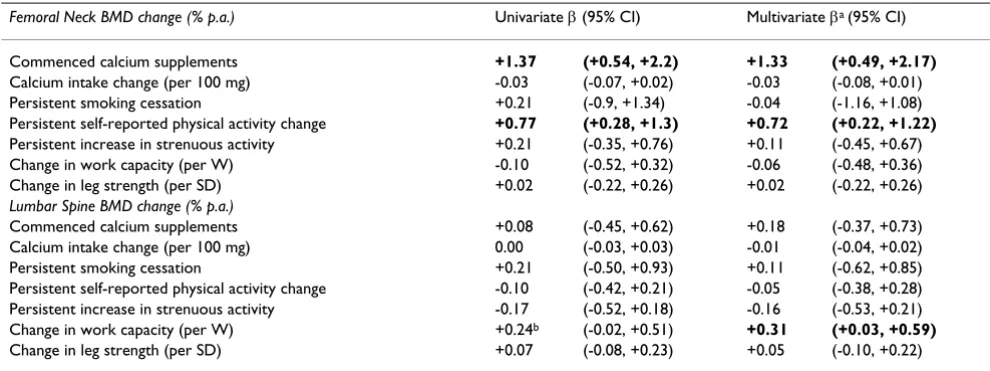
Table 3 documents the associations between changes in femoral neck and lumbar spine BMD and changes in oste-oporosis preventive behaviors. In univariate analysis there were positive associations between change in femoral neck BMD and calcium supplement use (whether meas-ured by FFQ or self-reported behavior change) and physi-cal activity (by self-report but not questionnaire assessment). Figure 5 shows the absolute differences in femoral neck BMD in those who did and did not change calcium supplement use and self-reported physical activ-ity. In multivariate analysis these associations persisted. At the lumbar spine, there were no significant associations in univariate analysis. However, a positive association between change in work capacity and lumbar spine BMD change was significant in multivariate analysis.
All analyses were repeated after imputation of data for participants lost to follow-up (i.e. an intention to treat analysis) and the associations reported above were not altered (data not shown). The associations were unchanged also when analysis was repeated for actual OPSMC participation rather than available data analysis
(Table 2) or if subjects with a baseline T-score of less than or equal to -2.5 were omitted (data not shown).
Discussion
This study demonstrates that bone density feedback with minimal patient education in premenopausal women is effective at increasing hip but not lumbar spine bone den-sity and that this effect appears to be mediated by changes in physical activity and calcium supplement usage. How-ever, group education had no additional effect over a sim-ple information leaflet.
Women receiving feedback of a low T-score result were more likely to commence calcium supplement use and to report changes in physical activity, as well as to have greater increases in femoral neck BMD, compared to women with a high T-score.
[image:7.612.66.546.86.285.2]Notably, the magnitude of these BMD changes, which occurred outside the setting of randomized controlled tri-als of interventions of calcium supplements and exercise, is similar to that obtained within such trials. Specifically, the magnitude of the effect on femoral neck BMD of self-reported physical activity change in our study was +0.7% p.a. and for calcium supplement use was +1.3 % p.a., which compared to treatment effects in premenopausal women reported for randomized controlled trials of exer-cise interventions of 0.9 % p.a[31] and for calcium sup-plement use of 1% p.a. respectively[32]. The ability to achieve these changes with relatively simple interventions Effect of intervention on change in osteoporosis preventive behaviors (a) by T-score (b) by educational intervention
Figure 3
Effect of intervention on change in osteoporosis preventive behaviors (a) by T-score(b) by educational intervention. P-values are for comparison of proportion of subjects changing each behavior between T-score groups and between educational inter-vention groups at two years. Significant differences in behavior change between groups were only observed for calcium supple-ment use and self-reported physical activity between T-score groups. The type of educational intervention did not affect the proportion of subjects changing osteoporosis preventive behaviors.
0 10 20 30 40 50 60 70 80 90
Ceased smoking Commenced Ca supplements
Increased dietary Ca Increased self-reported physical activitiy
T-score < 0 T-score >= 0
0 10 20 30 40 50 60 70 80 90
Ceased smoking Commenced Ca supplements Increased dietary Ca Increased self-reported physical activity
Leaflet OPSMC
p = 0.65 p <0.001
p =0.001
p = 1.00 p = 0.12
p = 0.20
p =0.39 p = 0.62
% s
ubjec
ts
c
h
ang
has major potential public health benefits for osteoporo-sis prevention and fracture reduction in later life. For example, in drug trials a change in BMD of 5% with bisphosphonates leads to a 50% decrease in fracture risk[33] while regular walking is associated with a 50% decrease in hip fracture risk[34]. The resulting behavior changes could also be potentially beneficial for preven-tion of other chronic diseases whose incidence could be reduced by increased calcium intake and/or increased physical activity, such as cardiovascular disease, obesity and diabetes mellitus.
Interestingly, the results suggest that an intervention as intensive as the OPSMC is no more effective at increasing BMD than a relatively simple and inexpensive educational intervention such as an information leaflet in this age group. The OPSMC was modeled upon a chronic disease self-management course for arthritis, which has been shown to be modestly effective in symptomatic popula-tions at reducing health care utilization and improving health status [22,23]. The lack of increased effect by the addition of the OPSMC in this group of healthy, asympto-matic women is possibly due to differences in motivation
between women undertaking a chronic disease self-man-agement course who actually have a symptomatic condi-tion, compared with a course aimed at preventing a chronic disease in healthy women. Further research is required to address the OPSMC's role in the management of other populations of women such as women with exist-ing osteoporosis and/or fracture.
[image:8.612.66.554.83.395.2]The findings that all intervention groups showed increased femoral neck BMD and that there was essen-tially no change in lumbar spine BMD are noteworthy given observational data for this age group. While there is no natural history data available in our geographic loca-tion, longitudinal studies examining the natural history of BMD loss in other Caucasian populations have been con-sistent with there being onset of bone loss in the pre-men-opausal period[5,6] with one study reporting annual loss of BMD at the femoral neck of about 0.3 % of baseline BMD p.a., and bone loss potentially beginning as early as age 24[7]. The onset of lumbar spine bone loss was esti-mated at 38–39 years, with the maximum annual loss being 0.5% p.a. If premenopausal bone loss can be reduced, or potentially reversed, then this has important Calcium supplement use by intervention group
Figure 4
Calcium supplement use by intervention group. This shows changes in calcium supplement use by subjects in each of the four intervention groups over the study period. Only those intervention groups that included feedback of low T-score had signifi-cant increases in calcium supplement use.
0 5 10 15 20 25
Baseline 1 Year 2 Years
Low T-score, leaflet Low T-score, OPSMC High T-score, leaflet High T-score, OPSMC Use of Calcium
Supplements (% Subjects)
implications for the long-term prevention of osteoporosis and fracture. The ability to achieve this with a relatively simple intervention i.e. bone mineral density feedback with an information leaflet, has major potential public health benefits for osteoporosis prevention. However, confirmation of long-term benefits and assessment of the cost effectiveness of the intervention needs to occur before any recommendation for implementation at a population level is made.
The associations between changes in BMD and physical activity varied by site of BMD measurement, and by the physical activity measure used. Simple self-report of phys-ical activity change was positively associated with change in femoral neck BMD, but not lumbar spine BMD. How-ever, there was no association between changes in other physical activity measures and femoral neck BMD. Change in endurance fitness was associated with rate of change of lumbar spine but not femoral neck BMD. Changes in femoral neck BMD in exercise interventions without accompanying increases in muscle strength have been observed previously in premenopausal women[35]. Different types of exercise can also cause different BMD responses in the lumbar spine and femoral neck BMD[36,37]. Variation in the types of activity captured by simple self-report and the site dependency of the BMD effects of different activities may account for the differ-ences in associations seen at the lumbar spine compared to femoral neck. Alternatively, the femoral neck may be more susceptible to lifestyle interventions in premeno-pausal women than the lumbar spine. The difficulty of capturing all dimensions of physical activity by question-naire is well-known[38,39], particularly non-leisure activ-ities in women[40]. Simple self-report may have captured changes in incidental activity, not detected by other meas-ures, which may have caused increases in femoral neck
BMD. The use of pedometry or accelerometry to assess physical activity changes in future research may assist with elucidating the reasons behind the discrepant results.
There were no significant associations between femoral neck or lumbar spine BMD and changes in smoking hab-its or dietary calcium intake. The number of women who persistently ceased smoking over the study period was small (n = 20), so the study had insufficient power to detect a meaningful difference in BMD. The difficulties of finding associations between calcium intake and BMD are well known[41]. The measurement error inherent in FFQ assessment of dietary intake, combined with variations between database derived nutrient contents food and actual content, and variations in the bioavailability of cal-cium in individuals, all make the identification of associ-ations outside of randomized controlled trials of calcium intake problematic. In contrast, ascertainment of calcium supplement usage may have less error, thus making it eas-ier to detect an association with calcium supplement use, as we found in this study.
[image:9.612.54.549.100.285.2]This study has a number of potential limitations. While the sample was randomly selected, selection bias is possi-ble due to the 64% response rate. The proportion of cur-rent smokers in the sample is lower than the Tasmanian prevalence of daily smoking in females aged 25–44 years in 1998 of 29% [16]. However, the wide spread of educa-tion levels and the unemployment rate approximates the overall population figures for these socioeconomic fac-tors. We have previously reported that calcium intake in this cohort is only slightly higher than that reported in a Southern Tasmanian sample of women who were selected using criteria that resulted in a cohort with high levels of smoking[27] suggesting that while there is a potential for selection bias towards a healthy cohort, the effects of this Table 3: Effect of behavior change on BMD change
Femoral Neck BMD change (% p.a.) Univariate β (95% CI) Multivariate βa (95% CI)
Commenced calcium supplements +1.37 (+0.54, +2.2) +1.33 (+0.49, +2.17)
Calcium intake change (per 100 mg) -0.03 (-0.07, +0.02) -0.03 (-0.08, +0.01)
Persistent smoking cessation +0.21 (-0.9, +1.34) -0.04 (-1.16, +1.08)
Persistent self-reported physical activity change +0.77 (+0.28, +1.3) +0.72 (+0.22, +1.22)
Persistent increase in strenuous activity +0.21 (-0.35, +0.76) +0.11 (-0.45, +0.67)
Change in work capacity (per W) -0.10 (-0.52, +0.32) -0.06 (-0.48, +0.36)
Change in leg strength (per SD) +0.02 (-0.22, +0.26) +0.02 (-0.22, +0.26)
Lumbar Spine BMD change (% p.a.)
Commenced calcium supplements +0.08 (-0.45, +0.62) +0.18 (-0.37, +0.73)
Calcium intake change (per 100 mg) 0.00 (-0.03, +0.03) -0.01 (-0.04, +0.02)
Persistent smoking cessation +0.21 (-0.50, +0.93) +0.11 (-0.62, +0.85)
Persistent self-reported physical activity change -0.10 (-0.42, +0.21) -0.05 (-0.38, +0.28) Persistent increase in strenuous activity -0.17 (-0.52, +0.18) -0.16 (-0.53, +0.21)
Change in work capacity (per W) +0.24b (-0.02, +0.51) +0.31 (+0.03, +0.59)
Change in leg strength (per SD) +0.07 (-0.08, +0.23) +0.05 (-0.10, +0.22)
are minor and that the results of this study are likely to be generalisable to healthy Caucasian women in the 25 to 44 year age range. Regression to the mean may account for some of the observed change in femoral neck BMD. It would not affect the associations between BMD feedback and behavior change, nor the associations between behav-ior change and BMD change. The extent of regression to the mean decreases as the correlation between pre and post intervention values increases. In this case, the corre-lation between baseline and follow-up femoral neck BMD was high (r = 0.87) making the likelihood of regression to the mean low[42,43]. Furthermore, if there were signifi-cant regression to the mean, we would expect to see a decrease in the high T-score group and a similar effect at the lumbar spine, which was not the case. The period of follow up for this study question is greater than that pre-viously reported at 2 years. However, the effect of the remodeling transient which results from increased cal-cium intake is greatest in the 6 to 18 months after increas-ing calcium intake[44] so it is not possible to determine whether the effect of calcium on BMD over the two years
of the study is indicative of long-term gain in steady-state bone mass or is due to the remodeling transient. Longer-term follow-up is needed to confirm any lasting positive effects on BMD from ongoing calcium supplement use. Even longer follow-up, in a much larger sample, would be needed to detect any positive effects on fracture incidence. We chose not to have an intervention group receiving BMD feedback alone without any other educational inter-vention. This decision was made because previous studies involving BMD feedback affecting behaviour had included leaflet information [9-11] and there was there-fore an argument that supplying a minimal amount of information would be the minimum intervention that would be acceptable both practically and ethically. While this limits the ability to state categorically which effects were due to the BMD feedback and which the leaflet, the variability between T-score subgroups suggests that BMD feedback was the more important component of the inter-vention. This is consistent with the results of the only ran-domized controlled trial of written information alone, which found no changes in behaviour from the interven-Mean absolute change in femoral neck BMD per year for women who did or did not increase calcium supplement use or phys-ical activity
Figure 5
Mean absolute change in femoral neck BMD per year for women who did or did not increase calcium supplement use or phys-ical activity. Data is presented as mean and upper 95th CI. P-values are for differences between women who changed and who
tion [14]. We performed additional analysis by intention to treat to assess the likelihood of loss to follow-up influ-encing these results, and found that the observed associa-tions remained and were not materially different in magnitude. Lastly, to ensure the effects seen were not con-founded by treatment for osteoporosis, we performed the analysis omitting the those subjects known to have been treated as well as those subjects whose T-score would have qualified them for treatment, i.e. less than -2.5 at any site. This did not substantially alter the study findings.
Conclusion
Individualized BMD feedback combined with a minimal educational intervention is effective at increasing hip but not spine bone density in premenopausal women. The changes in behavior through which this was mediated are potentially important in the prevention of other diseases, thus measuring bone density at a young age may have substantial public health benefits, particularly if these changes are sustained.
Competing interests
The author(s) declare that they have no competing inter-ests.
Authors' contributions
GJ was involved in study design, supervised fieldwork and was involved in drafting the manuscript. BO was involved in study design and was involved in drafting the manu-script. SF was involved in study design and the adaptation and implementation of the OPSMC for the project and in revising the manuscript. LD performed data collection and provided input into the drafting of the manuscript. MR was involved in study design, particularly of the nutri-tional assessment component, performed the analysis of the food frequency questionnaires and provided input into the drafting of the manuscript. TW performed data cleaning and analysis and was primarily responsible for drafting the manuscript. All authors read and approved the final manuscript.
Acknowledgements
This study was funded by the National Health and Medical Research Coun-cil. Dr Winzenberg receives funding to work on the study from the Gov-ernment of Tasmania, through the Dick Buttfield Memorial Fellowship. Thanks to Osteoporosis Australia for allowing use of the Osteoporosis Prevention and Self-management Course.
References
1. Jones G, Nguyen T, Sambrook PN, Kelly PJ, Gilbert C, Eisman JA:
Symptomatic fracture incidence in elderly men and women: the Dubbo Osteoporosis Epidemiology Study (DOES). Oste-oporos Int 1994, 4:277-282.
2. Osteoporosis Prevention, Diagnosis and Therapy. NIH Con-sensus Statement 2000 Mar 27-29 2000, 17:1-45.
3. Marshall D, Johnell O, Wedel H: Meta-analysis of how well meas-ures of bone mineral density predict occurrence of oste-oporotic fractures. BMJ 1996, 312:1254-1259.
4. Hansen MA, Overgaard K, Riis BJ, Christiansen C: Role of peak bone mass and bone loss in postmenopausal osteoporosis: 12 year study. BMJ 1991, 303:961-964.
5. Slemenda C, Longcope C, Peacock M, Hui S, Johnston CC: Sex ster-oids, bone mass, and bone loss. A prospective study of pre-, peri-, and postmenopausal women. J Clin Invest 1996, 97:14-21. 6. Sowers M, Crutchfield M, Bandekar R, Randolph JF, Shapiro B, Schork MA, Jannausch M: Bone mineral density and its change in pre-and perimenopausal white women: the Michigan Bone Health Study. J Bone Miner Res 1998, 13:1134-1140.
7. Bainbridge KE, Sowers MF, Crutchfield M, Lin X, Jannausch M, Harlow SD: Natural history of bone loss over 6 years among premen-opausal and early postmenpremen-opausal women. Am J Epidemiol
2002, 156:410-417.
8. Riis BJ, Hansen MA, Jensen AM, Overgaard K, Christiansen C: Low bone mass and fast rate of bone loss at menopause: equal risk factors for future fracture: a 15-year follow-up study. Bone 1996, 19:9-12.
9. Cook B, Noteloviz M, Rector C, Krischer J: An Osteoporosis Patient Education and Screening Program:Results and Implications. Patient Education and Counseling 1991, 17:135-145. 10. Jamal SA, Ridout R, Chase C, Fielding L, Rubin LA, Hawker GA: Bone
mineral density testing and osteoporosis education improve lifestyle behaviors in premenopausal women: a prospective study. J Bone Miner Res 1999, 14:2143-2149.
11. Jones G, Scott F: Low bone mass in premenopausal parous women: identification and the effect of an information and bone density feedback program. J Clin Densitom 1999, 2:109-115. 12. Brecher LS, Pomerantz SC, Snyder BA, Janora DM, Klotzbach-Shi-momura KM, Cavalieri TA: Osteoporosis prevention project: a model multidisciplinary educational intervention. J Am Osteo-path Assoc 2002, 102:327-335.
13. Blalock SJ, DeVellis BM, Patterson CC, Campbell MK, Orenstein DR, Dooley MA: Effects of an osteoporosis prevention program incorporating tailored educational materials. Am J Health Pro-mot 2002, 16:146-156.
14. Blalock SJ, Currey SS, DeVellis RF, DeVellis BM, Giorgino KB, Ander-son JJ, Dooley MA, Gold DT: Effects of educational materials concerning osteoporosis on women's knowledge, beliefs, and behavior. Am J Health Promot 2000, 14:161-169.
15. Sedlak CA, Doheny MO, Jones SL: Osteoporosis education pro-grams: changing knowledge and behaviors. Public Health Nurs
2000, 17:398-402.
16. Anonymous: Demography, Tasmania. [http://www.abs.gov.au/ Ausstats/abs%40.nsf/c1061106e0c3442fca2568b5007b861d/ 84f312dd37852078ca2568a900143bab!OpenDocument].
17. Walker V, Delaney S, White P: Integrity of the Electoral Roll 2001-2002: Audit Report No 42: 2001-2002. Canberra, Com-monwealth of Australia; 2002.
18. Winzenberg TM, Oldenburg B, Frendin S, De Wit L, Jones G: Effects of bone density feedback and group education on osteoporo-sis knowledge and osteoporoosteoporo-sis self-efficacy in premenopau-sal women: a randomized controlled trial. J Clin Densitom 2005,
8:95-103.
19. Nguyen T, Sambrook P, Kelly P, Jones G, Lord S, Freund J, Eisman J:
Prediction of osteoporotic fractures by postural instability and bone density. BMJ 1993, 307:1111-1115.
20. Ferrari S, Rizzoli R, Slosman D, Bonjour JP: Familial resemblance for bone mineral mass is expressed before puberty. J Clin Endocrinol Metab 1998, 83:358-361.
21. Javaid MK, Cooper C: Prenatal and childhood influences on osteoporosis. Best Pract Res Clin Endocrinol Metab 2002, 16:349-367. 22. Lorig KR, Sobel DS, Stewart AL, Brown BWJ, Bandura A, Ritter P, Gonzalez VM, Laurent DD, Holman HR: Evidence suggesting that a chronic disease self-management program can improve health status while reducing hospitalization: a randomized trial. Med Care 1999, 37:5-14.
23. Lorig KR, Ritter P, Stewart AL, Sobel DS, Brown BWJ, Bandura A, Gonzalez VM, Laurent DD, Holman HR: Chronic disease self-management program: 2-year health status and health care utilization outcomes. Med Care 2001, 39:1217-1223.
24. Angus RM, Sambrook PN, Pocock NA, Eisman JA: A simple method for assessing calcium intake in Caucasian women. J Am Diet Assoc 1989, 89:209-214.
Publish with BioMed Central and every scientist can read your work free of charge
"BioMed Central will be the most significant development for disseminating the results of biomedical researc h in our lifetime."
Sir Paul Nurse, Cancer Research UK
Your research papers will be:
available free of charge to the entire biomedical community
peer reviewed and published immediately upon acceptance
cited in PubMed and archived on PubMed Central
yours — you keep the copyright
Submit your manuscript here:
http://www.biomedcentral.com/info/publishing_adv.asp
BioMedcentral 26. Aaron DJ, Kriska AM, Dearwater SR, Cauley JA, Metz KF, LaPorte RE:
Reproducibility and validity of an epidemiologic question-naire to assess past year physical activity in adolescents. Am J Epidemiol 1995, 142:191-201.
27. Jones G, Scott FS: A cross-sectional study of smoking and bone mineral density in premenopausal parous women: effect of body mass index, breastfeeding, and sports participation. J Bone Miner Res 1999, 14:1628-1633.
28. Withers RT, Davies GJ, Crouch RG: A comparison of 3 W170 protocols. Eur J Appl Physiol 1977, 37:123-128.
29. Pyke JE: Australian Health and Fitness Survey 1985. Edwards-town, South Australia, KB Printing services; 1985.
30. Streiner DL: The case of the missing data: methods of dealing with dropouts and other research vagaries. Can J Psychiatry
2002, 47:68-75.
31. Wolff I, van Croonenborg JJ, Kemper HC, Kostense PJ, Twisk JW:
The effect of exercise training programs on bone mass: a meta-analysis of published controlled trials in pre- and post-menopausal women. Osteoporos Int 1999, 9:1-12.
32. Welten DC, Kemper HC, Post GB, van Staveren WA: A meta-anal-ysis of the effect of calcium intake on bone mass in young and middle aged females and males. J Nutr 1995, 125:2802-2813. 33. Cranney A, Wells G, Willan A, Griffith L, Zytaruk N, Robinson V,
Black D, Adachi J, Shea B, Tugwell P, Guyatt G: Meta-analyses of therapies for postmenopausal osteoporosis. II. Meta-analysis of alendronate for the treatment of postmenopausal women. Endocr Rev 2002, 23:508-516.
34. Paganini-Hill A, Chao A, Ross RK, Henderson BE: Exercise and other factors in the prevention of hip fracture: the Leisure World study. Epidemiology 1991, 2:16-25.
35. Heinonen A, Kannus P, Sievanen H, Oja P, Pasanen M, Rinne M, Uusi-Rasi K, Vuori I: Randomised controlled trial of effect of high-impact exercise on selected risk factors for osteoporotic fractures. Lancet 1996, 348:1343-1347.
36. McDermott MT, Christensen RS, Lattimer J: The effects of region-specific resistance and aerobic exercises on bone mineral density in premenopausal women. Mil Med 2001, 166:318-321. 37. Friedlander AL, Genant HK, Sadowsky S, Byl NN, Gluer CC: A two-year program of aerobics and weight training enhances bone mineral density of young women. J Bone Miner Res 1995,
10:574-585.
38. Sallis JF, Salens BE: Assessment of physical activity by self-report:status, limitations and future directions. Res Q Exerc Sport 2000, 71:1-14.
39. Patterson P: Reliability, validity, and methodological response to the assessment of physical activity via self-report. Res Q Exerc Sport 2000, 71:S15-20.
40. Weller I, Corey P: The impact of excluding non-leisure energy expenditure on the relation between physical activity and mortality in women. Epidemiology 1998, 9:632-635.
41. Heaney RP: Nutrient effects: discrepancy between data from controlled trials and observational studies. Bone 1997,
21:469-471.
42. Campbell DT, Kenny DA: A primer on regression artifacts. In
Methodology in the social sciences New York, Guilford Press; 1999:xxi, 202 p..
43. Trochim WM: The Research Methods Knowledge Base. Sec-ond [http://www.socialresearchmethods.net/kb/regrmean.htm]. 44. Heaney RP: The bone remodeling transient: interpreting
interventions involving bone-related nutrients. Nutr Rev 2001,
59:327-334.
Pre-publication history
The pre-publication history for this paper can be accessed here: