Hot Water Supply Using a
Transcritical Carbon Dioxide
Heat Pump
A thesis presented in fulfilment of the requirement for the degree of
Master of Engineering at Massey University
,
Palmerston North
, New Zealand
.
Roland Kern
Dipl. Ing. FH
Abstract
In New Zealand (NZ) a typical household uses between 160-330 I of hot water per day at 50 to 60°C. Most hot water systems are electrically heated. Heat pumps using carbon dioxide (CO2) in the transcritical heat pump cycle offer high potential for energy savings. The use of CO2 also offers further benefits such high volumetric heating capacity, reduced environmental impact, good availability and low costs.
The objective of this project was to design, build and test a hot water supply system (HWSS) using a CO2 heat pump.
The main components of the HWSS were the heat pump, a stratified hot water storage cylinder (HWC), a water pump and a control system. The heat pump design was based on a prototype Dorin CO2 compressor which was available. Key features were use of a vented spiral tube-in-tube heat exchanger for the gas cooler, use of a low pressure receiver incorporating an internal heat exchanger after the evaporator and the use of a back-pressure regulator as the expansion valve. The heat pump had a nominal design heating capacity of 8.1 kW with a COP of 3.9 at 0°C/34.8 bar.a evaporation temperature/pressure and 100 bar.a discharge pressure when heating water from 15°C to 60°C.
The prototype heat pump performance was measured for a range of operating conditions including 0°C/33.8 bar.g to 15°C/49.8 bar.g evaporation temperatures/pressures, 18 to 30°C cold water inlet temperature, 40 to 60°C hot water outlet temperature and 90 to 120 bar.g discharge pressures. Liquid refrigerant and/or oil carry over caused by limited LPR separation capacity and/or oil foaming in the LPR was apparent for some trials but could not be completely eliminated. The compressor isentropic and volumetric efficiencies were about 30% lower than stated by the manufacturer. Possible reasons were mechanical and/or compressor oil related problems. The gas cooler was marginal in capacity especially when the heat pump operated at high evaporation pressure conditions.
30°C cold water inlet temperature to 8.7 kW and 3.9 at 15°C/49.8 bar.g evaporation and 18°C water inlet respectively.
A mathematical model of the HWSS was developed. The model parameters were determined from a small set of separate trials. The overall agreement between measured and the predicted HWSS performance was good. The HWSS performance was predicted for conditions likely to occur in a one or two family home. The biggest efficiency losses were HWC standing losses to the ambient air. The heat pump operated with close to the maximum COP of 2.75 because the water inlet temperature seldom rose above 25°C. There was potential for efficiency improvements if the short on/off intervals caused by the relatively small HWC relative to the heating capacity of the heat pump could be avoided.
Acknowledgement
Thanks in particular to my Supervisor Dr. Don Cleland (Institute of Technology and Engineering (ITE) Massey University, NZ) for guiding the project, supporting on the thesis and for organising a scholarship.
Thanks to other Massey staff, including Dr. Stephen White (ITE) who introduced me to the CO2 project at Massey University, the staff from the Massey Workshop for their help on building the heat pump test rig, Bruce Collins (ITE) for his support on measurement and electronic devices and Julie Mudford and Jon Hayward (IT) for helping on numerous occasions.
Thanks to Dorin SA for the use of their prototype compressor and to Danfoss SA for access to their prototype CO2 expansion valve.
Thank you to all those who supported me during the Master degree at Massey University and during the writing of the thesis in Switzerland.
Table of contents
ABSTRACT ........................................................................... I ACKNOWLEDGEMENT .............. Ill TABLE OF CONTENTS ........ IV LIST OF FIGURES ...................................... VII LIST OF TABLES ... X
1
2 2.1 2.1.1 2.1.2 2.2 2.2.1 2.2.2 2.2.3 2.2.4 2.2.5 2.3 2.3.1 2.3.2 2.3.3 2.3.4 2.3.5 2.3.6 2.3.7 2.3.8 2.3.9 2.4 3 4 4.1 4.2 4.2.1 4.2.2 4.3 4.4 4.4.1 4.4.2 4.4.3 4.4.4 4.5 4.5.1 4.5.2 4.5.3 4.5.4 4.5.5 4.5.6 4.5.7 4.5.8 4.5.9 4.5.10 4.5.11
INTRODUCTION ....... 1
LITERATURE REVIEW ............. 3
Hot water heating ...................................... 3
Requirements for hot water production ... 3
Hot water supply systems (HWSS).... ... ... .. .. 4
Heat pumps .................................... 5
General heat pump description.. ... .. . .. . .. .. ... . . .. . .... .... .... ... 5
Refrigerants.. ... . ... 6
Conventional heat pumps for water heating . . ... 8
Trans-critical carbon dioxide heat pump .. .... . ... .. . . .. .... . . . ... 10
Applications of carbon dioxide heat pumps ... 19
CO2 heat pump equipment ................................... 21
Personal safety ... ... ... ... ... 21
Carbon dioxide compressors.... . ... 22
Expanders... . . . . ... 23
Expansion valves .. .. ... ... ... .. . . .. . ... 23
Heat exchangers . . . .. .. . . . .. . .. . . .. . . . . . .... .. . . . .. . . ... ... .. .. ... . .... ... . ... . . .. 24
Gas cooler (GC) .... ... 24
Evaporator... . ... 25
Compressor oil ... 26
Oil recovery .. .. . . .. . . ... .. .. . . .. .. . . .. . .. . .. . ... 27
Summary of the literature .................................. 27
OBJECTIVES ................ 29
PROTOTYPE DESCRIPTION ............................. 30
Background ........................................ 30
System design procedure ....................... 31
Hot water supply system (HWSS) design ... 31
Heat pump design... ... ... . ... 32
General prototype description ................ 42
HWSS component designs and descriptions ...... 44
Stratified hot water storage cylinder (HWC) ... 44
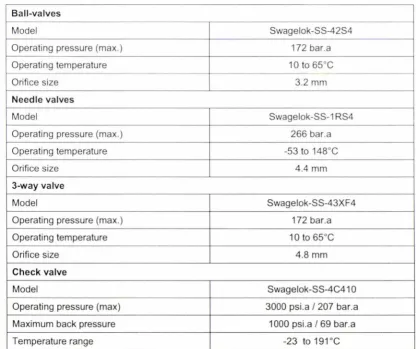
Main water supply pressure reducer ... 45
Water flow control valve ... 45
Tubing ... 46
Heat pump component designs and descriptions ...... 46
Pressure rating and safety factors ... 46
Gas cooler (GC) ... 47
Evaporator ... 53
Internal heat exchanger (IHX) ... 54
Low pressure receiver (LPR) ... 55
Expansion valve/ back-pressure regulator (BPR) ... 57
Compressor ... 58
Compressor oil and oil recovery ... 60
Pipe work ... 62
Refrigerant charge ... 64
4.5.12 4.5.13
Control of the HWSS ... .
Measurement system and data acquisition
... 66
... 67
5 EXPERIMENTAL PROCEDURE ............... 73
5.1 Commissioning ... 73
5.1.1 Leak testing ... ... 73
5.1.2 Refrigerant charging... . ... 73
5.1.3 Heat pump start-up/ shut down procedure... ... . ... 74
5.1 .4 Precision of the heat pump control ... 75
5.1.5 Preliminary trials... . ... 75
5.2 Performance trials ........................................................................... 78
5.2.1 Trial conditions and experimental setup... . ... 78
5.2.2 Heat pump trials ... 81
5.2.3 Hot water cylinder (HWC) trials... . ... .. .. . . ... . ... 83
5.2.4 Trial order ... 84
5.3 Data analysis .... 85
5.3.1 Thermodynamic properties of water and CO2 ...•....•...•• . ... . . 85
5.3.2 Gas cooler (GC) . . . . . . .. . . .. . .. . ... .. 85
5.3.3 Internal heat exchanger (IHX) ... .. ... 89
5.3.4 Evaporator... . . .. .. ... . ... .. . . .. . ... ... 90
5.3.5 Compressor... .. . ... ... ... . . ... . . . ... .. 93
5.3.6 Heat pump efficiency ... 96
5.3.7 Energy balance... ... ... ... . ... ... ... .. 97
5.3.8 Low pressure receiver (LPR) ... .. ... ... . ... .. 97
5.4 Hot water cylinder (HWC) data analysis ............................... 98
6 HOT WATER SUPPLY SYSTEM (HWSS) MODEL DESCRIPTION ...... 100
6.1 Hot water usage ..... 100
6.2 Initial condition ................................................. 100
6.3 Mathematical model of the HWSS ..... 102
6.3.1 Assumptions... . ... ... 103
6.3.2 Water supply system (WSS) ... . ... 104
6.3.3 Heat pump ... . ... 105
6.3.4 Hot water cylinder (HWC) ... ... . ... ... 107
6.3.5 Numerical buffer model.... ... .. . ... 115
6.3.6 HWSS performance ... .... ... ... ... ... . .. 116
6.4 HWSS model checking ............................................................. 118
6.4.1 Time and space discretisation . . ... . ... . ... 118
6.4.2 Model checking ... 122
7 RESULTS AND DISCUSSION ................................ 125
7 .1 CO2 charge and leakage ......................................... 125
7.2 Heat pump operational problems ............ 126
7.3 Heat pump control ............................................................ 127
7.4 Experimental uncertainty ................................................ 127
7.4.1 Energy balance ... 127
7.4.2 Refrigerant mass flowrate balance ... ... 131
7.5 Heat pump performance .............................................................. 134
7.5.1 Compressor ... 134
7.5.2 Gas cooler (GC) ... 140
7.5.3 Internal heat exchanger (IHX) ... 147
7.5.4 Evaporator ... 149
7.5.5 Low pressure receiver (LPR) ... ... 152
7 .5.6 Heat pump process ... 155
7.5.7 Oil behaviour and recovery ... ... 163
8 HWSS PERFORMANCE MODELLING ............. 170
8.1 HWSS model validation ................................................ 170
8.2 Predicted HWSS performance ....................................................... 178
9 CONCLUSION .................... 185
10 RECOMMENDATIONS .......... 188
11 LIST OF REFERENCES ...... 189
12 NOMENCLATURE ................. 202
12.1 List of abbreviations ....................................... 202
12.2 Symbols ..... 202
13 APPENDIX ................. 208
A.1 Refrigerant property data ................................................. 208
A.2 Heat pump design ............................... 209
A.2.1 Heat pump process design model ... .. .... . ... .. .. ... .. ... .. .... .. . . .... 209
A.2.2 Gas cooler performance predictions ... ... 217
A.2.3 Evaporator... . ... ... 227
A.2.4 Internal heat exchanger ... 228
A.2.5 Low pressure receiver ... 229
A.2.6 Pipe work . . .. . .. . . . ... ... .. ... . . ... . . .. . . ... . ... . . .. .. . . .. . ... .. . ... ... ... . . ... . ... 230
L
is
t of figures
Figure 2.1: Temperature profile during heat rejection in a conventional water heating
condenser... ... . .... 9 Figure 2.2: Pressure-Enthalpy diagram for transcritical (left) and conventional (right) heat
pump cycle. . . .. . .. .... .. . . . ... . . . ... .. . .. . . . ... . .12 Figure 4.1: Schematic diagrams of the refrigerant cycles with intermediate-pressure receiver
(IPR) (left) and low-pressure receiver (LPR) (right)... . ... 34 Figure 4.2: Refrigerant cycle with low pressure receiver (LPR) and thermosiphon ... 35 Figure 4.3 Temperature profile in the GC at 100 bar.g discharge pressure, 15°C to 60°C
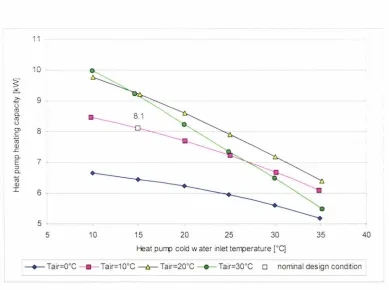
water temperature, 5 K temperature approach at the GC outlet and 5 K compressor suction superheat. . . . .. . . . ... .. . . . ... 37 Figure 4.4 Predicted heat pump capacity at 100 bar.g discharge pressure and at 0, 10, 20
and 30°C air temperature as a function of the cold water inlet temperature... . .. 38 Figure 4.5 Predicted heat pump COP at 100 bar.g discharge pressure and at 0, 10, 20 and
30°C air temperature as a function of the cold water inlet temperature ... 39 Figure 4.6: Predicted heat pump thermal efficiency based on the Carnot efficiency at
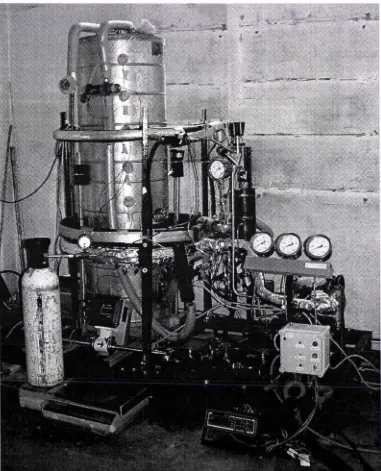
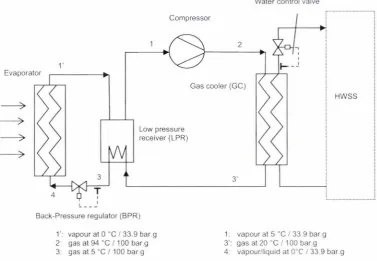
100 bar.g discharge pressure and at 0, 10, 20 and 30°C air temperature as a function of the cold water inlet temperature... . ... ..39 Figure 4.7 Photo of the HWSS prototype ... .42 Figure 4.8: Schematic diagram of the hot water supply system... . ... .. .43 Figure 4.9: Schematic diagram of the heat pump and refrigerant temperatures at the nominal
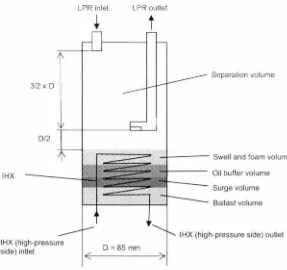
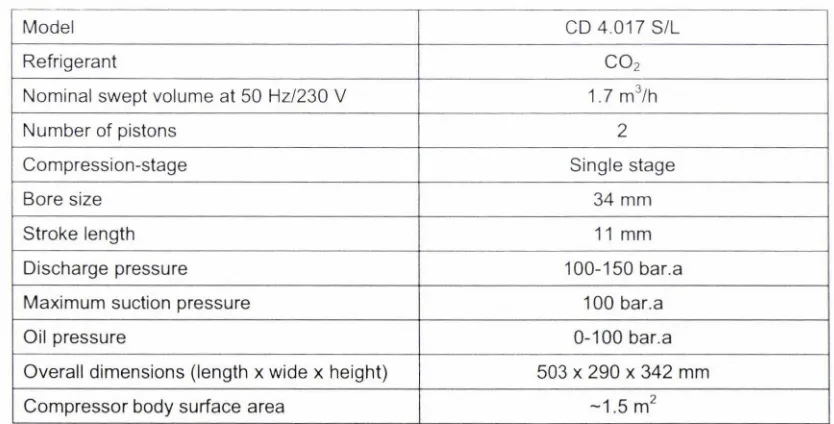
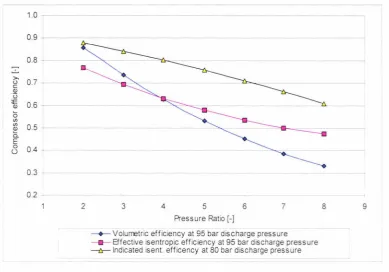
design operating condition. ... . . .44 Figure 4.10: Design of the gas cooler units 1 and 2.1 ... .49 Figure 4.11: LPR design... ... . ... 56 Figure 4.12: Volumetric, isentropic and indicated isentropic efficiency for a single-stage pre
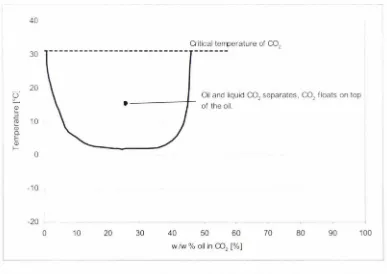
-series Dorin CO2 compressor as a function of the pressure ratio at 95 bar.a discharge pressure and constant superheat of 10 K (Neksa et al, 1999). . .. 59 Figure 4.13 Compressor oil and refrigerant miscibility behaviour between -15°C and 31 °C ... 61 Figure 4.14 Piping and instrumentation diagram for the heat pump and the HWSS
(Table 4.26 gives the code description). ... ... . ... 71 Figure 6.1: Schematic diagram of the water supply system (WSS) showing the model
nomenclature . . . . . . . . 102 Figure 6.2: Schematic of the HWC and a general segment somewhere in the HWC ... 108 Figure 6.3: Predicted HWC temperature in the top segment of HWC after a one hour period
with the heat pump either on (bottom graph) or off (top graph) for varying time step ... . 119 Figure 6.4: Predicted HWC temperature in the top segment of the HWC after a one hour
period and the maximum time step for stability with the heat pump off for varying
number of segments... .. .... . . ... .... ... .. . . .. . . ... ... .... . ... 120 Figure 6.5: Predicted HWC temperature in the top segment of HWC with the heat pump
running and varying number of segments. . . .. . . . ... . . . ... ... .. . . .... . ... 121 Figure 6.6: Difference between the predicted average HWC water temperature and the
analytical solution for a HWC with high water thermal conductivity (well mixed) ... 123 Figure 6.7 Predicted average HWC temperature and analytical solution for a HWC with low
U-value and low water thermal conductivity ... 124 Figure 7.1: Energy imbalance for all experimental trials ... 128 Figure 7.2: Energy imbalance for the different heat pump configurations (bars indicate
means, stub's indicate standard deviation) ... 129 Figure 7.3: Energy imbalance as a function of the compressor suction vapour superheat. ... 130 Figure 7.4: Mass flowrate imbalance for the different measurement setups and heat pump
configurations ... 132 Figure 7.5: Refrigerant mass flowrate imbalance for the GC units that were connected in
series as a function of the heat output of the overall GC unit ... 133 Figure 7.6: Compressor volumetric efficiency as a function of the pressure ratio at 0, 7.5 and
15°C evaporation temperature (TE) and with vapour superheat between 1 and 17 K ... 134 Figure 7. 7: Compressor isentropic efficiency as a function of the pressure ratio at 0, 7.5 and
15°C evaporation temperature (TE) and with vapour superheat between 1 and 17 K ... 135 Figure 7.8: Indicated compressor isentropic efficiency as a function of the pressure ratio at
Figure 7.9: Compressor motor power as a function of the pressure ratio at about 0, 7.5 and 15°C evaporation temperature (TE) and with vapour superheat between 1 and 17 K .... 138 Figure 7.10: U-values of GC 1, GC 2.1 and GC 2.2 as a function of the heat transfer rate ... 141 Figure 7.11: U-value of the GC 3.1 and GC 3.2 as a function of the heat transfer rate ... 142 Figure 7.12: U-value of the GC 1, GC 2.1 and GC 2.2 at constant refrigerant mass flowrate
as a function of the water mass flux ... 143 Figure 7.13: Refrigerant side heat transfer coefficient as a function of the refrigerant mass
flux and at the nominal heat pump operating condition (C11) ... . ... 144 Figure 7.14: GC3.1 effectiveness as a function of the GC refrigerant inlet temperature for
60°C hot water temperature. ... . ... ... 145 Figure 7.15: Precession of the modelled data ... 146 Figure 7.16: IHX transfer heat rate as a function of the I HX efficiency. . ... ... 14 7 Figure 7.17: Overall heat transfer coefficient of the IHX as a function of the IHX
effectiveness.... . .... 149
Figure 7.18: Overall U value for the evaporator as a function of the water mass flux. . ... 150 Figure 719: Refrigerant side heat transfer coefficient for the evaporator as a function of the
refrigerant mass flux. ... . ... 151 Figure 7.20: Vapour superheat as a function of the gas velocity in the LPR at different
evaporation conditions. . . . ... .. ... ... . . .. ..152 Figure 7 .21: Calculated compressor efficiency as a function of the gas velocity in the LPR ... 153 Figure 7.22: Heat pump COP as a function of the discharge pressure at 60°C hot water
temperature, varying cold water temperatures and varying evaporation temperature and pressure... . . . . .. . ... . . .. . ... .. . .. . . ... ... .. . . . . . ... 156 Figure 7.23: Heat pump heating capacity as a function of the discharge pressure for 60°C
hot water temperature, varying cold water temperatures and evaporation
temperature/pressure. . .. .. . . .. . . ... . . . .. . . .. . . .. . .. . . . .. ... . . . .. . . .. . . . ... . .... 157 Figure 7.24: Heat pump thermal efficiency relative to the Carnot efficiency for 60°C hot water
temperature and 0°C/33.8 bar.g evaporation as a function of the discharge pressure and cold water temperatures... . . . . .. . . . ... . ... 158 Figure 7.25: Heat pump thermal efficiency relative to the Carnot efficiency for 20 to 60°C
cold to hot water temperature as a function of the discharge pressure and evaporation temperature/pressure. . ... ... . . . ... 159 Figure 7.26: Heat pump COP at 105 bar.g discharge pressure and varying heat pump cold
water (Tew) inlet temperatures. . . ... . . ... . . ... ... ... . . .. . . .. . . .. . .. . . ..161 Figure 7.27: Heat pump heat capacity at 105 bar.g discharge pressure and varying heat
pump cold water (Tew) inlet temperatures... . . .. . . . .. .. . . ... ... . . . ... . ... 162 Figure 7.28: Heat pump COP at 105 bar.g discharge pressure and varying evaporating
temperatures (TE). . . ... . . .. . . . . ... ... .. . . . .. . ... . ... ... 162 Figure 7.29: Heat pump heat capacity COP at 105 bar.g discharge pressure and varying
evaporating temperatures (TE). . .. . . . .. . . ... ... ... .. . . ... . . .. . ... 163 Figure 7.30: Effect of the oil return on the compressor performance at 105 bar.g discharge
pressure, 20°C/60°C GC water temperatures and 0°C/33.8 bar.g evaporation
temperature/pressure (C19). ... .... .. .. .. ... ... . ... 164 Figure 7.31: Measured water temperature in the HWC during a recovery period with the
heat pump operating at 105 bar.g discharge pressure, 0°C/33.8 bar.g evaporation
temperature/pressure and an initial water flowrate of 121 1/h ... 165 Figure 7.32: HWC mean water temperature and HWC heat losses during the first heat loss
trial (heat-loss 1)... . ... 166 Figure 7.33: HWC mean water temperature and HWC heat losses during the second heat
loss trial (heat-loss2) ... 167 Figure 7.34: Temperature profiles in the HWC during the water withdrawal (cooling trial) and
the second heat loss trial (heat-loss2) ... 169 Figure 8.1: Comparison of predicted and measured HWC average temperature for the first
heat loss trial (heat-loss 1 ) ... 170 Figure 8.2: Comparison of measured and predicted thermoclines for the first heat loss trial
(heat-loss 1 ) ... 171 Figure 8.3: Comparison of predicted and measured HWC average temperature for the
second heat loss trial (heat-loss2) ... 172 Figure 8.4: Comparison of measured and predicted thermoclines for the second heat loss
trial. ... 173 Figure 8.5: Comparison of measured and predicted average HWC temperature for the
heating trial... .. .. . .. ... .. .. . ... ... ... . . . ... . ... 17 4 Figure 8.7: Comparison of measured and predicted average HWC temperatures for the
cooling trial. . . . . .. . . . .. . ... . . .... . ... 176 Figure 8.8: Comparison of measured and predicted thermoclines in the HWC for the cooling
trial.. ... . ... 176 Figure 8.9: Hot water flowrate withdrawn from the HWC and/or the heat pump for user A, B
and A&B water consumption. . .. . . .. . . ... . . .. . . .. . ... 178 Figure 8.10: Temperature of the withdrawn hot water from the HWC and/or the heat pump
for user A, B and A&B water consumption .179
Figure 8.11: Heat pump cold water inlet temperature for user A, Band A&B water consumption.
Figure 8.12: Heat pump heating COP for user A, B and A&B water consumption ... . Figure 8.13: Heat pump heat capacity for user A, B and A&B water consumption.
Figure 8.14: Predicted HWC temperatures when supplying the users A&B with hot water with thermostat settings of 25°C and 15 K dead band ...
Figure 8.15 Predicted HWC thermoclines when supplying the User A&B with hot water
... 179 .... 180 .180
... 183
List of tables
Table 4.1: Typical NZ climatic data (ASH RAE, 2001) ... . ... 33
Table 4.2: Nominal heat pump design criteria's and corresponding heat exchanger requirements . .. . . .. ... ... . .. . . ... . 38
Table 4.3: Predicted heat pump performance at the nominal design and other operating conditions... ... . ... .40
Table 4.4: Hot water storage cylinder specifications ... .45
Table 4.5: Water flow-control valve specifications . . ... .45
Table 4.6: Water pump specifications... .. ... .46
Table 4.7 GC specifications ... . ... .47
Table 4.8: Dimensions and predicted performance of the gas coolers 1, 2.1 and 2.2 at the nominal design conditions. .. ... 51
Table 4.9: Dimensions and predicted performance of the gas coolers 3.1 and 3.2 at design conditions .. . ... 52
Table 4.10: Evaporator specifications . . ... ... . ... 53
Table4.11: IHXspecifications .... 55
Table 4.12: LPR specification ... .. .... . .... . ... 57
Table 4.13: Expansion valve specifications. ... ... . .... 58
Table 4.14: Compressor specifications.... . ... 58
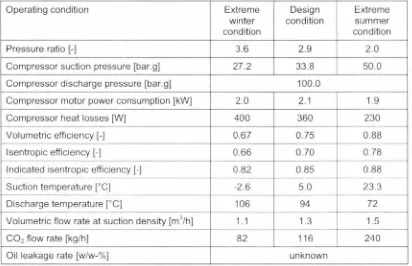
Table 4.15: Expected compressor performance data at the various design operating conditions .. 60
Table4.16: Compressor oil data.. . ... .. 61
Table 4.17: Tube specifications design conditions.. .. ... ... .62
Table 4.18: Refrigerant valve specifications... . .. ... ... .. . ... 63
Table 4.19: Volume and refrigerant charge of the low- and high-pressure side of the system at design conditions... .64
Table 4.20: Relief valve specifications... . ... 65
Table 4.21: Compressor discharge non-return valve specifications... ... . ... 65
Table 4.22: Heat pump control parameters... . ... 67
Table 4.23: Thermocouple and datalogging specifications... . ... 68
Table 4.24: Pressure gauges specifications. ... ... . ... 68
Table 4.25: Water flowmeter specifications ... 69
Table 4.26 Energy analyser specifications.. ... ... ... .70
Table 4.27: Piping and instrumentation of the heat pump and the HWC ... .72
Table 5.1: Heat pump control precision... .... ... . ... .75
Table 5.2: Reference process trial conditions ... ... . ... .78
Table 5.3: Heat pump operating conditions used in the trials... . ... .79
Table 5.4: The experimental set-ups used for the experimental trials ... 80
Table 5.5: Gas cooler performance trial objectives, heat pump operating conditions and experimental set-ups . . . .. . . . .. . . .. . . . .. 81
Table 5.6: Compressor performance trial objectives, heat pump operating conditions and experimental set-up.. ... ... . .... 82
Table 5.7: Heat pump performance trial objectives, heat pump operating conditions and experimental set-up ... 82
Table 5.8: Refrigerant charge trial objectives, heat pump operating conditions and experimental set-up ... 83
Table 5.9: HWC heating trial objectives, heat pump operating conditions and experimental se~up ... 83
Table 5.10: HWC cooling trial objectives, heat pump operating conditions and experimental set-up ... 84
Table 5.11: HWC standing losses trial objectives, heat pump operating conditions and experimental set-up ... 84
Table 6.1: HWSS water consumption profiles for a household with moderate (profile A) and excessive (profile B) hot water usage ... 101
Table 6.2: Valid range of the heat pump performance equations ... 106
Table 6.3: Boundary conditions for the HWC model. ... 113
Table 7 .1: GC performance at the nominal heat pump operating condition (C11) ... 140
Table 7.2: Discharge pressure for maximum COP's ... 160
Table 8.2: Predicted HWSS performance for moderate hot water consumption (user A), excessive water consumption (user B) and when supplying both users A&B over a
24 hour period. .... ... ... . ... 181
Table 8.3: Predicted HWSS performance with 5 to 25 K heat pump control temperature dead band... . ... 182
Table 13.1: List of the heat pump and HWC trials. ... ... . ... . . 232
Table 13.2: Heat pump raw data ... . .. . .. ... ..236
Chapter 1 Introduction
1 Introduction
New Zealand (NZ) is about to ratify the Kyoto protocol, a global convention to reduce
the global greenhouse gas emissions. Fundamental to the convention is the
development of more energy efficient technologies and greater use of renewable
energies.
New Zealand's energy production is predominantly fossil fuel based (72% of the total),
followed by hydro-powered electricity (23%), geothermal electrical power (5%) and other renewable energies (less than 1 %) (Ministry of Economic Development, 2000).
The production of sanitary hot water in domestic household accounts for 8.7% of the
total energy use and represents 38% of the domestic energy consumption (4000
kWh/year for the average household).
Water heating technology in domestic and commercial applications is dominated by electric (69%) and gas-fired (19%) storage units (Williamson and Clark, 2001 ).
Alternative systems, such as solar thermal, wet-backs and heat pumps represent less than 1 % of the market. Even though the gas instantaneous water heaters dominate
many world markets, the technology has only 8% of the market in NZ.
World-wide about 90 million heat pumps were installed in the year 1997, predominately for residential space heating, air conditioning and cooling applications (Runacres,
2002). The heat pump market has grown at an average of 15% per year since 1992.
The biggest markets are China, Japan and the USA.
Heat pumps have the potential for high-energy efficiency but the high heating
temperature required for the domestic hot water production limits their efficiency and use in domestic water heating applications. Therefore the use of heat pumps for water heating has not been as widespread as the use of heat pumps for space heating and
air conditioning.
The recent concerns of ozone depletion and global warming caused by the emission of
fluorocarbon refrigerants, has increased the research on more sustainable heat pump technology. One alternative is the natural refrigerant carbon dioxide (CO2), which has high potential for water heating applications when used in a transcritical heat pump
Chapter
1
Introduction
The
overall
aim
of
this
research
was
to
develop
and
test
the
performance
of
a
water
heating
heat
pump
using
the
transcritical
CO
2
cycle
based
on
a
prototype
compressor
produced
by
Dorin
SA
an
ltalien
compressor
manufacturer
.
Chapter 2 Literature Review
2 Literature Review
The scope of this chapter was to review the requirements of domestic hot water
heating in NZ and the state of art technology for hot water supply systems, including conventional heat pump technology. Further the advantages and disadvantages of both
conventional and CO2 heat pumps for water heating and the general applications for
CO2, including the availability of the equipment were reviewed.
2.1 Hot water heating
The technology used for hot water supply systems (HWSS) in NZ has been
summarised by Williamson and Clark (2001 ). This survey of NZ's households covers many aspects of the hot water production such as economic requirements for hot water production and safety standards. Further information about the state of art technologies, used for hot water production in NZ were available on the Energy Efficiency Resource Assessment (EERA) (Rossouw, 2000). Corresponding data for the American situation is available from ASHRAE (1999).
2.1
.1 Requirements for hot water production
The HWSS must heat cold fresh water from the main supply to the desired temperature and supply the user with sufficient hot water at any time (Williamson and Clark, 2001 ). The main requirements for HWSS's are reliability, safety, energy efficiency and low cost. The most common water temperature is in the range of 50-70°C for households
and up to 100°C in the commercial sector and/or special circumstances. The amount of hot water typically used in NZ varies between 160 and 330 litres at 60°C per day per
household.
New Zealand's building code requires the hot water production temperature to be 60°C
or higher to avoid the growth of Legionel/a. However, the delivery temperature to the user is often lower than 55°C to reduce the danger of burns. ASHRAE (1999) provides more detailed information about Legionella and other bacterial growth in water supply
Chapter 2 Literature Review
2.1.2 Hot water supply systems (HWSS)
The general function of the HWSS is to supply the user with sufficient hot water at any time. The hot water can either be a) produced on-demand orb) supplied out of a water storage tank (hot water cylinder, HWC).
a) On-demand water heating
On-demand water heaters (also called: instantaneous water heaters) operate without a storage tank and the hot water is produced and supplied directly to the user when required. The heating capacity requirement of such an installation is high compared to a hot water supply system operating with a storage tank. Electric installations generally operate at constant power and the water temperature is controlled by the water flow rate, whereas modern gas powered units control the gas combustion to produce the water at the demanded temperature. Electric instantaneous water heaters have efficiencies of about 95%, while gas powered units typically achieve efficiencies of 65 to 80% due to the losses associated with the pilot flame of the gas burner and losses of the flue gas (Williamson and Clark, 2001 ).
b) Storage systems
Water heaters that operate in combination with a HWC heat the water over the time and store the water at useful temperature in the HWC until needed. The heating capacity is designed to heat the content of the HWC within the desired recovery time of the HWC. Typical recovery time is 4 to 6 hours and the water in the cylinder is often heated during the night using low night power-supply rates. The water heater starts operating when the water temperature at the thermostat, which is installed towards the bottom of the HWC, is lower than the set point.
Gas heated storage systems typically achieve efficiencies of 70-80%. The only losses of electric HWC are the so-called standing losses of the HWC (i.e. convective heat losses to the surrounding air).
Chapter 2 Literature Review
HWC's typically rely on the creation of a thermocline between the hot and the cold
water. Hot water is drawn to the top of the HWC and is replaced by cold water entering
at the bottom. Density differences prevent mixing of the water until heating starts. Most
electric and gas installations heat the water at the bottom of the HWC so that the hot
water with a low density rises to the top, while the colder water with a high density
sinks to the bottom. Hence during heating the contents of the HWC is mixed. Some
HWC use an electric boost-element at the top of the cylinder so the upper part of the
cylinder can be recovered faster and a shortage of hot water prevented.
A more enhanced separation of the hot and cold water in the cylinder can be achieved
with a fully stratified HWC. The cold water from the bottom of the cylinder circulates
through an external water heater, where it is heated to the hot water temperature and
returns to the top of the HWC. Similarly when hot water is supplied to the user out of
the top of the cylinder, cold water flows through the bottom inlet. Thereby mixing of the
hot and cold water is limited and the hot water temperature remains high until the HWC
is nearly completely exhausted.
There have been numerous theoretical analysis and experimental investigations into
stratified chilled water storage tanks ( e.g. Nelson et al, 1998). However, investigations into stratified hot water storage tanks have been less frequently reported (e.g. Oppel et
a/, 1986).
2.2 Heat pumps
2.2.1 General heat pump description
Heat pumps transfer heat from a reservoir at low temperature (heat source) to a
reservoir at high temperature (heat sink) by using the phase change energy of a
working fluid (refrigerant). In the most common vapour compression cycle, the liquid
refrigerant evaporates in a heat exchanger (evaporator) at a low pressure and
temperature by absorbing heat from the heat source. The vapour is compressed to a
higher pressure and temperature and condenses in a second heat exchanger
(condenser) by rejecting the heat to the heat sink. A throttling device closes the cycle
by expanding the working fluid to the low pressure again. The heat pump process
Chapter 2 Literature Review
The efficiency of a heat pump is usually expressed as the coefficient of performance
(COP), which describes the ratio between useful energy output and energy input to the
process (ASH RAE, 2001 ). The ideal theoretical process is the completely reversible
Carnot cycle. According to the second law of thermodynamics the heat sink and heat
source temperatures determine the Carnot cycle efficiency.
Thea/ sink
COPcamot
=
-Theat sink - Thea/ source
Practically the efficiency of the Carnot cycle never can be achieved since the heat
transfer in the heat exchangers and the compression and expansion are not
irreversible. In heating mode the COP of a heat pump is given by:
COP
=
heat output=
heat transfered in the condensorheat .
work input work to compressor
Heat pumps are often characterised by their thermal efficiency related to the Carnot
cycle (Carnot efficiency):
COPheat r7 Carnot -- COP
Carnot
Heat pumps operating in conventional applications such as air conditioning and space
heating in a moderate climate, generally achieve COP's in the range of 3 to 5 and up to
8 in special circumstances. The Carnot efficiency is generally in the range of 0.2-0.5
and seldom higher than 0.6, because approximately 50% of the efficiency losses are
caused by the compressor, temperature differences in the heat exchangers and the
throttling losses (Neksa, 1994 ).
2.2.2 Refrigerants
Refrigerants are the working fluid in heat pump cycles. According to the second law of
thermodynamics the theoretical energy efficiency of a heat pump system depends only
on the thermodynamic process and is independent of the thermodynamic properties of
Chapter 2 Literature Review
The main thermodynamic characteristics of the refrigerants are their critical
temperature, thermal conductivity, latent heat of evaporation, specific volume of
vapour, and viscosity. Also important are their long-term chemical stability under typical
operating conditions, their safety, such as toxicity, flammability and odour, plus their
compatibility with the system components, availability, cost and their environmental
compatibility (ASH RAE, 2001 ).
Refrigerants used are dominated by the synthetic fluorocarbon refrigerants so
conventional heat pump equipment has been standardised to suit these refrigerants
(e.g. maximum pressure rating of 25 bar). For example the frequently used synthetic
refrigerants HCFC-22, HFC-134a and HFC-407C have saturation pressures of 5.0 bar,
2.9 bar and 4.9 bar at 0°C and 24.3 bar, 16.8 bar and 26.6 bar at 60°C respectively.
2.2.2.1 Phase out of synthetic refrigerants
The fluorocarbon based synthetic refrigerants, such as CFC's and HCFC's are harmful
to the environment, cause long-term global damage to the ozone layer and contribute
to global warming due to their high chemical stability and other chemical properties.
The Montreal protocol initially signed in 1987, and its following revisions, successively
ban "substances that deplete the ozone layer". The production of CFC's has been
prohibited since 1996 and the production of HCFC's will be stopped completely by
2030. The hydro-fluorocarbons (HFC's) do not deplete ozone and their production and
use is not restricted by the Montreal protocol. However restrictions to their use may be
imposed by individual countries due to the global warming effects (ASH RAE, 2001 ).
CFC's or HCFC's refrigerants can either be replaced by drop-in refrigerants with similar
thermodynamic properties, such as HFC's or replaced by working fluid with no ODP
and low GWP, such as natural refrigerants. The high GWP makes the use of the HFC's
debatable and critics have proposed the use of natural working fluids with known
long-term effects on the environment (e.g. Lorentzen, 1994a; Novelli, 1994; Halozan et al,
1994; Pettersen, 1995).
2.2.2.2 Natural refrigerants
The natural substances that are suitable to be used as working fluids are air (R-729),
Chapter 2 Literature Review
carbon dioxide (R-744), nitrogen (R-728) and noble gases. In the recent past, only
ammonia has commonly been used in commercial applications (Lorentzen, 1994b).
The advantages of the natural working fluids are their known short- and long-term
effects on the environment. The main disadvantageous compared to the synthetic
refrigerants is their chemical properties. In particular, many of the natural working fluids
are flammable and/or toxic, which limit their use as commercial refrigerants due to
safety reasons. However, Lorentzen (1994b) suggested that the danger of natural
working fluid in domestic applications is often overestimated. It is pointed out that
natural working fluids are already widely used in (non-refrigerant) domestic and
commercial applications.
2.2.3 Conventional heat pumps for water heating
Tap water heating requires relatively large temperature lifts e.g. from an ambient
source temperature of 15°C or less to a hot water temperature greater than 60°C.
The hot water temperature of a conventional heat pump for water heating is limited by
the condensing temperature of the working fluid at the given operation conditions. The
working fluid enters the condenser as superheated gas and cools down until the gas
starts to condense at constant temperatures (Figure 2.1 ). The water is heated counter
currently and at a gliding temperature. The driving force for the heal transfer in the heat
exchanger decreases as the water heats up and there is a pinch where the working
fluid starts to condense. The temperature gradient may become so small, that little
further heat can be transferred.
The pinch effect can be minimised with condensing temperatures much greater than
the desired hot water temperature. However, this implies a large pressure ratio leading
to reduced process efficiency. Therefore the water is often heated by re-circulating it
through the heat exchanger several times before reaching the desired end-point
temperatures. At the beginning of the heating process, the condensing temperature is
low due to the low mean water temperature in the heat exchanger. The water
temperature increases with each circulation through the heat exchanger so the
condensing temperature increases and the process becomes progressively less
Chapter 2
Temperature T
Condensing temperature
/ sub-cooling
Refrigerant outlet
Water inlet
Literature Review
de-superheating Refrigerant inlet
Water outlet
Position in condenser
Figure 2.1: Temperature profile during heat rejection in a conventional water heating condenser.
The practical feasible process efficiency of conventional heat pumps is about 50% of the ideal Carnot cycle efficiency, resulting in COP's of 2.5 to 3.0. This is relatively low compared to many other heat pump applications.
Egger (1987) investigated practical improvements to conventional hot water heat pumps. The largest source for improvements was the compressor performance. With recently available components, efficiency improvements were achieved by using a stratified HWC, which reduces the heat pump water inlet temperature and by using an internal heat exchanger (IHX) for suction vapour superheating. The later has increased the COP of the tested heat pump by 10 to 12%. The refrigerant used in the heat pumps was not mentioned. However whether the IHX improves the COP depends on the type of refrigerant because increased superheat is not useful for all refrigerants.
In contrast, investigations carried out by Klein et al (1999) have shown, that the effect of a suction side heat exchanger for suction vapour superheating and simultaneous
high pressure refrigerant sub-cooling, depends on the process conditions, the
refrigerant and pressure drop in the heat exchanger. Higher superheating results in
increased compressor discharge temperature but at the costs of reduced refrigerant
mass flow rate and leads to poor compressor performance. It was found that the COP
changes in direct proportion to the capacity.
From a cost perspective, any gains in the COP and the reduced energy costs may not
compensate for the loss of capacity since the lower capacity requires a bigger
Chapter 2 Literature Review
Carrier Ltd (NZ) produced an air-source heat pump for water heating in domestic
applications using HCFC-22. The heat pump has a nominal capacity rating of 1.9 kW at
18°C ambient air temperature and produces water at constant temperature of 60°C.
The heat pump gives a seasonal COP of 2.0 to 2.3 in NZ. The heat pump operates in
combination with a stratified water storage tank. The heat pump installation is 0.7 m
wide by 0.5 m high and 0.28 m deep and can be installed in a ceiling space or
outdoors.
Field test data of heat pump water heaters, operation problems and practical
experiences such as installations and the costs have been reported by Hiller (2002).
The investigation has shown that the first cost of a heat pump water heater, including
the installation costs is more than double normal electrical installations.
2.2.4 Trans-critical carbon dioxide heat pump
2.2.4.1 Carbon dioxide as a working fluid
Environmental aspects
Carbon dioxide is a greenhouse gas with a global warming potential (GWP) of one and
no ozone depletion potential (ODP). Therefore it has no harmful effects on the ozone
layer and there are no unknown long-term effects on the environment. Since carbon
dioxide is recovered from the atmosphere or from industrial vent gas, its use as a
refrigerant does not have a negative impact on the greenhouse effect (Lorentzen,
1994a, 1994b; Pettersen, 1995).
Thermodynamic properties
The characteristics of carbon dioxide have been described in many publications, such
as by Pettersen (1995). Important characteristics are the low temperature of the critical
point (31.1 °C and 73.8 bar), the high saturation pressure at normal operating
conditions resulting in high volumetric refrigerating capacity, and the rapid changes in
the specific enthalpy above the critical point.
Thermodynamic and transport property data and methods for their evaluation, including
the deviation from the ideal gas behaviour in the supercritical region, have been
Chapter 2 Literature Review
terms, carbon dioxide transport properties lead to low pressure-drop and high rates of
heat transfer.
Chemical properties
The chemical properties of carbon dioxide are well known. Carbon dioxide is a
colourless and odourless gas. Below 2000°C it remains stable and inert. It is
non-flammable and non-toxic (unlike all other natural alternatives that are toxic and/or
combustible), although it can lead to asphyxiation. Carbon dioxide is harmful and
causes headache, dizziness, fainting and finally death, when in concentrations higher
than 15% (v/v) in air. Since the gas is 1.5 times heavier than air it can accumulate to a
deadly concentration in closed rooms or cellars.
When releasing high-pressure liquid carbon dioxide at normal ambient temperatures to
atmospheric pressures, two thirds of the liquid evaporates and the rest becomes solid
"dry ice" at -80°C. The dry ice slowly sublimates under atmospheric conditions.
Carbon dioxide is compatible with normal lubricants and construction materials.
However, zinc should not be used since it will react to zinc-hydroxide (Zn(OH2)).
Leisenheimer and Fritz (2000) studied the compatibility of carbon dioxide with
elastomers, focusing on the leakage of the refrigerant. It was shown that fluorinated
elastomers performed well in carbon dioxide systems.
2.2.4.2 Carbon dioxide heat pump process
In heat pump applications, CO2 must generally be operated in a transcritical cycle,
because of the low critical temperature. The system pressures in a transcritical refrigerant cycle are generally higher than in a conventional system. The behaviour of
heat pumps based on the trans-critical carbon dioxide cycle has been described by
many authors (e.g. Lorentzen, 1994a, 1994b; Neksa, 1994; Pettersen, 1995; Halozan
and Rieberer, 1999, 2000).
The main characteristic of the transcritical vapour cycle is the heat rejection above the
critical point and the heat absorption below the critical pressure of the working fluid
(Figure 2.2, left) whereas in a conventional (Evan-Perkins, E-P) refrigerant process the
Chapter 2 Literature Review
Pressure Pressure
Critical point Critical point
✓
Specific enthalpy Specific enthalpy
Figure 2.2: Pressure-Enthalpy diagram for transcritical (left) and conventional (right) heat pump cycle.
Above the critical point the working fluid is no longer a liquid or a gas but a supercritical
fluid. A supercritical fluid is a gas-like medium with strong deviation from the ideal gas
laws. Saturated conditions do not exist and the fluid does not change phase. Hence it
cannot condense, and unlike the saturated condition in the two-phase area, the
pressure and temperature are independent of each other. The heat rejection in the
supercritical region takes place at gliding temperatures in the gas cooler (GC:
equivalent to the condenser in a sub critical heat pump). The supercritical process can
theoretically supply unlimited amount of heat by increasing the high pressure.
However, practically the heating capacity is limited by the compressor efficiency,
because increased discharge pressure implies higher compressor pressure ratio.
Discharge pressure control
The discharge pressure in the supercritical area is not determined by the condensing
temperature and some kind of pressure control is required. For the selection of the
discharge pressure, the heat pump heating capacity, efficiency and gas cooler length
and costs have to be considered. At given heat pump conditions, the discharge
pressure can be optimised. Due to the shape of the isotherms above the critical point,
there exists an optimum pressure where the gain in the rejected heat does not
compensate the additional compressor work and the associated heat pump efficiency
losses so the COP is maximised (Neksa et al, 1997, 1998).
The term optimum discharge pressure for maximum COP is ambiguous in the literature
and the difference between the theoretical maximum COP and the maximum feasible
Chapter 2 Literature Review
has a significant influence on the system efficiency and the feasible COP is mainly limited by the temperature approach at the end of the gas cooler.
The optimum discharge pressure has been studied by many authors such as Pettersen and Skaugen (1994 ), Liao and Jakobsen (1998) and Vaisman (2000, 2002). The pressure is mainly affected by the heat sink inlet temperature, the heat source temperature and the compressor efficiency; in particular the heat sink inlet temperature has a strong influence on the COP. The usage of an internal heat exchanger reduces the efficiency losses when operating at a non-optimum discharge pressure.
Experimental studies, including those by Pettersen and Skaugen (1994 ), Grohmann and Wobst (1998) and Rieberer et al (2000) have shown less influence of the discharge pressure on the system efficiency than expected from theoretical cycle calculations.
Pettersen and Skaugen (1994) measured process efficiency losses of 5% with deviations of about 4 to 5 bar from the optimum discharge pressure when operating at heat sink inlet and outlet temperatures of 35°C and 50°C and an evaporation temperature of 5°C. Similar observations have been made by Rieberer et al (2000). The performance of a heat pump was measured at a heat source inlet temperature between -10°C and 20°C and a temperature of 10°C and 60°C at the heat sink inlet
and outlet respectively. The measured COP changes were ±2.5% for deviations of
±10 bar from the optimum discharge pressure.
More significant changes in the optimum discharge pressure were observed when varying the heat sink inlet temperature between 10°C and 50°C. For a constant heat sink outlet temperature of 60°C and a constant heat source temperature of 10°C, the
COP decreased from 3.9 at 10°C heat sink inlet temperature to 3.2 at 30°C (18% drop in COP) and 2.4 at 50°C (38.5% drop in COP). Hence a discharge pressure control is
required to achieve satisfactory efficiency if the heat sink inlet temperature varies (Rieberer et al, 2000).
Chapter 2 Literature Review
2.2.4.3 Refrigerant cycle
The existence of the optimum heat rejection pressure for maximum COP has to be
considered for the cycle design and its control strategy. Possible cycle configurations, aiming to produce simple and cost-effective discharge pressure control at a maximum
or near maximum efficiency have been proposed by many authors (e.g. Lorentzen and
Pettersen, 1993); Pettersen and Skaugen, 1994; Pettersen, 1999a). The main
differences relate to the use of liquid receivers. The most frequently investigated
configurations are:
a) Cycle with a low pressure receiver
b) Cycle with an intermediate pressure receiver
c) Cycle without a receiver
a) Cycle with
a
low pressure receiver (LPR)Lorentzen (1993) patented a cycle with a low-pressure receiver that is suitable for the
transcritical carbon dioxide process. It is known as the Lorentzen cyc!e and has proven
satisfactory performance in air conditioning and water heating applications. The cycle
has been described and tested by Pettersen and Skaugen (1994 ), Neksa et al (1997)
and Rieberer et al (2000) among others.
The cycle consists of a compressor, gas cooler (GC), internal heat exchanger (IHX),
expansion valve, evaporator and LPR. The expansion valve controls the discharge
pressure. The evaporation process in the flooded evaporator unit is not controlled. The
LPR receiver has multiple functions, such as the separation of the vapour/liquid mixture
at the end of the evaporator, it provides buffer refrigerant to maintain the optimum
refrigerant charge at changing operation conditions, it provides surge volume and it
prevents liquid carry over to the suction of the compressor. The advantage of this
configuration is the self-balancing low-pressure side, operating at maximum
evaporation pressure at all operation conditions and the simple cycle control with only
one valve. A disadvantage is that the oil has to be recovered from the LPR.
b) Cycle with a intermediate pressure receiver (IMP)
The refrigerant cycle with an IMP has been described by Pettersen (1999a), and
Chapter 2 Literature Review
pressures in the receiver. In a second expansion, the refrigerant is expanded to the
evaporation pressure using a conventional thermostatic expansion valve. The
discharge pressure is controlled by the first expansion valve, which controls the
refrigerant flow to produce a constant suction vapour superheat. The IMP stores
refrigerant at changing conditions. Oil is carried back to the compressor by the suction vapour. Difficulties sizing the receiver and the expansion valve have been reported but
it was suggested that the performance is as good as the cycle with a LPR (Rieberer et
al, 2000).
c) Cycle without a receiver
Grohmann and Wobst (1998) and Rieberer et al (2000) tested systems without a
receiver.
The cycle operates with a thermostatic valve, which controls the evaporation so that
the discharge pressure becomes a function of the refrigerant charge and the operating
conditions. The main advantage is the simplicity but it is at the cost of reduced control
flexibility. Also, the system is sensitive to refrigerant charge.
Rieberer et al (2000) investigated the effect of the refrigerant charge on the system
efficiency. The heat rejection pressure remained near the optimum discharge pressure
when undercharged while 15% overcharge result in excessive (40 bar) deviations from
the optimum discharge pressure at -10°C heat source temperatures. However the significance of the refrigerant charge on the system efficiency depends on the system
design, such as the volume of the high and low-pressure side components.
Refrigerant cycle control
In a transcritical heat pump two parameters may have to be controlled: (a) the
discharge pressure and (b) the system capacity. The heat rejection pressure affects
both the system efficiency and the capacity.
a) Control of the discharge pressure
The discharge pressure can be actively controlled by an expansion valve or passively
controlled by the conditions in the low-pressure side. Options for active control are to
control the optimum pressure or to hold the pressure at a constant pressure near the
Chapter 2 Literature Review
Pressure control at optimum pressure has been described by many authors (e.g.
Pettersen and Skaugen, 1994; Rieberer et al, 2000). Most controlled the pressure
using the refrigerant temperature at the gas cooler outlet as the control parameter. It
was suggested that a linear pressure control, proportional to the increasing refrigerant
gas cooler outlet temperature is appropriate for a wide range of operating conditions.
Rieberer et al (2000) controlled the discharge pressure by sensing the compressor
discharge temperature, rather than the refrigerant temperature at the gas cooler outlet.
Grohmann and Wobst (1998) proposed that the gain in the efficiency does not justify
the equipment costs for exact heat rejection pressure control. The efficiency of an
air-conditioning system varied less than 4% when changing the discharge pressure
between 95 and 110 bar. Similar observation have been made by Pettersen and
Skaugen (1994) and Rieberer et al (2000).
b) Capacity control
Lorentzen (1993) suggested the possibility of capacity control through discharge
pressure adjustments. Later experimental results showed that the capacity control is
limited by the compressor inefficiency and by the reduced refrigerant mass flow
(Pettersen and Skaugen, 1994 ). It was suggested that conventional capacity control
based on speed control of the compressor would be both more efficient and simpler.
2.2.4.4 Heat pump performance
General methods for efficiency evaluations of the transcritical cycle based on the
modified cryogenic approach have been described by Vaisman (2000, 2002).
Equations for the evaluation of the process efficiency determined by the heat pump
conditions and the CO2 properties were given. The method distinguishes between the
possible process efficiency and the process losses and allows significant factors
affecting process losses to be identified.
Neksa (1994) identified the fundamental advantages of a transcritical heat pump for
water heating applications. The study compared the efficiency and the costs of a
transcritical carbon dioxide heat pump process for water heating with corresponding
conventional CFC-12 and HCFC-143a processes. In both processes, conventional and
Chapter 2 Literature Review
losses are caused by the expansion valve in the transcritical process but the losses are less significance on the overall process efficiency than for the conventional process. The investment cost was theoretically estimated to be about the same for both systems, with higher compressor costs but lower heat exchanger costs for the transcritical system.
In theoretical cycle evaluations CO2 can not compete with conventional refrigerants such as CFC-12, HCFC-22 or HFC-134a. Pettersen (1995) calculated the theoretical coefficient of performance (COP) of carbon dioxide operating in a simple E-P cycle to be less than 75% of that for CFC-12.
Practically, the efficiency losses of the refrigerant process are smaller than in a
conventional system and the transcritical CO2 process achieves superior efficiency in
applications with limited heat sink, low heat sink inlet temperature, high temperature
glide of the heated medium and an unlimited heat source. The real advantages of such
an application is the close match between the refrigerant temperature and the heat sink
temperature in the gas cooler, and the possibility of gas being cooled close to heat sink
temperatures leading to highly efficient heat transfer and reduced heat losses.
Disadvantageous is the rapid loss of efficiency at increasing heat sink inlet temperatures. Because of the high throttling losses, the process is not suitable for
applications where small temperature glide, low heat sink outlet temperature and/or
high heat sink inlet temperature occur. This may be improved by two stage
compression cycles or by using an expansion device for work recovery (Lorentzen,
1994a, 1994b; Pettersen, 1995; Heyl et al, 1998; Halozan et al, 1994 ).
Besides the thermodynamic advantages in certain applications, carbon dioxide has a number of practical benefits, such as:
• Reduced component size
Chapter 2 Literature Review
• Improved compressor efficiency
The high saturation pressures of CO2 lead to small compressor pressure ratio and
efficient compression. This is in particular favourable since the compressor causes the
biggest energetic losses in every heat pump process (Pettersen and Skaugen, 1994).
• Practical use of refrigerant
Carbon dioxide is gained from the ambient air at low costs, the gas is already widely in
use, necessary infrastructure exists and the handling is simple and well known. The
refrigerant does not have to be recovered from refrigerant systems or recycled
(Pettersen, 1995).
• Compatibility
CO2 has no harmful effect on the ozone layer and its global warming potential is low
compared to the conventional refrigerants so it will not be banned for any
environmental reasons.
The main disadvantage is the availability and the cost of the heat pump components.
However, Halozan and Reiberer (2000) suggested that ultimately the system costs of a
transcritical system are mainly dependent on whether the components, in particular the
compressor, will be mass-produced. At this stage the availability of the components is
certainly a critical factor for the commercial applications.
2.2.4.5 Heat pump performance modelling
Simulation of the transcritical heat pump process, the appropriate control strategy and
the performance of the individual components, in particular of the gas cooler, require a
steady-state mathematical model. Such a model has been described by Skaugen and
Svensson (1998). The investigation focused on the heat rejection process in the gas
cooler at varying high pressure between 70 and 110 bar and varying water mass flow
rates from 0.13 to 0.23 I/s. The results of the model were in good agreement with the
measured data.
The modelling of an air-conditioning unit based on a carbon dioxide heat pump was
described by Robinson and Groll (2000). The model evaluates the overall cycle
performance as well as the performance of the individual components. The predictions
Chapter 2 Literature Review
refrigerants, however, the verification of the model with experimental CO2 data was not
described.
A carbon dioxide heat pump for simultaneous heating and cooling has been modelled
based on experimental data for a full-scale laboratory prototype by White et al (1999).
The investigation showed that hot water between 65 and 120°C could be produced with
at a moderate reduction of the COP by 33%. Further potential for improvements in the
efficiency by increasing the gas cooler size were suggested.
2.2.5 Applications of carbon dioxide heat pumps
Carbon dioxide heat pumps can perform thermodynamically and/or environmentally
equal or better than conventional heat systems in many applications, such as low
temperature district space heating, air conditioning, drying and dehumidifying
processes and water heating (Lorentzen, 1994a).
2.2.5.1 Air conditioning
Theoretical and experimental investigation of carbon dioxide in air-conditioning
systems have shown that CO2 can compete with a conventional HCFC-22 systems
(Aarlien et al, 1996). Similar studies has been reported by Yin et al (1998), Beaver et al
(1999) and Richter et al (2000). Compared to conventional systems, the carbon dioxide
heat pumps operate at competitive efficiencies with slightly higher efficiency in heating
mode and slightly lower efficiencies in air cooling mode.
Experimental investigations for car air-conditioning have shown that carbon dioxide
performs similarly to a conventional air conditioning system with COP's in the range of
1.5 to 2.5. (Pettersen and Skaugen, 1994; Preissner et al, 2000; Hafner, 2000).
Environmentally, carbon dioxide has a high potential to improve transport heat pump
applications, since this sector has been by far the biggest source of emissions of gases
with high ODP (Pettersen and Skaugen, 1994; Toshia and Kenichi, 1998).
2.2.5.2 Space heating
The development of carbon dioxide heat pumps for space heating in existing buildings
using different heat sources has been reported by Brandes and Kruse (2000). With an
Chapter 2 Literature Review
water source water-to-water heat pump operated with annual COP of approximately
2.3.
Richter et al (2000) compared the performance of a conventional and a carbon dioxide
heat pump for space heating. The carbon dioxide system operated at a slightly lower
COP than the HFC-41 0a system but had a higher capacity at low ambient
temperatures.
Space heating in modern low-energy houses and commercial buildings was
investigated by Rieberer and Halozan (1998, 1999). CO2 heat pumps had potential for
heat recovery and achieved CO P's in the range of 5 to 10, depending on the operation
conditions and the heat source.
2.2.5.3 Drying I dehumidifying
The design and experimental data of an laundry drier, using a transcritical carbon
dioxide heat pump has been presented by Schmidt et al (1998) and Schmidt and
Fredsted (1999). The heat pump dehumidifies the moist airflow from the drying process
and recovers the heat. The performance was similar to a conventional system, and
considerable environmental benefits were also achieved.
2.2.5.4 Water heating
Several transcritical carbon dioxide water heaters using laboratory compressor
prototypes have been developed and described in the literature (e.g. Hwang et al,
1997a; Neksa et al, 1997, Kasper and Halozan, 1997). However, the test rigs have
often been used for investigations into the general characteristics of the transcritical
cycle, the process control or component performance, rather than evaluating the
applications itself.
A prototype air-source 4.5 kW hot water supply unit with a storage tank for domestic
buildings has been described by Hashimoto and Saikawa (1997) and Saikawa and
Hashimoto (1998, 2000). The heat pump uses the Lorentzen refrigerant cycle and a
semi-hermetic scroll compressor. The water temperature was kept constant at 65°C.
The high pressure was controlled at optimum pressure by an electronic expansion