Open Access
Methodology article
A DArT platform for quantitative bulked segregant analysis
Peter Wenzl
1,2, Harsh Raman
3, Junping Wang
3,4, Meixue Zhou
4,
Eric Huttner
1,2and Andrzej Kilian*
1,2Address: 1Diversity Arrays Technology P/L, 1 Wilf Crane Cr., Yarralumla, Canberra ACT 2600, Australia, 2Triticarte P/L, 1 Wilf Crane Cr., Yarralumla, Canberra ACT 2600, Australia, 3NSW Agricultural Genomics Centre and NSW Department of Primary Industries, Wagga Wagga Agricultural Institute, PMB, Wagga Wagga NSW 2650, Australia and 4Tasmanian Institute of Agricultural Research, University of Tasmania, PO Box 46, Kings Meadows TAS 7249, Australia
Email: Peter Wenzl - [email protected]; Harsh Raman - [email protected];
Junping Wang - [email protected]; Meixue Zhou - [email protected]; Eric Huttner - [email protected]; Andrzej Kilian* - [email protected]
* Corresponding author
Abstract
Background: Bulked segregant analysis (BSA) identifies molecular markers associated with a phenotype by screening two DNA pools of phenotypically distinct plants for markers with skewed allele frequencies. In contrast to gel-based markers, hybridization-based markers such as SFP, DArT or SNP generate quantitative allele-frequency estimates. Only DArT, however, combines this advantage with low development and assay costs and the ability to be deployed for any plant species irrespective of its ploidy level. Here we investigate the suitability of DArT for BSA applications using a barley array as an example.
Results: In a first test experiment, we compared two bulks of 40 Steptoe/Morex DH plants with contrasting pubescent leaves (mPub) alleles on chromosome 3H. At optimized levels of experimental replication and marker-selection threshold, the BSA scan identified 433 polymorphic markers. The relative hybridization contrast between bulks accurately reflected the between-bulk difference in the frequency of the mPub allele (r = 0.96). The 'platform noise' of DArT assays, estimated by comparing two identical aliquots of a DNA mixture, was significantly lower than the 'pooling noise' reflecting the binomial sampling variance of the bulking process. The allele-frequency difference on chromosome 3H increased in the vicinity of mPub and peaked at the marker with the smallest distance from mPub (4.6 cM). In a validation experiment with only 20 plants per bulk we identified an aluminum (Al) tolerance locus in a Dayton/Zhepi2 DH population on chromosome 4H with < 0.8 cM precision, the same Al-tolerance locus that had been mapped before in other barley populations.
Conclusion: DArT-BSA identifies genetic loci that influence phenotypic characters in barley with at least 5 cM accuracy and should prove useful as a generic tool for high-throughput, quantitative BSA in plants irrespective of their ploidy level.
Published: 28 June 2007
BMC Genomics 2007, 8:196 doi:10.1186/1471-2164-8-196
Received: 3 April 2007 Accepted: 28 June 2007
This article is available from: http://www.biomedcentral.com/1471-2164/8/196
© 2007 Wenzl et al; licensee BioMed Central Ltd.
Background
Bulked Segregation Analysis (BSA) is a widely used method for rapidly identifying molecular markers linked to a trait of interest. It involves genotyping two pools (bulks) of DNA samples from individual plants originat-ing from an experimental cross. Plants are assigned to one of the two bulks based on the trait of interest. The bulks are screened with a large number of markers to identify those that distinguish the bulks and, by inference, must be genetically linked to the trait locus [1].
The success of the BSA approach relies on the dramatic reduction in the number of marker assays when compared to building a genetic map for the purpose of identifying markers associated with a phenotype. BSA 'collapses' the two-dimensional matrix of marker assays (DNA samples × markers) into a one-dimensional vector of genotypic differences between two DNA bulks. With gel-based marker technologies this vector is largely built up sequen-tially. Highly multiplexed, hybridization-based marker technologies such as SFP, DArT and SNP have the poten-tial to further 'collapse' the vector of genotypic differences between bulks into a single (perhaps replicated) whole-genome assay [2-5].
Application of hybridization-based marker technologies to BSA not only reduces the genotyping effort, but has the additional benefit of producing quantitative raw data (hybridization intensities) which are only subsequently converted into discrete genotypes (allele calls) in the case of non-BSA applications. The raw hybridization data are a quantitative measure of allele frequencies [6-8] and thus should increase the accuracy of mapping a trait locus with BSA. Others have used this feature when performing BSA experiments using SFP typed on Affymetrix GeneChips [9,10].
While SFP are a powerful research tool for species with sufficient sequence information, their utility in the con-text of agricultural research and (pre)breeding appears to be fairly limited, not only because of technology-estab-lishment and per-sample assay costs but also because polyploidy poses a serious barrier to any whole-genome hybridization approach. Polyploidy and the costs of tech-nology establishment for new species are also limiting the widespread deployment of SNP among the approximately 150 crop species cultivated worldwide, many of which have large and/or polyploid genomes [11,12]. By contrast DArT arrays, already available for two dozens of plant and fungal species [4,13-18], can be rapidly developed for new species of any ploidy level for a small fraction of the investment required for SFP or SNP arrays [19].
In this paper we investigate the suitability of the DArT platform for BSA, using as an example a
polymorphism-enriched barley array with 2,304 clones [20]. We first test 'DArT-BSA' using a DH population that segregates for a morphological marker with known map position (our model target trait). In this experiment we explore several technology features that are likely to be critical for routine deployment of DArT-BSA. In a subsequent validation experiment we deploy the optimized method to a differ-ent DH population segregating for Al tolerance to test the performance of DArT-BSA in a practical application.
Results and discussion
Test experimentThe Steptoe/Morex DH population segregates for 'pubes-cent leaf blades' (mPub), a morphological marker that has been incorporated into the genetic map of chromosome 3H in this population [21]. We used mPub to assemble contrasting bulks for a trait with known genetic location in order to evaluate the performance of DArT when applied to BSA. The bulks were compared by simultane-ously assaying them on the same DArT array (replicated up to eight times) and measuring the contrast of hybridi-zation intensity for markers that were identified as poly-morphic in a comparison between the two parents on separate replicated arrays.
Selection of polymorphic markers
Markers differentiating between Steptoe and Morex were selected based on the contrast in hybridization intensity between the two cultivars (log2 [cy3/cy5]). Instead of applying an arbitrary threshold we measured the variabil-ity of hybridization-contrast estimates by comparing two identical aliquots of a 1:1 mixture of the two parents ('self comparison'). Polymorphic markers were then selected by applying to the hybridization contrast between the par-ents a normal distribution-based probability threshold derived from the self comparison.
Experimental replicates
We next tested the effect of varying the number of repli-cate arrays between two and eight. Increasing the degree of replication resulted in the inclusion of markers that were previously not mapped, in part because the hybridization contrast between the parental alleles was small (Table 1) [20]. Only a small minority of the additional markers, however, were outliers with respect to a Loess curve in a plot of the relative hybridization contrast vs. map position (see section entitled Genome-wide linkage scan below for an example). This result suggests that most of these markers were still genetically informative. A high degree of experi-mental replication seems to improve the precision of quantifying markers with a smaller hybridization contrast between the parental alleles, thus resulting in the inclu-sion of more markers in a BSA scan. We considered four experimental replicates adequate for the purpose of this study.
Quantification of the allele-frequency difference between bulks
The contrast in hybridization intensity between the two allelic states varies from marker to marker and has to be taken into account when quantifying allele abundances in DNA pools. The log2 [cy3/cy5] values measured for poly-morphic markers in the bulk comparison were therefore scaled by division by the log2 [cy3/cy5] values measured in the comparison between the parents.
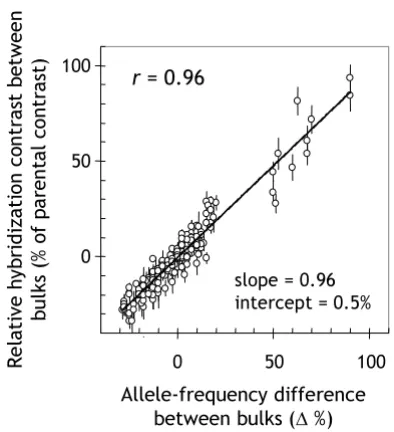
To link the scaled or relative hybridization contrast of a marker to the allelic composition of the bulks, we com-puted from the segregation data of a Steptoe/Morex DArT map the frequency of the Steptoe allele in each bulk (see section entitled 'Allele-frequency determination and sim-ulation' in Materials and Methods). The difference between the Steptoe allele frequencies in the two bulks was closely correlated to the relative hybridization con-trast (r = 0.96; Figure 1). The degree of correlation was identical to the correlation obtained in other studies using the Affymetrix SNP genotyping platform [7,8]. This result confirms that hybridization intensities are proportional to the abundance of DArT alleles in DNA pools. The relative hybridization contrast, therefore, can be used as a meas-ure of the between-bulk difference in the frequency of the allele from the trait-donor parent.
It follows from this data that previously identified limita-tions of dominant markers for BSA with certain popula-tion types [22] do not apply to DArT-BSA, although in a non-BSA context DArT markers are typically scored in a dominant manner [13]. Any type of population that seg-regates for a trait of interest should be amenable to DArT-BSA; be it DH, RIL, BC, F2 or more complex populations.
Linkage-detection threshold derived from 'platform noise'
Before scanning the genome for markers linked to mPub
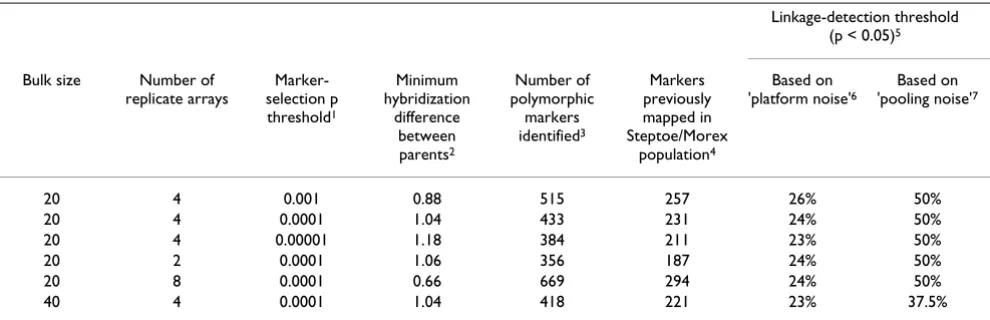
we quantified the basal 'platform noise' to obtain a signif-Table 1: Effect of experimental settings on polymorphic-marker selection and linkage-detection thresholds in the mPub BSA scan
Linkage-detection threshold (p < 0.05)5
Bulk size Number of replicate arrays
Marker-selection p threshold1
Minimum hybridization
difference between parents2
Number of polymorphic
markers identified3
Markers previously mapped in Steptoe/Morex
population4
Based on 'platform noise'6
Based on 'pooling noise'7
20 4 0.001 0.88 515 257 26% 50%
20 4 0.0001 1.04 433 231 24% 50%
20 4 0.00001 1.18 384 211 23% 50%
20 2 0.0001 1.06 356 187 24% 50%
20 8 0.0001 0.66 669 294 24% 50%
40 4 0.0001 1.04 418 221 23% 37.5%
1A normal distribution-based threshold for log2 [cy3/cy5] derived from the comparison of two identical aliquots of a 1:1 mixture of the Steptoe and
Morex parents.
2log2 [cy3/cy5]
3Markers were selected from the set of 2,304 polymorphism-enriched clones (see section entitled 'DArT assays' in Materials and Methods). 4DArT markers were mapped on an array containing a partly overlapping set of markers.
5Values are based on the dispersion of the relative hybridization contrast (log2 [cy3/cy5] as a percentage of log2 [cy3/cy5] measured in the parental
comparison) or the allele-frequency difference. There was a 1:1 correspondence between the two (Figure 1).
6This significance threshold reflects the variability inherent in the array-hybridization process. It was derived from the dispersion of the relative
hybridization contrast in a 'self' comparison between two identical aliquots of 1:1 mixture of Steptoe and Morex (= ratio between log2 [cy3/cy5] in the self and the parental comparison). The resulting significance threshold was Bonferroni-adjusted for multiple comparisons.
7 This significance threshold reflects the chance that a non-zero allele-frequency difference may occur by chance as a result of the random
[image:3.612.60.555.100.260.2]icance threshold for detecting linkage. The dispersion of the apparent allele-frequency difference in a comparison between two identical aliquots of a 1:1 mixture of the par-ents was used to derive a genome-wide significance threshold (Table 1). The size of this threshold was a func-tion of the extent to which markers with limited hybridi-zation contrast between alternative alleles were incorporated in the analysis (Table 1), because the disper-sion of allele-frequency estimates was larger for less well-separated markers (Additional File 1). More experimental replicates kept the threshold low even if poorly separated markers were included (Table 1).
Linkage-detection threshold derived from 'pooling noise'
Besides quantifying the effect of platform-related noise, it is important to consider the expected variability caused by binomial sampling in the bulking process. As a result of the random assortment of chromosomes, the between-bulk difference in allele frequency may deviate from zero
for markers that are not linked to the target locus, thus generating spurious linkage signals.
We established a genome-wide significance threshold by simulating the comparison of random bulks (see Materials and Methods for details). With increasing bulk sizes, the threshold asymptotically drops toward 0% allele-fre-quency difference (Figure 2). At 40 plants per bulk, for example, there is a 5% probability of detecting, by chance only, at least one genomic region with an allele-frequency difference greater than 37.5% (Table 1). The thresholds reported in Figure 2 are specific to the number of chromo-somes and the type of population used in this study. For species with more chromosomes, for example, larger bulk sizes are required to achieve comparable thresholds (data not presented).
Genome-wide linkage scan
A plot of the allele-frequency difference between mPub
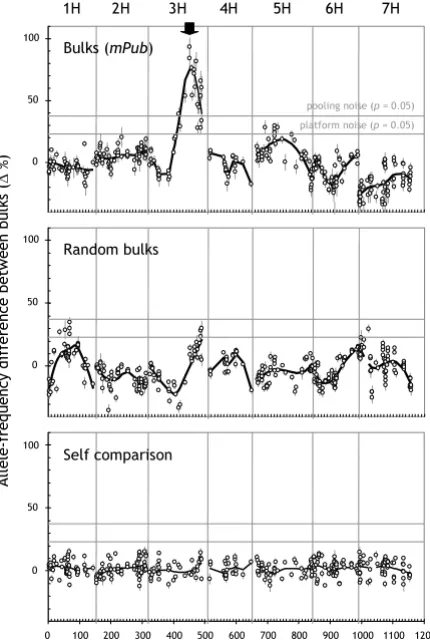
bulks (40 plants each) vs. the chromosomal positions of the markers on a DArT consensus map [20] immediately confirmed that mPub was located on the long arm of chro-mosome 3H (Figure 3, top panel) [21]. The marker with the maximum allele-frequency difference (93.5%) was bPb-8978. A Steptoe/Morex map for chromosome 3H, built from markers overlapping between this and a
[image:4.612.78.275.100.316.2]previ-'Pooling noise': the effect of bulk sizes on the amplitude of spurious linkage signals
Figure 2
'Pooling noise': the effect of bulk sizes on the ampli-tude of spurious linkage signals. Genome-wide signifi-cance thresholds for detecting spurious linkage between a marker and a target locus were derived from 10,000 simu-lated comparisons between bulks of F1-derived DH barley plants (see section entitled 'Allele-frequency determination and simulation' in Materials and Methods for details). Trait-linked markers should only be considered as statistically sig-nificant if the allele-frequency difference between bulks is superior to the value derived for the relevant combination of bulk size and desired probability level.
0 10 20 30 40 50 60 70 80 90 100
0 50 100 150
Number of plants per bulk
Th
re
sho
ld o
f allele
-fr
e
qu
en
cy
d
if
fer
en
ce
b
e
tw
ee
n b
ul
ks
(
Δ
%)
p= 0.05
p= 0.01
p= 0.001 Quantitative precision of DArT-BSA
Figure 1
Quantitative precision of DArT-BSA. For each marker, there is a 1:1 relationship between the relative hybridization contrast (= log2 [cy3/cy5] between bulks as a percentage of
log2 [cy3/cy5] between parents) and the allele-frequency
dif-ference between the bulks. This relationship makes interpre-tation of experimental results straightforward. The plot is based on a comparison of mPub bulks (size = 40), prepared from genomic representations of individual Steptoe/Morex DH plants (see corresponding genome scan in Figure 3). It includes all markers present in a previously published Step-toe/Morex DArT map [20] and reports the difference in the frequency of Steptoe alleles between bulks.
slope = 0.96 intercept = 0.5%
Allele-frequency difference between bulks (Δ%)
Re
la
ti
ve
hy
br
id
iz
at
io
n
c
on
tr
ast
b
et
w
ee
n
bulk
s (%
of
p
are
nt
al c
ontr
ast) r= 0.96
0 50 100
ous study [20], confirmed that bPb-8978 was the closest marker to mPub at 4.6 cM distance. The Loess curve also peaked at this marker. These results underscore the map-ping accuracy of DArT-BSA.
The mPub linkage signal was highly significant, peaking well beyond both the 'pooling noise' and the 'platform noise' threshold (Figure 3, top panel). A comparison of two randomly assembled bulks of 40 plants (Figure 3, middle panel) showed that bulks were not large enough to decrease the random fluctuations in allele frequencies to a level comparable to the apparent fluctuations caused by the baseline noise of the DArT platform (Figure 3 bot-tom panel). The SD of the allele-frequency difference was 12.0% in the random-bulk comparison, 12.5% in the
mPub-bulk comparison (all chromosomes except 3H), but only 5.9% in the self comparison.
We conclude from this data that in the case of barley, it would be beneficial to bulk up to 150 DH plants for DArT-BSA. At this bulk size the extent of random fluctua-tions in allele frequencies introduced in the pooling proc-ess (Figure 2) become comparable to the approximate 'platform noise' of DArT-BSA (24% at p < 0.05 in the test experiment, but only 17% in the subsequent validation experiment).
Linkage decay in the vicinity of the target locus
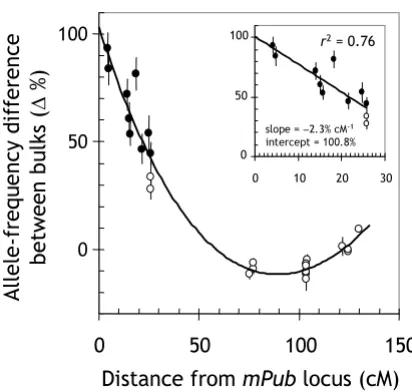
The 'linkage signal' decayed as the distance between mark-ers and the target locus increased (Figure 4). A linear-regression analysis using markers within ± 30 cM of mPub
indicated a 2.3% decrease per cM distance from the target locus (see inset in Figure 4). It is therefore possible to esti-mate the approxiesti-mate cM distance of DArT markers from the target locus based on the following formula: cM dis-tance ≈ 0.43 × % allele-frequency difference – 43. This relationship could be useful for analyzing populations derived from genetically close parents. In such situations, lower marker densities are expected and the approximate position of the target locus could be estimated from mod-erately linked markers based on this relationship.
Gel-based markers (RAPD, AFLP and SSR) compromise the efficiency and precision of BSA by generating discrete allelic data in a somewhat arbitrary and hence error-prone process (i.e., alleles are called 'present' or 'absent'). The latter is problematic in situations where the bulks contain different proportion of both parental alleles, for example in case of less than perfectly linked makers or for QTL with moderate effects. The ability of DArT-BSA to quantify the degree of linkage between markers and a target locus is a clear advantage in such cases.
[image:5.612.66.281.99.419.2]DArT-BSA genome scan for the 'pubescent leaves' (mPub) locus in the Steptoe/Morex DH population
Figure 3
DArT-BSA genome scan for the 'pubescent leaves' (mPub) locus in the Steptoe/Morex DH population. The difference in the frequency of Steptoe alleles between different pairs of DNA pools is shown as a function of the cM positions of markers previously incorporated into a DArT consensus map for barley (375 of 418 polymorphic markers) [20]. The 'Bulks (mPub)' panel displays data from the com-parison between bulks contrasting for the mPub locus on chromosome 3H (40 plants each). The black arrow indicates the position of the mPub locus on the DArT consensus map [20] according to which the DH plants had been distributed into bulks. The 'Random bulks' panel displays data from a comparison of two randomly assorted bulks of 40 plants each. The 'Self comparison' panel shows the result of a comparison of two identical aliquots of a 1:1 mixture of Step-toe and Morex. Vertical lines within each of the panels denote borders between individual chromosomes. Horizon-tal lines indicate two types of significance thresholds. The 'pooling noise' significance threshold was based on a simula-tion of the bulking process (see Figure 2). The 'platform noise' significance threshold was derived from an analysis of the distribution of values in the self comparison (bottom panel) and Bonferroni-adjusted for multiple comparisons (see section entitled 'Polymorphic marker identification' in Materi-als and Methods).
0 50 100
0 50 100
0 50 100
0 100 200 300 400 500 600 700 800 900 1000 1100 1200
Genome position (cumulative cM)
A
lle
le-frequency
di
ff
er
e
nc
e bet
w
een
bulks
(
Δ
%)
1H 2H 3H 4H 5H 6H 7H
Bulks (mPub)
Random bulks
Self comparison
Marker density
The mPub genome scan comprised 433 polymorphic
markers (Table 1), that is, approximately one marker every 2.7 cM. This resolution is lower than the resolution afforded by the Arabidopsis SFP array [9,23]. However, SFP hybridization data tend to be quite variable, which makes a high marker density an important prerequisite for calcu-lating robust allele-frequency difference estimates for genomic regions. More importantly, the precision with which a target locus can be mapped by BSA not only depends on the marker density but also on the number of crossover in the vicinity of the target locus. In experimen-tal populations that are the result of a limited number of meioses the 'linkage peaks' will simply be too broad to make effective use of more than approximately 500 to 1,000 markers.
Validation experiment
Having established that DArT-BSA accurately identifies the known genomic location of a model trait, we contin-ued to validate the method by attempting to map an Al-tolerance locus in a Dayton/Zhepi2 DH population (Wang et al., submitted). For this purpose we 'relaxed' the conditions of analysis in two ways to accommodate more typical experimental designs. First, we pooled
genomic-DNA samples (for a comparison against pooled genomic representations). Second, we only pooled 20 plants per bulk, not an uncommon bulk size in this sort of experi-ments.
Genomic-DNA samples can be bulked directly
Because DArT-BSA compares the abundance of alternative alleles between bulks in a quantitative manner (Figure 1), it is important to make sure that individual plants contrib-ute equally to bulks, particularly when working with small bulk sizes. Presumably, the most robust way to achieve this is to bulk representations derived from individual samples of genomic DNA. Direct bulking of genomic-DNA samples, however, produces virtually identical esti-mates of allele-frequency differences (r = 0.91; Additional File 2). It may well be tolerable to bulk equal amounts of plant material before DNA extraction, although we did not test this method experimentally.
DArT-BSA identifies an Al-tolerance locus on chromosome 4H
The DArT-BSA scan for Al tolerance in the Dayton/Zhepi2 population revealed a highly significant peak on chromo-some 4H, despite the elevated 'pooling-noise' threshold (50%; p < 0.05) due to the small bulk sizes used (Figure 5). The position of the peak is consistent with the location of an Al-tolerance locus (Alt) on 4HL, which appears to mediate Al-activated citrate secretion from roots, and has already been identified in several barley populations [24-30].
The Alt locus was previously mapped between SSR mark-ers Bmag490 on the proximal side and HVM68 on the dis-tal side [29,30]. These two SSR markers have also been incorporated into a DArT linkage map of the Dayton/ Zhepi2 population where they span a small 0.8-cM region (see Additional File 2 in [20]). The marker that showed the greatest allele-frequency difference in the DArT-BSA scan (101.7%; bPb-6872) co-segregated with Bmag490, which implies that it must have been closer than 0.8 cM from the Alt locus. The Loess curve peaked another 4.2 cM proximal of the Bmag490/bPb-6872 locus (Figure 5).
These results are consistent with the performance of DArT-BSA in the Steptoe/Morex model experiment conducted under technically more stringent experimental conditions (Figure 3). In both experiments the position of the target locus was mapped with at least 5 cM precision. A third experiment not reported here identified markers linked to a disease-resistance locus that was subsequently con-firmed by conventional linkage analysis.
Conclusion
Given that DArT arrays are already available for two doz-ens of plant and fungal species [4,13-18] and can be rap-idly developed for new species of any ploidy level with
[image:6.612.72.278.94.290.2]Decay of linkage as a function of the genetic distance between markers and a trait locus
Figure 4
Decay of linkage as a function of the genetic distance between markers and a trait locus. The measured allele-frequency difference between two bulks (40 plants each) was plotted against the cM distance between chromosome-3H markers and the mPub locus. The inset displays a linear regression of the allele-frequency difference for markers within ± 30 cM from mPub on the cM distance from mPub. Black data points are significantly linked to mPub at the p < 0.05 level for 'pooling noise' (see Figure 2).
0 50 100 150
Distance from
mPub
locus (cM)
050 100
Allele-fr
e
q
u
e
n
cy
di
ff
e
rence
b
e
tw
een b
u
lks
(
Δ
%)
0 50 100
0 10 20 30
r2= 0.76
slope = −2.3% cM-1
limited resources [19], we extrapolate from the results of this study that DArT should prove useful as a generic plat-form for quantitative BSA in plants. DArT markers in established arrays for a number of important crops are being sequenced, thus providing instant access to sequence anchor(s) for any DArT-BSA-tagged character when sufficient genomic resources become available in the future.
Methods
Populations and targeted traits
Two DH populations derived from the F1 of bi-parental crosses between barley cultivars were used for this study. The Steptoe/Morex population segregated for the mor-phological marker 'pubescent leaf blades' (mPub) [21]. The Dayton/Zhepi2 population segregated for Al toler-ance (Wang et al., submitted). DNA was prepared from individual plants using a CTAB method [31,32].
Bulks
Individual DH plants derived from the Steptoe/Morex cross were classified as 'pubescent' and 'hairless' according to their mPub allele [33] and assigned to two pairs of con-trasting bulks (20 or 40 plants each). The DH progeny from the Dayton/Zhepi2 cross was assessed for Al toler-ance using a nutrient solution-culture method [26]. The roots were exposed to 15 μM of Al for 3 days and stained
with 0.1% (w/v) eriochrome cyanine R. The seedlings were then visually scored as 'sensitive' or 'tolerant' as described previously [29] and assigned to one of two con-trasting bulks of 20 plants each.
'Representation bulks' were prepared by mixing the genomic representations prepared from individual genomic DNA samples (see section entitled DArT assays
below). 'Genomic bulks' were prepared by mixing the genomic DNA samples (~1 μg each) themselves (Dayton/ Zhepi2 population only).
Experimental design
A BSA experiment typically comprised four comparisons between individual DNA samples or DNA pools. First, phenotypically contrasting bulks (either of the 'genomic' or the 'representation' type) were compared by simultane-ously assaying them on the same DArT array. Second, rep-resentations prepared from the two parents were compared on a separate array. Third, a pair of 'representa-tion bulks' derived from two randomly assorted DNA pools ('random bulks') were assayed on another array to evaluate the impact of stochastic effects associated with bulking. Fourth, two identical aliquots of a 1:1 mixture of the two parents ('parent mixture') were compared against each other to quantify the platform (technical) noise of the DArT assays. Each pair of samples ('genomic bulks', 'representation bulks', 'parents', 'random bulks', 'parent mixture') was independently analyzed up to eight times on separate arrays. Half of these replicate assays were per-formed by swapping the cy3 and cy5 fluorescent dyes used to label the representation pairs compared against each other (see next section).
DArT assays
PstI/BstNI representations of genomic DNA samples (from individual plants or 'genomic bulks') were prepared as described previously [4]. The representations produced from individual DNA samples were either bulked accord-ing to mPub or Al tolerance ('representation bulks') or pooled randomly ('random bulks'). All representations and 'representation bulks' were purified, labeled with cy3 or cy5 and hybridized to DArT arrays together with the FAM-label polylinker of the vector that had been used to clone the fragments printed on the arrays [3,14]. The DArT arrays contained 48 sub-arrays with 2,304 polymor-phism-enriched clones printed in duplicate and 384 con-trol clones, each printed six times (6,912 array features in total) [20]. The arrays had been printed with a MicroGrid II arrayer (Biorobotics, Cambridge, UK) on SuperChip poly-L-lysine slides (Erie Microarray, Portsmouth NH, USA) using DArT-spotter, a thoroughly optimized buffer for heavy-duty microarray printing (Wenzl et al. in prepa-ration). After an overnight hybridization at 62°C, the arrays were washed and scanned with 10-μm resolution at
[image:7.612.63.288.88.215.2]DArT-BSA genome scan for Al tolerance in the Dayton/ Zhepi2 DH population
Figure 5
DArT-BSA genome scan for Al tolerance in the Day-ton/Zhepi2 DH population. The difference in the fre-quency of the Dayton allele between two bulks with contrasting Al tolerance (20 plants each) is shown as a func-tion of the cM posifunc-tions of markers previously incorporated into a DArT consensus map for barley (446 of 490 polymor-phic markers) [20]. The vertical lines within the panel denote borders between individual chromosomes. Horizontal lines indicate the 'pooling noise' and 'platform noise' significance thresholds as defined in Figure 3, using Dayton and Zhepi2 instead of Steptoe and Morex. The black arrow indicates the approximate position of the Alt locus which was identified in other populations as the principal locus conferring Al resist-ance in barley [24–30].
Genome position (cumulative cM)
Allele-freq
u
e
nc
y differe
nc
e
betw
ee
n b
u
lk
s (
Δ
%)
1H 2H 3H 4H 5H 6H 7H
0 50 100
0 100 200 300 400 500 600 700 800 900 1000 1100 1200 pooling noise (p= 0.05)
543 nm (cy3), 633 nm (cy5) and 488 nM (FAM) on a LS300 confocal laser scanner (Tecan, Grödig, Austria) [3,14].
Array-data analysis
Array images were analyzed with DArTsoft 7.4 (Diversity Arrays Technology P/L, Canberra, Australia). The program automatically recognized array features using a seeded-region-growth algorithm and reported, for each fluores-cent channel, the average and SD of pixel intensities within and around each array feature, the fraction of satu-rated pixels within each feature and the number of pixels of each feature, amongst other parameters (Cayla et al. in preparation). The logarithm of the ratio between the two background-subtracted averages of feature pixels in the cy3 and the cy5 channel (log2 [cy3/cy5]) was used as a measure of the difference in abundance of the corre-sponding DNA fragment in the two representations hybridized to an array. The log2 [cy3/FAM] and log2 [cy5/ FAM] values, approximate measures of the amount of hybridization signal per amount of DNA spotted on the array, were used for quality-control purposes (see next sec-tion).
Whole array quality-filtering
Arrays were rejected if the average correlation of either the log2 [cy3/FAM] or log2 [cy5/FAM] values of non-polymor-phic clones (as identified below) with the corresponding values from all other arrays in an experiment was smaller than 0.9. One out of 68 arrays (1.5%) was removed this way.
Array feature quality-filtering
Some array features hybridized weakly in both fluorescent channels, either because of an insufficient amount of DNA printed on the array or because the corresponding DNA fragments were not captured in the genomic repre-sentation of either parent. Therefore, features with signal-to-noise ratios (the background-subtracted average of fea-ture pixels divided by the SD of local-background pixels) below 5 in both fluorescent channels were removed from further analysis. The remaining features were accepted if the coefficient of variation of their pixel intensities was smaller than 70% in at least one of the two channels, if less then 20% of feature pixels were saturated in both channels, if the SD of background pixels was smaller than 5 times the array median in both channels, and if their size (pixel number) was at least 30% of the array median. Overall, this quality-filtering procedure removed 12.3 ± 0.7% of all array features (mean ± SD across all experi-ments).
Hybridization-intensity normalization and averaging
The SD of the central 90% of all log2 [cy3/cy5] feature val-ues on an array was scaled to the average SD of the group
of arrays hybridized to the same type of DNA samples or pools. The average of the central 90% of all features on each array was adjusted to zero. Subsequently, the nor-malized/scaled log2 [cy3/cy5] values of replicate features (both within and across arrays hybridized with identical sample pairs) were averaged to obtain clone values (val-ues derived from dye-swap arrays were multiplied by -1). For clones with at least 6 remaining replicate features, only the central 66% of values were averaged. Clones with less than 25% of replicate features left and the 3% of clones with the highest across-replicate-feature SD of log2 [cy3/cy5] were removed from further analysis. In this manner the best 92.9 ± 0.1% of all clones on the array were selected as potential markers for BSA analysis (mean ± SD across all experiments).
Polymorphic marker identification
Polymorphic clones (markers) were selected from the set of quality-filtered clones, using a two-tiered approach. In step one, a normal distribution-based significance thresh-old for log2 [cy3/cy5] clone values was established (typi-cally at p < 0.0001) to detect outliers in the comparison between two aliquots of the parent mixture. Polymorphic markers were identified in the comparison between the parents based on this log2 [cy3/cy5] threshold, after it was adjusted by the ratio of the mean between-replicate-fea-ture SD in the two types of comparisons. Potentially unstable polymorphic clones were identified by searching for polymorphic clones that were present in the tails of the log2 [cy3/cy5] distribution in the comparison between two aliquots of the parent mixture (p < 0.05). They were excluded from further analysis.
For step two, the log2 [cy3/cy5] values obtained in the 'representation/genomic bulks', 'random bulks' and 'par-ent mixture' comparisons were referenced against (divided by) the corresponding values measured in the comparison between parents. Ratios between two groups of log2 [cy3/cy5] values (derived from replicated array fea-tures) were computed using weighted jackknifing [34]. The resulting values for relative hybridization contrast (i.e., the hybridization contrast as a percentage of the con-trast between the parents) were accepted if their standard error was smaller than 10%. The values obtained in the comparison of two aliquots of the parents mixture were screened for outliers using a normal distribution-based significance threshold of p = 0.05. Outlier markers were excluded.
Allele-frequency determination and simulation
bulks of 40 plants was calculated from the segregation data after inferring missing data and removing likely gen-otyping errors (see section entitled Distance of DArT mark-ers from mPub below).
The probability of detecting spurious linkages when ana-lyzing bulks of limited size was estimated by evaluating the distribution of the maximum difference in allele fre-quency in 10,000 comparisons between random bulks consisting of varying numbers of simulated barley DH genotypes (10, 20, 40 and 80). The latter were generated by randomly seeding seven chromosome telomeres with one of the two parental alleles, followed by propagating the seeded genotypes along 59 additional chromosomal loci based on a Markov chain with a constant 3% transi-tion probability (i.e., assuming 60 equidistant loci on 7 chromosomes of approximately 180 cM length each).
Marker positions on linkage maps Distance of DArT markers from mPub
Segregation data of DArT markers previously mapped to chromosome 3H in the Steptoe/Morex population were combined with the segregation pattern of mPub [20,33]. The 3H map was then re-optimized using the RECORD algorithm [35] and missing data were inferred from neighboring markers. Potential genotyping errors were identified as described previously [36] (LODerror > 4) and replaced with missing data (< 0.2% of allele calls). Map distances between mPub and all other markers on chro-mosome 3H were then computed by adding Kosambi cM distances between adjacent markers.
Genome-scan display
The relative contrast in hybridization intensity of a subset of markers that had previously been incorporated into a DArT consensus map for barley [20] were plotted against the markers' positions in the barley genome. A Loess curve was fitted to each of the chromosomes to visualize changes in allele frequency across chromosomes.
List of abbreviations
AFLP, amplified fragment length polymorphism; Al, alu-minum; Alt, aluminum-tolerance locus; BC, backcross; BSA, bulked segregant analysis; CTAB, cetyl trimetyl ammonium bromide; DArT, diversity arrays technology; DH, doubled haploid; FAM, 5,6-carboxy-fluorescein; LODerror, logarithm of odds value for genotyping error; Loess, locally-weighted scatterplot smoothing; mPub, pubescent leaf blades locus; QTL, quantitative trait locus/ loci; RAPD, random amplified polymorphic DNA; RIL, recombinant inbred line(s); SD, standard deviation; SFP, single feature polymorphism; SNP, single nucleotide pol-ymorphism; SSR, simple sequence repeat
Authors' contributions
PW designed and performed the DArT-BSA assays, ana-lyzed the data and drafted the manuscript. HR performed some Al-tolerance bioassays and supervised molecular and physiological work on the Dayton/Zhepi2 popula-tion. JW isolated DNA of the Dayton/Zhepi2 population, performed the Al-tolerance bioassays and assembled the Al-tolerant and sensitive bulks. MZ provided the Dayton/ Zhepi2 DH population. EH provided ongoing intellectual input to the design and development of the barley DArT array and edited the manuscript. AK provided overall guidance during the development of DArT for barley, including its deployment in BSA and co-designed and edited the manuscript. All authors read and approved the final manuscript.
Additional material
Acknowledgements
We thank the Australian Grains Research and Development Corporation (GRDC) for ongoing financial support and the Value Added Wheat Coop-erative Research Centre (VAWCRC) for their commitment to our Triti-carte P/L partnership.
References
1. Michelmore RW, Paran I, Kesseli RV: Identification of markers linked to disease-resistance genes by bulked segregant anal-ysis: a rapid method to detect markers in specific genomic regions by using segregating populations. Proc Natl Acad Sci USA
1991, 88:9828-9832.
2. West MA, van Leeuwen H, Kozik A, Kliebenstein DJ, Doerge RW, St Clair DA, Michelmore RW: High-density haplotyping with microarray-based expression and single feature polymor-phism markers in Arabidopsis. Genome Res 2006, 16:787-895.
Additional File 1
Influence of the hybridization contrast between parental alleles on the precision of estimating allele-frequency equality. PDF file with a chart displaying the relationship between the apparent allele-frequency differ-ences, measured by comparing two identical aliquots of a 1:1 mixture of Steptoe and Morex, and the hybridization contrasts between alternative alleles. All markers present in a Steptoe/Morex DArT map [20] were included in this figure. The SD of groups of markers in allelic-contrast bins of 0.5 units on the log2 [cy3/cy5] scale are included.
Click here for file
[http://www.biomedcentral.com/content/supplementary/1471-2164-8-196-S1.pdf]
Additional File 2
Comparison between two bulking strategies. PDF file with a chart dis-playing, for each of 490 markers, the difference of the Dayton allele fre-quency between Al-tolerant and Al-sensitive bulks of 20 Dayton/Zhepi2 DH plants (Δ %), measured using two alternative methods: (1) by pool-ing representations prepared from individual DNA samples (horizontal axis), and (2) by preparing two representations from genomic-DNA pools. The dotted line denotes equality between the two alternative methods. Click here for file
Publish with BioMed Central and every scientist can read your work free of charge "BioMed Central will be the most significant development for disseminating the results of biomedical researc h in our lifetime."
Sir Paul Nurse, Cancer Research UK
Your research papers will be:
available free of charge to the entire biomedical community
peer reviewed and published immediately upon acceptance
cited in PubMed and archived on PubMed Central
yours — you keep the copyright
Submit your manuscript here:
http://www.biomedcentral.com/info/publishing_adv.asp
BioMedcentral
3. Jaccoud D, Peng K, Feinstein D, Kilian A: Diversity Arrays: a solid state technology for sequence information independent gen-otyping. Nucl Acids Res 2001, 29:e25.
4. Wenzl P, Carling J, Kudrna D, Jaccoud D, Huttner E, Kleinhofs A, Kil-ian A: Diversity arrays technology (DArT) for whole-genome profiling of barley. Proc Natl Acad Sci USA 2004, 101:9915-9920. 5. Fan JB, Chee MS, Gunderson KL: Highly parallel genomic assays.
Nat Rev Genet 2006, 7:632-644.
6. Meaburn E, Butcher LM, Schalkwyk LC, Plomin R: Genotyping pooled DNA using 100 K SNP microarrays: a step towards genomewide association scans. Nucleic Acids Res 2006, 34:e28. 7. Kirov G, Nikolov I, Georgieva L, Moskvina V, Owen MJ, O'Donovan
MC: Pooled DNA genotyping an Affymetrix SNP genotyping arrays. BMC Genomics 2006, 7:27.
8. Steer S, Abkevich V, Gutin A, Cordell HJ, Gendall KL, Merriman ME, Rodger RA, Rowley KA, Chapman P, Gow P, Harrison AA, Highton J, Jones PBB, O'Donnell J, Stamp L, Fitzgerald L, Iliev D, Kouzmine A, Tran T, Skolnick MH, Timms KM, Lanchbury JS, Merrima TR: Genomic DNA pooling for whole-genome association scans in complex disease: empirical demonstration of efficacy in rheumatoid arthritis. Genes Immun 2007, 8:57-68.
9. Wolyn D, Borevitz J, Loudet O, Schwartz C, Maloof J, Ecker J, Berry C, Chory J: Light Response QTL Identified with Composite Interval and eXtreme Array Mapping in Arabidopsis thaliana.
Genetics 2004, 167:907-917.
10. Brauer MJ, Christianson CM, Pai DA, Dunham MJ: Mapping novel traits by array-assisted bulk segregant analysis in
Saccharo-myces cerevisiae. Genetics 2006, 173:1813-1816.
11. Udall JA, Wendel JF: Polyploidy and crop improvement. Crop Sci
2006, 46:3-14.
12. The Global Crop Diversity Trust [http://www.croptrust.org] 13. Kilian A, Huttner E, Wenzl P, Jaccoud D, Carling J, Caig V, Evers M,
Heller-Uszynska , Cayla C, Patarapuwadol S, Xia L, Yang S, Thomson B: The fast and the cheap: SNP and DArT-based whole genome profiling for crop improvement. In In the Wake of the Double Helix: From the Green Revolution to the Gene Revolution Edited by: Tuberosa R, Phillips RL, Gale M. Bologna, Italy: Avenue media; 2005:443-461.
14. Akbari M, Wenzl P, Vanessa C, Carling J, Xia L, Yang S, Uszynski G, Mohler V, Lehmensiek A, Kuchel H, Hayden MJ, Howes N, Sharp P, Rathmell B, Vaughan P, Huttner E, Kilian A: Diversity Arrays Tech-nology (DArT) for high-throughput profiling of the hexaploid wheat genome. Theor Appl Genet 2006, 113:1409-1420.
15. Lezar S, Myburg AA, Berger DK, Wingfield MJ, Wingfield BD: Devel-opment and assessment of microarray-based DNA finger-printing in Eucalyptus grandis. Theor Appl Genet 2004, 109:1329-1336.
16. Xia L, Peng K, Yang S, Wenzl P, de Vicente C, Fregene M, Kilian A: DArT for high-throughput genotyping of cassava (Manihot
esculenta) and its wild relatives. Theor Appl Genet 2005,
110:1092-1098.
17. Wittenberg AHJ, van der Lee T, Cayla C, Kilian A, Visser RGF, Schouten HJ: Validation of the high-throughput marker tech-nology DArT using the model plant Arabidopsis thaliana. Mol Genet Genomics 2005, 274:30-39.
18. Yang S, Pang W, Ash G, Harper J, Carling J, Wenzl P, Huttner E, Kilian A: Low level of genetic diversity in cultivated pigeonpea com-pared to its wild relatives is revealed by Diversity Arrays Technology (DArT). Theor Appl Genet 2006, 113:585-595. 19. Official website of Diversity Arrays Technology P/L [http://
www.DiversityArrays.com]
20. Wenzl P, Li H, Carling J, Zhou M, Raman H, Paul E, Hearnden P, Maier C, Xia L, Caig V, Ovesná J, Cakir M, Poulsen D, Wang J, Raman R, Smith KP, Muehlbauer GJ, Chalmers KJ, Kleinhofs A, Huttner E, Kilian A: A high-density consensus map of barley linking DArT markers to SSR, RFLP and STS loci and agricultural traits.
BMC Genomics 2006, 7:206.
21. Kleinhofs A, Kilian A, Saghai Maroof M, Byashev RM, Hayes PM, Chen F, Lapitan N, Fenwick A, Balkes TK, Kanazin V, Ananiev E, Dahleen L, Kudrna D, Bollinger J, Knapp SJ, Liu B, Sorrels M, Heun M, Franck-owiak JD, Hoffman D, Skadsen R, Steffenson BJ: A molecular iso-zyme and morphological map of barley (Hordeum vulgare) genome. Theor Appl Genet 1993, 86:705-71.
22. Mackay IJ, Caligari PDS: Efficiencies of F2 and backcross genera-tions for bulked segregant analysis using dominant markers.
Crop Sci 2000, 40:626-630.
23. Hazen SP, Borevitz JO, Harmon FG, Pruneda-Paz JL, Schultz TF, Yanovsky MJ, Liljegren SJ, Ecker JR, Kay SA: Rapid array mapping of circadian clock and developmental mutations in Arabi-dopsis. Plant Physiol 2005, 138:990-997.
24. Minella E, Sorrells ME: Inheritance and chromosome location of
Alp, a gene controlling aluminium tolerance in 'Dayton' bar-ley. Plant Breeding 1997, 116:465-469.
25. Tang Y, Sorrells ME, Kochian LV, Garvin DF: Identification of RFLP markers linked to the barley aluminium tolerance gene Alp.
Crop Sci 2000, 40:778-782.
26. Raman H, Moroni JS, Sato K, Read BJ, Scott BJ: Identification of AFLP and microsatellite markers linked with an aluminium tolerance gene in barley (Hordeum vulgare L). Theor Appl Genet
2002, 105:458-464.
27. Raman H, Karakousis A, Moroni JS, Raman R, Read B, Garvin DF, Kochian LV, Sorrells ME: Development of allele diversity of mic-rosatellite markers linked to the aluminium tolerance gene
Alp in barley. Aust J Agric Res 2003, 54:1315-1321.
28. Ma JF, Nagao S, Sato K, Ito H, Furukawa J, Takeda K: Molecular mapping of a gene responsible for Al-activated secretion of citrate in barley. J Exp Bot 2004, 55:1335-1341.
29. Wang J, Raman H, Read B, Zhou M, Mendham N, Venkatanagappa S: Validation of an Alt locus for aluminium tolerance scored with eriochrome cyanine R staining method in barley culti-var Honen (Hordeum vulgare L). Aust J Agric Res 2006, 57:113-118.
30. Wang JP, Harsh R, Zhang GP, Mendham N, Zhou MX: Aluminium tolerance in barley (Hordeum vulgare L): physiological mech-anisms, genetics and screening methods. J Zhejiang Univ Sci B
2006, 7:769-787.
31. Doyle JJ, Doyle JL: A rapid DNA isolation procedure for small quantities of fresh leaf tissue. Phytochem Bull 1987, 19:11-15. 32. Plant DNA extraction protocol for DArT [http://www.Diver
sityArrays.com/pub/DArT_DNA_isolation.pdf]
33. GrainGenes 2.0 [http://wheat.pw.usda.gov/GG2/index.shtml] 34. Buonaccorsi JP, Liebhold AM: Statistical methods for estimating
ratios and products in ecological studies. Environ Entomol 1988, 17:572-580.
35. Van Os H, Stam P, Visser RGF, van Eck HJ: RECORD: a novel method for ordering loci on a genetic linkage map. Theor Appl Genet 2005, 112:30-40.