The Role of Habitat Structure in a Freshwater
Food Web
By
Danielle M.Warfe, B.Sc.(Hons)
A thesis submitted in fulfilment of the requirements for the degree of Doctor of Philosophy
Dec lcaration
This lbesis contains no material which has been accepted for a degree or diploma by the U1iversity of Tasmania or any other institution, except by way of background information which is duly acknowledged in the text. To the best of my knowledge, this thesis contains no material previously published or written by another person, exce]Jt where due acknowledgement is made in the text.
Authority of Access
Abstract
Habitat structure refers to the nature ofthe physical structure that provides an environment for biotic communities. Much of the research in marine and freshwater systems notes the importance of habitat in community organisation (for example, fish predators are commonly less effective as habitat structure increases), but few studies have specifically described the mechanisms by which it influences trophic interactions and thereby community structure. My research investigated the role of macrophyte structure in trophic interactions and community structure in the macrophyte beds of a lowland river.
One of the problems in assessing the role ofhabitat structure is the confusion over the definition, and therefore the measurement, of habitat structure, particularly in a way that allows comparison between different habitats and systems. I defined habitat structure as a combination of the qualitative and quantitative components of structure, so where macrophytes provide the habitat, this refers to their shape and density. While macrophyte density is relatively straightforward to quantify, macrophyte shape is more problematic which has lead to a variety of system-specific measures. I tested nine different indices of habitat complexity to determine which would best describe plant shape and best relate to the macroinvertebrate distribution on different
macrophytes. I found a high degree of intercorrelation and redundancy between the structural indices such that they could be organised into two suites: one describing the interstitial space and the surface rugosity at coarse scales, the other describing the "whole plant" attributes of surface area and plant volume and the surface rugosity at fine scales. In particular, there were two indices which fell into both suites, an index of refuge space from predation, and the surface rugosity at 5 x magnification. Both these indices were also the most highly related to macroinvertebrate abundance and taxon richness, so I suggest they should be incorporated in the development of a broadly applicable index of macrophyte shape.
As macroinvertebrates responded to the refuge role of macrophytes, I tested if differences in both macrophyte density and macrophyte shape had any effect on the prey-capture success of two predators, the southern pygmy perch and a predatory damselfly. I used two predators to address the impacts of multiple predators; ifhabitat structure can mediate the outcomes of predator-prey interactions, then it may also
affect the outcomes of predator-predator interactions. I tested predator success in three macrophyte shapes at each of five macrophyte densities in a tank experiment.
Surprisingly, there was no effect of plant density, but plant shape was important as fewer prey were captured, by each predator in isolation and by both predators combined, in the most structurally complex plant. This indicated that a more
structurally complex plant can negatively affect the prey-capture success of predators, and also that macrophyte shape can mediate the outcomes of predator interactions. The implications of this laboratory experiment prompted a field experiment to determine ifthe influence ofmacrophyte shape on fish predator success translated to field conditions and affected the macroinvertebrate and periphyton communities in macrophyte beds. I conducted a two-factorial, repeated measures, randomised
complete block experiment using floating cages in existing macrophyte beds. I tested the factors ofmacrophyte shape (three types) and the presence or absence of fish predators using the native southern pygmy perch. I ran the experiment for eight months, sampling the macroinvertebrate and periphyton communities at 2, 6, 1 0, 26 and 30 weeks. Macrophyte shape had strong, consistent effects on both the
macroinvertebrate and periphyton communities; both were most abundant on the most structurally complex plant. In contrast, pygmy perch affected only a subset of the macroinvertebrate community and had minor indirect effects on the periphyton
composition. Contrary to expectations though, pygmy perch had their strongest effects on vulnerable invertebrate herbivores in the most structurally complex plant.
I concluded that in this system, macrophyte shape has a stronger influence than macrophyte density on trophic interactions, and constitutes a clear regulating
Acknowledgments
I would like to thank my supervisor Dr. Leon Barmuta for his guidance and advice throughout this project; his support, patience and assistance with drawing out the best features ofthis research were greatly appreciated.
I would also like to thank various people for encouraging and thought-provoking discussions of this research, namely Dr. Peter Davies, Dr. Simon Wotherspoon, Dr. Thomas Martin, Dr. Barbara Downes, Dr. William Elvey, Reg Majierowski, Jeff Meggs, John Gooderham, Kath J erie, Paul Reich and the members of the Australian Society of Limnology (Tasmania).
I am indebted to Henry and Simon Foster for granting access to their property, and particularly for their support and tolerance in having my cages in the river for a year and a half.
With regards to the construction of my artificial plants and cages, and the fieldwork they required, many people kindly donated their time and help at various stages for which I am extremely grateful: Ash Warfe, Tom Halcombe, Will Elvey, Adam Uytendaal, Neil Meadows, Stu Meadows (and the rest of the Meadows clan), Mel Kelly, Pippa Dickson, Jody Bruce, Carl Grosser, Rob Musk, Michelle Gabriel, John Hanagan, Paula Sheehan, Lisa Meyer, Richard Holmes and Tom Sloane. I thank Brett Mawbey for generously donating his time for collecting pygmy perch, likewise Simon Talbot and Hugh Pederson for their underwater photography. I'd further like to thank Tom Sloane for his help with sample processing.
I am grateful to the technical staff of the School of Zoology for their assistance with various dilemmas; in particular, Richard Holmes provided invaluable assistance in the workshop.
I'd like to thank various friends and flatmates over the years for their understanding and comic relief- too many to name here but you know who you are.
Finally, but by no means least, I cannot thank my family enough for their unremitting emotional support and encouragement throughout the years I have been doing this. Thank-you.
I'm just sorry you missed this dad.
Table of Contents
Access to this tbesis ABSTRACT
ACKNOWLEDGMENTS
CHAPTER 1: GENERAL INTRODUCTION Introduction
Definition of babitat structure Measurement of habitat structure
Habitat structure and predator-prey interactions
Error! Bookmark not defined. Ill
v
1
1 2 3 5
Habitat structure and food-web community dynamics 8
Research strategy and expectations 9
CHAPTER 2: THE QUANTIFICATION OF HABITAT STRUCTURE. 11
Introduction 11
Mcibo& 15
The macrophytes 15
Indices of structural complexity 16
Data Analysis 19
Results 20
Discussion 22
Indices of stmctural complexity 22
Macroinvertebrate distribution and indices of structural complexity 24
Reliability of structural indices 28
Conclusions 29
CHAPTER 3: THE EFFECTS OF HABITAT STRUCTURE ON MULTIPLE
PREDATORS 38
Introduction 38
Mciho& 40
The predators 40
The macrophytes 41
Data analysis 42
Results 43
Behavioural observations 43
Statistical analyses 44
Discussion 44
Macrophyte density 45
Macrophyte shape 46
Multiple Predator Effects 48
CHAPTER 4: THE EFFECTS OF HABITAT STRUCTURE AND FISH
PREDATION ON MACROINVERTEBRATE COMMUNITY STRUCTURE. 58
Introduction 58
Methods 59
Study site 59
Experimental design 60
Data analyses 65
Results 67
Multivariate analyses 67
Univariate analyses 68
Discussion 71
Habitat Structure 71
Fish predation 73
Fish predation and habitat structure 75
Temporal and seasonal variation 78
Conclusions 79
CHAPTER 5: THE EFFECTS OF HABITAT STRUCTURE AND FISH
PREDATION ON PERIPHYTON COMMUNITY STRUCTURE 90
Introduction 90
Mclho~ 91
Data Analysis 92
Results 94
Periphyton composition 94
Periphyton biomass 96
Discussion 97
Habitat structure 97
Predator effects 99
Temporal and seasonal effects 101
Conclusions 102
CHAPTER 6: GENERAL DISCUSSION 110
Summary of findings 110
Synthesis of findings 112
Effect measurement 112
Prey behaviour 113
Predator behaviour 115
Implications of findings 116
Conclusions 118
REFERENCES 119
APPENDIX A 131
Gut contents oflschnura heterosticta tasmanica from the Macquarie River,
Tasmania. 131
APPENDIX 8: 133
Identification keys used for macroinvertebrates and periphyton APPENDIX C:
Macroinvertebrate taxon list APPENDIX D:
Vulnerability scores for macroinvertebrate taxa sampled during the field experiment.
133 135 135 137
Chapter 1: General Introduction
In this thesis, I explore the role of macrophytic plant structure in a freshwater community. Specifically, I examine how plant structure can be measured, how it mediates predator-prey and predator-predator interactions, and how it influences the effects of a fish predator on macroinvertebrate and periphyton community structure. Introduction
"Habitat structure" refers to the physical structures in space which support plant and animal communities (McCoy and Be111991). It can refer to abiotic structures such as the size and arrangement of stones on a stream bed (e.g. Flecker and Allan 1984), the crevices and pits on stones (e.g. Downes et al. 1998), and the holes and fissures found on marine rocky shores (e.g. Menge et al. 1985). It can also refer to living structures, for example: mosses (e.g. Robson and Barmuta 1998), trees (e.g. Lawton 1983) and coral reefs (e.g. Bradbury et al. 1984), or any surface upon which organisms live. In vegetated aquatic systems such as lakes, lowland rivers, estuaries and marine littoral zones, habitat structure is provided by vascular macrophytes and macroalgae (Heck and Crowder 1991). In lowland rivers in particular, macrophyte beds can form an important link between the main channel and floodplain food webs, and at a larger scale, between riverine and terrestrial food webs (Davies and Humphries 1996, Dettmers et al. 2001). The importance of macrophytes as habitat in aquatic systems is demonstrated by the diverse and abundant communities they support, often many magnitudes greater than unvegetated areas (Crowder et al. 1998). Macrophytes provide more food resources, because there is more space available for food
attachment and collection, and more refuges from predation than unvegetated areas (Crowder et al. 1998, Diehl and Komijow 1998).
While there is little doubt in the literature regarding the importance of habitat structure (Heck and Orth 1980, Orth et al. 1984), much ofthis importance has been bestowed in an a posteriori fashion to explain results. Thus the mechanisms by which habitat structure mediates trophic interactions, and hence community structure, remain obscure (McCoy and Bell1991). There are numerous studies that have specifically attempted to elucidate the role ofhabitat structure in community dynamics (e.g. Robinson 1981, Flecker and Allan 1984, Mattila 1992, Martin-Smith 1993, Bourget et al. 1994), yet we seem to be no closer to making generalisations regarding its role. For
example, Flecker and Allan (1984) manipulated the spatial refugia available to stream macroinvertebrates (by presenting loose stones and gravel compared to cemented stones and gravel), but found the variety of predatory fish in the stream had no impact on either the macroinvertebrate abundance or diversity. Mattila (1992) varied the size, number and arrangement of artificial reeds, corks and natural macrophytes, and found amphipod and isopod survival (from predation by perch and ruffe) increased with habitat complexity. Unfortunately, given the number of treatment combinations, it is not clear what constituted "complexity". While these studies provide an insight into aspects of habitat structure that may, or may not, influence community structure, they do not allow quantitative generalisations regarding its role, and highlight the two reasons for this gap in our knowledge: a lack of consensus in defining habitat structure, and therefore, a lack of consistency of its measurement (Beck 2000). Definition of habitat structure
Habitat structure has been referred to in most systems, but is often termed differently depending on the system. For instance, on geological substrates in rivers or on rocky shores it has been referred to as "surface roughness" (Sanson et al. 1995), "substrate heterogeneity" (Menge et al. 1985) or "topographical complexity" (Walters and Wethey 1996), while on plant substrates it has been called "architecture" (Lawton 1986) or "habitat complexity" (Stoner and Lewis 1985, Floater 2001) to name just a few. These various definitions are implicitly scaled to the organisms or processes under investigation, as the terms referring to stony substrates imply two-dimensional surfaces (with three-dimensional irregularities such as fissures and crevices) upon which organisms move about, whereas the terms referring to vegetation imply three-dimensional structures within which organisms move about. Therefore, these terms are system-specific and do not permit simple comparison between studies, making it difficult to form generalisations about the role of habitat structure in community dynamics (Beck 1998).
structure, and "heterogeneity" to the variation in structure (McCoy and Bell1991). Earlier, Stoner and Lewis (1985) made the distinction between these two components of habitat structure when they noted that crustacean assemblages were influenced by both quantitative (density) and qualitative (species) attributes ofseagrass meadows. Unfortunately, McCoy and Bell's (1991) choice ofwords is unwieldy, and does not seem to have been adopted widely by other researchers. In the context of the research presented in this thesis, where macrophytes provide the habitat structure, their
abundance could be referred to as "complexity" (sensu McCoy and Bel11991);
however, I prefer to refer to it as "density" which is a more descriptive term less likely to be confused with other aspects oftheir structure.
"Heterogeneity" (sensu McCoy and Bell 1991) would refer to differently shaped macrophytes, although here confusion can arise due to scale. "Heterogeneity" implies qualitative differences of structure within a patch or macrophyte bed, whereas at the scale of individual plants it is a less useful term. For example, when comparing a reed-like macrophyte to a macrophyte with highly dissected leaves, referring to them as having a "less" or "more heterogeneous" structure (respectively) implies that they are made up of a number of structural elements which are mostly the same (in the "less heterogeneous" structure) or mostly different in the "more heterogeneous" structure ( cf. definitions of spatial heterogeneity used by Cooper et al. 1997). Clearly, these plants have completely different shapes rather then differing degrees of
heterogeneity in the common-sense uses of the word; one is a simple reed with no extra structural elements like leaves or nodes, while the other has many identical structural elements. As this thesis is focussed at the scale of individual plants, I prefer to describe their shape as lying along a continuum of "structural complexity" which is a more descriptive term than McCoy and Bell's "heterogeneity". Thus a plant having many leaves which in tum are dissected into many leaflets has a "structurally
complex" shape, while a plant with no leaves and a single stem (like a reed) has a "structurally simple" shape.
Measurement of habitat structure
While there are many studies of habitat structure, very few have considered the distinction between its quantitative and qualitative components, despite the fact that Stoner and Lewis (1985) and McCoy and Bell (1991) have drawn attention to this
distinction. Gilinsky (1984) assessed the role ofbluegill sunfish predation and habitat stmcture (or spatial heterogeneity as she termed it) on macroinvertebrate community stmcture, but measured habitat stmcture as simply the presence or the absence of artificial macrophytes. Diehl (1992) assessed the impacts offish density and habitat stmcture on a benthic macroinvertebrate community, but also measured habitat stmcture as the presence or absence of macrophytes. Other researchers have measured habitat structure using biomass (Cyr and Downing 1988a) and tend to use it as an index of surface area (Stoner and Lewis 1985, Attrill et al. 2000). However, the presence or absence of macrophyte structure, or its biomass, does not give any insight into the relative effects of macrophyte density versus structural complexity.
Many studies investigating the role ofhabitat stmcture in aquatic systems have measured it as macrophyte density (Savino and Stein 1982, Gotceitas and Colgan 1989, Nelson and Bonsdorff 1990, Swisher et al. 1998). For example, Crowder and Cooper (1982) compared the amount ofmacroinvertebrate prey consumed by bluegill sunfish in low, intermediate and high densities of natural macrophytes. As with Diehl's (1992) experiment, the natural vegetation was dominated by one macrophyte species but up to seven other macrophyte species were also present; thus macrophyte shape may have been confounded with macrophyte density.
Some researchers have assessed habitat structure with different shapes of stmcture, but each at a single density thereby failing to make the distinction between the quantitative and qualitative components ofhabitat structure (eg. Leber 1985, Persson and Eklov 1995). For example, Coull and Wells (1983) investigated the effectiveness ofblenny preying on epifaunal communities in eight different types of structure: stones, gravel, plastic bottle bmsh, and five different algal species. While they
measured the surface area to volume ratio (SA:V) of each structure- finding predator success was lowest in the structure with the highest SA:V ratio (Corallina officina/is) -this may have been confounded with the density of each structure.
crevices, and macroalgae on brick surfaces in a stream, finding that macroinvertebrate abundance and species richness increased with both the type and density of structure. In contrast, they found that macroalgae responded to the surface roughness but not the number of pits and crevices. Beck (2000) compared the distribution of marine
intertidal gastropods on five artificial substrates on which he varied the depth of pits and their density, finding that the type of structure consistently influenced the
gastropod abundance and richness, but not all species were affected by the density of pits. These two studies clearly illustrate that both the density and the type ofhabitat structure can have independent effects on the fauna living on them. At present, no such comparison between these two components has been conducted on the density and shape ofmacrophyte structure.
To properly determine the role ofmacrophyte structure on its associated
macroinvertebrate assemblage, both the density and shape of the plant should be quantified. While the measurement ofmacrophyte density is relatively
straightforward, the measurement of macrophyte shape is more problematic (which may explain why macrophyte density is a far more common measure of habitat structure). Some researchers have attempted to quantify the differences in macrophyte shape by measuring the surface area to volume ratio (e.g. Coull and Wells 1983) and the interstitial space to plant volume ratio (Hacker and Steneck 1990), but this gives no indication of the shape. Others have derived indices of shape from specific plant characteristics such as the number and length of leaves and stems (e.g. Stinson and Brown 1983) or the number and height of structural components (e.g. Raizer and Amaral2001), but these indices do not allow for comparisons between different habitats. As Beck (2000) has noted, an ideal measure or index of habitat structure should allow comparison between different habitats, give an idea of the shape of the habitat, and be logistically easy to determine. I further explain and explore the issue of quantifying macrophyte shape in Chapter 2.
Habitat structure and predator-prey interactions
Despite the great variation in the measurement ofhabitat structure, and the associated difficulty comparing between studies, there still appear to be some common patterns emerging. Much of this work has focussed on trophic interactions, particularly predator-prey interactions and the role of habitat structure in providing refuges.
Since the late 1970s, there has been a relatively large amount of research conducted on predator-prey interactions in vegetated habitats. A common pattern is the increase in abundance and diversity of macroinvertebrates, or marine epifauna, with increasing vegetation biomass or density (Heck and Wetstone 1977, Heck and Orth 1980,
Crowder and Cooper 1982, Gilinsky 1984, Stoner and Lewis 1985, Dean and Connell 1987, Diehl1988, Carlisle and Hawkins 1998, Komijow and Moss 1998). Patterns of macro invertebrate abundance on different species of macrophytes are less clear, although it has been suggested macrophytes of a more complex morphology, with more finely divided leaf structure, should support a greater abundance and diversity of macroinvertebrates (Heck and Orth 1980). Rooke (1986) compared the
macroinvertebrate assemblages on eight different macrophytes and found greater abundances of macro invertebrates on the more structurally complex macrophytes (showing more leaf dissection) than on plants with a simple morphology, but he also found individual species differ in their distributions leading to different communities on these macrophytes. Furthermore, macroinvertebrate communities on macrophytes have also been shown to vary with changing water levels (Humphries 1996), season (Chilton 1990), and predation by fish (Crowder and Cooper 1982).
While fish predators have been shown to alter macroinvertebrate community composition in vegetated systems (Heck and Crowder 1991, Crowder et al. 1998), their effectiveness at capturing prey commonly declines as habitat structure increases (Heck and Wetstone 1977, Coen et al. 1981, Heck and Thoman 1981, Savino and Stein 1982, Ryer 1988, Gotceitas and Colgan 1989, Nelson and Bonsdorff 1990, Bettoli et al. 1992, Diehl 1992, Swisher et al. 1998). So common is this pattern that Nelson (1979) postulated a "threshold" ofmacrophyte density beyond which the prey-capture success of fish predators markedly declines. Despite some corroborating studies (e.g. Coen et al. 1981, Heck and Thoman 1981, Gotceitas and Colgan 1989), this is now seen as too simplistic a description of the role ofhabitat structure (Nelson and Bonsdorff 1990).
the effects of both macrophyte density and shape on predator effectiveness, shows that prey-capture success of juvenile pinfish (Lagodon rhomboides) was highest on the
most structurally complex macrophyte (Stoner 1982). Stoner (1982) suggested prey were less concealed, and therefore at a greater risk of fish predation, by the many fine leaves of shoalgrass (Halodule wrightii) than broader-leaved macrophytes, a finding
which has been supported by Edgar (1983).
Clearly, these patterns will depend on the behaviour of both predator and prey. For example, ambush predators such as seahorses are unaffected by increased macrophyte density (James and Heck 1994), and Savino and Stein (1982) showed largemouth bass
(Micropterus salmoides) can shift to an ambush foraging mode with increasing
macrophyte density. Larger, more active macroinvertebrates are more likely to be targeted by visual predators (Crowder and Cooper 1982, Leber 1985, Main 1987), and the risk of predation to prey will depend on their ability to perceive this risk and conceal themselves in the available habitat (Welborn and Robinson 1987, Ryer 1988, Diehl and Kornijow 1998). If the available refuge from fish predation is a limited resource, this can lead to competitive interactions between prey, potentially altering dynamics with predators. Coen et al. (1981) showed competition for refuge between two caridean shrimp prey resulted in the loser being more vulnerable to pinfish predation. However, these patterns assume the presence of a single predator- a situation unlikely in natural circumstances.
Prey can make themselves more vulnerable to one type of predator in their escape responses to a second predator (Soluk and Collins 1988, Swisher et al. 1998). The impact of multiple predators may not necessarily be obtained by simply summing the impacts of individual predators in isolation; this is known as non-additivity (Losey and Denno 1988, Soluk and Collins 1988, Van Buskirk 1988, Martinet al. 1989, Soluk 1993, Morin 1995, Crowder et al. 1997). Ifhabitat structure can influence predator-prey interactions, then it might be able to mediate predator-predator interactions and hence the combined impacts of multiple predators. Or, the presence of habitat structure may result in the prey's responses to one predator making it more vulnerable to a second predator. In the only published study to have investigated the effects ofhabitat structure on multiple predators, Swisher (1998) showed the
combined impact of bluegill sunfish (Lepomis macrochirus) and dragonfly larvae (Erythemis simplicicollis) was greater at low macrophyte densities, thereby exceeding
additivity because prey were more easily detected by bluegills as they escaped dragonflies. As the density of macrophytes increased, blue gills were less able to detect the prey and the combined impact ofboth predators became additive (Swisher et al. 1998). At the time of writing, there were no published studies investigating the effects ofboth macrophyte density and shape on the impact of multiple predators. Habitat structure and food-web community dynamics
Despite the plethora of studies on habitat structure and predator-prey interactions, there are surprisingly few that have looked at the implications for community structure and food-web dynamics (Diehl and Komijow 1998). It is only relatively recently that the focus in aquatic vegetated habitats has shifted from pairwise
predator-prey interactions to multifactorial food-web dynamics (Crowder et al. 1998). This comes with the realisation that species interactions can have a multitude of direct and indirect effects throughout the rest ofthe food web (Crowder et al. 1998).
Perhaps the most dramatic of these indirect effects is the trophic cascade, where the effects of a top predator cascade down the separate trophic levels of a community to alter the biomass of the primary resource (Polis et al. 2000). Carpenter et al. (1987) provide a classic, exciting example of a top predator regulating the structure of a pelagic lake community, and many studies have attempted to replicate this result in a variety of systems such as rivers (Power 1990), grasslands (Beckerman et al. 1997) and vegetated dunes (Spiller and Schoener 1993). Mixed success from these studies suggests that a trophic cascade requires the conditions of defined trophic levels and strong links between these levels. The generality of trophic cascades remains
controversial (Strong 1992, Pace et al. 1999), and depends to a large degree on how a trophic cascade is defined (Polis et al. 2000). Polis (1999) distinguishes between species-level (where only one or a few plant species are affected by indirect predator effects) and community-level cascades (where the biomass of the primary resource is substantially altered throughout the system), and suggests that the majority of
structurally complex habitats, there are more complex, diverse, and weakly-interacting communities which are less amenable to being split into the discreet trophic levels necessary for a community-level trophic cascade (Strong 1992). If fish predators are more likely to target large, active members of the prey community, or subsets of the prey community, and their effectiveness is likely to decline with increasing habitat complexity, the logical hypothesis that follows is that fish predators will have stronger, potentially cascading effects on the prey community in structurally simple rather than more structurally complex habitats (Power 1992). Power (1992) found the functional significance offish in streams varies with substrate heterogeneity at small scales, with fish having no effects on a relatively complex gravel substrate (where there are more refuges from predation) compared to a boulder-bedrock substrate. While significant variation in fish impact has been found between vegetated and unvegetated areas in aquatic systems (Crowder and Cooper
1982), there is as yet no research comparing different morphologies of vegetation offering different levels of protection.
Research strategy and expectations
This research was organised into three parts: the measurement of habitat structure, investigating the influence of habitat structure on multiple predator effects, and investigating the indirect effects of habitat structure on community structure through its direct effects on predation. The first part is an empirical critique of the methods of quantifying habitat structure. The second part was conducted in the laboratory to determine specific effects ofhabitat structure on trophic interactions without the noise inherent in natural communities. The third part was a field experiment, necessary to determine the relevance of laboratory results and allow extrapolation to the instream community, and gain a greater understanding of the interconnectedness of all things (Adams 1987, Ford 2000).
The habitat structure under investigation was provided by three species of
macrophytes common to the Macquarie River, Tasmania, Australia. I used plastic imitations of these plants to test the effects of plant morphology and eliminate any potentially confounding effects of senescence and secondary chemicals. This allowed for consistent and quantifiable sampling units. They represented the reed Eleocharis
sphacelata, the water ribbon Triglochin procera, and the water milfoil, or foxtail,
Myriophyllum variifolium (see Chapter 2, Figure 1, and Chapter 4 for details).
Chapter 2 compares different indices of habitat structure as measured for each macrophyte, to determine which best quantifies plant shape in a manner relevant to the macroinvertebrates using it. I expected the reed Eleocharis to have the most
simple structure, Myriophyllum to be the most structurally complex macrophyte with
its high degree ofleaf-dissectedness, and the tufted, strap-like Triglochin procera to
be intermediate between the two.
Chapter 3 describes a laboratory experiment testing the separate components of macrophyte shape and density on multiple predator effects. The prey-capture success of two predators (damselfly larvae and pygmy perch) was tested in each macrophyte, at each of five densities. Given damselfly larvae are potential prey items of, and competitors with, pygmy perch, both their separate and combined impacts were assessed, as I expected damselflies to capture less prey in the presence of pygmy perch. I expected more prey to be consumed by each predator at low macrophyte densities and in the structurally simple macrophyte. I also expected the combined impact of both predators to be positively non-additive at lower densities and in the structurally simple macrophyte, i.e. more prey would be consumed than expected by adding the individual effects of each predator alone.
Based on the results from the laboratory experiment, Chapters 4 and 5 describe a multifactorial field experiment investigating the influence ofmacrophyte shape on the direct and indirect effects of fish predators on the macrophyte-associated
macroinvertebrate and periphyton communities. If pygmy perch had strong effects, I expected to find their direct and indirect effects greater in the structurally simple macrophyte, Eleocharis, where theoretically, there are no refuges and fish can capture
more prey and potentially have cascading effects on lower trophic levels (consumers and producers). Correspondingly, I expected little, if any, effects of fish in the most structurally complex macrophyte, Myriophyllum, due to the presence of more refuges.
Chapter 2: The Quantification of Habitat Structure.
Introduction
While there is little doubt in the literature regarding the importance of habitat
complexity, the mechanisms by which it influences invertebrate communities, and the trophic interactions therein, remain obscure (McCoy and Bell1991). One reason for this is the lack of consistency in the measurement of habitat structure (Beck 2000, Downes et al. 2000). Habitat structure incorporates both the type of structure and the density of structure. However, even when the same aspect of habitat structure is defined, it is often measured in a manner that is specific to the system under
investigation: for example, the number of different plant structures (e.g. Stinson and Brown 1983) or the degree ofbranching in a plant (e.g. Edgar 1983). This does not allow for comparisons between systems and has therefore made it difficult to ascertain the effects of habitat structure on invertebrate distributions, and to identify the aspects of structure to which they are responding (Beck 1998, Bartholomew et al. 2000, Beck 2000).
A useful index ofhabitat structure should be relatively simple to measure, and be independent of specific structural components in order to be used within and between habitats to allow meaningful comparisons between studies (Beck 1998). Beck (1998) addressed this issue by using four different indices to measure the structural
complexity of rocky substrates between habitats and compared their effectiveness as they related to the distribution of gastropods; he found the fractal dimension of the substrate was most highly correlated with gastropod distribution. Carleton and
Sammarco (1987) measured the surface irregularity of plating coral substrata with five different geomorphological measures. They found that while vector dispersion was the best descriptor of surface irregularity, no single index stood out as a good
predictor of coral settlement, although this may have been partly due to over 90% of corals settling underneath, rather than on, the experimental plates. To date, no such study comparing several different measures of habitat structure has been conducted in a system where three-dimensional freshwater macrophytes, rather than
two-dimensional surfaces, provide the habitat structure.
Ecologists know that the structure of aquatic plants influences macroinvertebrate (and epifaunal) distributions, because differently shaped macrophytes support different
macroinvertebrate communities (Rooke 1986, Cyr and Downing 1988b, Chilton 1990, Humphries 1996). However, invertebrate abundance and diversity have often been related to broad habitat descriptors such as plant presence or biomass (e.g. Dvorak and Best 1982, Stoner and Lewis 1985, Cyr and Downing 1988a) which do not distinguish the specific aspects of plant morphology to which invertebrates may be responding, and so the predictive power of these descriptors is low (Lawton 1986, Hacker and Steneck 1990, Gee and Warwick 1994b ). Furthermore, macro invertebrates are more likely to be making choices between habitats at the scale of individual plants or plant parts (Davenport et al. 1996), and therefore may not respond to coarse-scale measures such as plant presence and biomass. If plant shape influences the distribution of macroinvertebrates and is to be used as a tool describing that distribution, illustrating its role as a component of habitat structure, then it should be quantified at the relevant scale (McCoy and Bel11991, Beck 1998).
The structural indices that have been used to relate macrophyte structure to macroinvertebrate distributions can be grouped into three categories: those that measure the physical attributes of the plant, those that measure the amount of interstitial space associated with the physical structure of the plant, and the fractal dimension of the plant. Each of these categories is considered in tum.
abundances (Heck and Wetstone 1977, Heck and Orth 1980). However, Sher-Kaul et al. (1995) measured the surface area of six macrophytes, while holding biomass constant, and found that plants with a dissected morphology do not necessarily offer the largest surface area per unit biomass. The indices of surface area and plant volume were used here to test this hypothesis and to determine if surface area in particular was a sufficiently good descriptor ofmacrophyte structure as it relates to the distribution of macro invertebrates between plant types.
Some researchers have noted that where aquatic plants provide the habitat structure, invertebrates respond to the interstitial space as well as the physical structure (Hacker and Steneck 1990, Schmid 2000). Hacker and Steneck (1990) compared the interstitial volumes of four macroalgae (two of which were artificial), and found that plants with an intermediate proportions of interstitial volume (relative to plant volume) provide optimal habitats for the amphipod Gamarellus angulosus as there was enough space to accommodate their body volume, yet enough substrate on which to cling. However, measuring the overall interstitial volume of a plant gives no indication of its shape and how it may be split or partitioned among macrophyte structural elements, and assumes all the interstitial space is equally available to the epifauna. Dibble et al. (1996)
developed an index of interstitial space (lSI) which took into account the structural complexity of macrophytes, yet was an independent measure of a plant's structure. The lSI measures the frequency and size of interstitial spaces between structural components along vertical and horizontal axes, such that a greater number of smaller gaps indicates a more structurally complex plant shape. Bartholomew et al. (2000) went one step further and incorporated the potential role ofmacrophyte structure as a prey refuge in their structural index. More structurally complex plants are
hypothesised to provide more prey refuges because the increased structural
complexity impedes the ability of fish predators to find and capture prey, thus there are more spaces which are safe from predation (Heck and Crowder 1991).
Bartholomew et al. (2000) therefore divided the average interstitial space size, Sp, by the predator size, Pr, to develop an index, Sp/Pr, which measured the amount of interstitial space for prey where they were safe from predation. Obviously this index would vary with the size of the predator under investigation, but it is dimensionless and gives an indication of the amount of available interstitial space (Bartholomew et al. 2000). I used three indices to measure the amount of space associated with
macrophyte structure: the indices of Dibble et al. (1996) and Bartholomew et al. (2000), together with a third index I developed which measured the absolute amount of space unavailable to a fish predator but available to macro invertebrate prey, the fish-free volume (FFV). Ifmacroinvertebrates are tracking refuge space, and a more complex plant shape provides more refuge space, then the absolute amount ofFFV should relate to the distribution of macro invertebrates between plants.
Many natural objects have irregular surfaces and cannot be sufficiently described by Euclidean geometry (Sugihara and May 1990). Fractal geometry describes the
measurement of an object where that measurement depends on scale, such that where a smaller "ruler" is used, the measurement picks up the addition of detail at greater magnification (Schmid 2000). Thus it is independent of the nature of the habitat and is related to the scale at which the habitat is viewed (Lawton 1986, Gee and Warwick 1994b, Schmid 2000). Mathematical fractals display scale-invariance, or
self-similarity, in that they show the same amount of detail or roughness at all scales. By contrast, natural fractals differ because natural structures are usually truncated at certain scales (A vnir et al. 1998, Schmid 2000).
The fractal dimension (D) of an object is estimated from the surface ofthat object, and as it increases, indicates the surface becomes more convoluted, departing from a two-dimensional surface and approaching a three-dimensional object. D has been shown to be a relatively good indicator of structural complexity, with more complex habitats having a higher D and supporting more animals, for both rocky substrates (Beck 1998, 2000, Schmid 2000) and plants (Morse et al. 1985, Shorrocks et al. 1991, Williamson and Lawton 1991, Jeffries 1993, Gee and Warwick 1994a). Ifthe
Given that differently shaped macrophytes support different macroinvertebrate communities, this research was motivated to find an index of macrophyte structural complexity that quantified their shape (thereby allowing the comparison of different macrophyte habitats between systems) and consistently related to the distribution of associated macroinvertebrate communities. I compared three differently shaped macrophytes, Eleocharis sphacelata, Triglochin procera, and Myriophyllum
variij'olium (Figure 1 ), which could immediately and intuitively be ranked as
structurally simple to structurally complex respectively. Myriophyllum can be perceived to have a complex structure because of its finely divided leaf structure, giving it many structural components. Whereas Eleocharis can be perceived to be structurally simple because it is a stem with no projections or finer-scale structure.
Triglochin, with its numerous long flat leaves, can be perceived as having a structure
of intermediate complexity. I measured these macrophytes with a range of indices of habitat structure that measured different attributes of the habitat: the physical structure (surface area and plant volume), the interstitial space (the lSI, Sp/Pr and FFV), and the fractal dimension. I assessed the strength of association between these indices and macro invertebrate abundance and taxon richness to determine if any were consistently better at explaining the macroinvertebrate distribution on these plants. This would allow me to evaluate their usefulness as a quantitative measure of macrophyte structure to compare within and between systems.
Methods
The invertebrate data for this chapter were obtained from a field experiment conducted in the Macquarie River, Tasmania (147°28'E, 41 °57'S) and explained in more detail in Chapter 4. The experiment and sampling protocol were designed to assess the effects of macrophyte structure and fish predation on the macroinvertebrate community, but as this current chapter is focussed on the measurement ofmacrophyte structure, the effects of fish predation are addressed elsewhere (Chapters 4 and 5).
The macrophytes
Artificial plants were used to prevent changes in plant shape over time, and to ensure consistent and quantifiable sampling units. They also prevented any effects of secondary plant chemicals on the periphyton quality, thereby ensuring
macroinvertebrates were responding to differences in macrophyte shape only in their
distribution. They represented analogues of three macrophytes common in the Macquarie River; the spikerush Eleocharis sphacelata, the water ribbon Triglochin procera and the water milfoil Myriophyllum variifolium (Figure 1 ). (Macrophytes and
their artificial imitations are hereafter referred to by their genus name only.)
Eleocharis is comprised of cylindrical stems with no leaves and was designated, a
priori, as structurally "simple" whereas Myriophyllum has many whorls of
finely-dissected leaves and was considered structurally "complex". Triglochin has long
strap-like leaves arising from a tuft and was considered "intermediate" in its structure. The simple macrophyte was constructed of green electrical conduit (7 mm diameter), cut into 280 mm lengths and sealed with neutral silicon to resemble stems of
Eleocharis. Four stems comprised a sampling unit (or "plant") for measurements of
habitat structure. Lengths of green packing strap (12 mm width) were used to represent Triglochin. A plant consisted of 18 lengths of packing strap, 3 of each length 100, 130, 170, 200, 260, and 280 mm, held together at the base with epoxy-resin to form a tuft. Commercially produced plastic aquarium plants (Tetra
Secondnature©) were used to represent Myriophyllum. A plant comprised four stems of whorled leaves with a high degree ofleaf-dissectedness to specifically imitate
Myriophyllum spp. (Tetra Secondnature, Blacksburg, Virginia, USA., pers. comm.).
The macrophytes were given ten weeks colonisation by periphyton and
macroinvertebrates, after which 36 plants of each type were sampled on each of seven sampling occasions over a 30-week period. The plants and their associated fauna were scooped out with a 250 !-!ill mesh net, preserved with 5% formalin and returned to the laboratory. The macrophytes were cleaned and the macroinvertebrates were picked out of the periphyton and identified to genus where possible to obtain the total macroinvertebrate abundance and taxon richness.
Indices of structural complexity
measurements were not replicated as the artificial imitations of each macrophyte were identical in structure.
Surface area (SA) - I initially attempted to measure surface area using the detergent
method ofHarrod and Hall (1962); however, arbitrary decisions regarding the concentration of detergent in the solution, and a relatively high standard error in the final weights (up to 33% of the mean), led me to abandon this method as unreliable. Thus, surface area was measured geometrically with vernier calipers. The surface area
of Eleocharis was obtained with the formula 2nch (i.e. treating each stem as a
cylinder) where r denotes the radius and h the height, and multiplied by 4 (the number of stems making up a "plant"). The surface area of the individual "leaves" of
Triglochin were calculated using the formula 2lw, where lis the length and w the
width of each leaf (multiplied by 2 to account for both sides of the leaf), and then added to give the surface area of the entire plant. The depth of each Triglochin leaf
was 1 mm and therefore would not have changed the final surface area value.
Myriophyllum consisted of two large sterns and two small stems, each with leaves and
leaflets of 1 rnm depth and width, but slightly different lengths. Leaflets varied in length from 5-9 mrn on the small stems and 6-16 mm on the large stems, with the smaller leaflets at the leaf apices. Ten leaflets from the same position on ten leaves were measured to obtain the average leaflet length at that position, and the surface area of a leaflet calculated with the formula 2lw. Surface area values for the leaflets
were added to give the surface area of a leaf, and then multiplied over the number of leaves per stem. This was repeated for leaves from both large and small stems, and the surface area of the cylindrical main stems was also calculated (using 2rrch), and all
values added to give the total surface area of the plant.
Plant volume (PV)- The plant volume was determined geometrically in the same
manner as surface area and confirmed by the amount of water each plant displaced.
Fish-free volume (FFV)- The fish-free volume (FFV) was also determined
geometrically and was effectively a measurement of the amount of space available to macroinvertebrates but unavailable to pygmy perch, Nannoperca australis, the fish
predator used in the laboratory and field experiments. The minimum size of pygmy perch used in the experiments was 30 mm with a gill-to-gill width of 5 mm (see Chapters 3 and 4). Assuming pygmy perch could only access spaces they could fit
their head into, any space under 5 mm wide was considered to be FFV. The low complexity macrophyte, Eleocharis, had no FFV, and this was confirmed by direct observations of pygmy perch under laboratory conditions.
The FFV in Triglochin comprised the wedge-shaped spaces between leaves at the base of the tuft, each ofwhich was measured geometrically using the formula lwd/2 which measured the length(!), width (w) and depth (d) of an oblong and divided by 2 as if the oblong was sliced diagonally to produced a wedge (Figure 2a). The volumes were added to provide the FFV per plant, and calculated for five plants to obtain an average FFV per Triglochin plant.
The four stems comprising Myriophyllum (including leaves) were treated as cylinders (Figure 2b ); the volume of each "cylinder" was calculated with the formula trr2 h,
where r denotes the radius of the cylinder (the stem and the leaves) and h the height, and added to provide the overall volume. The PV was then subtracted from this value to give the FFV for Myriophyllum.
Interstitial Space Index (lSI) - The interstitial space index was based on the index of
habitat structure developed by Dibble ( 1996) and is calculated with the formula
hv
=(fi/lh)
+
([vllv), where.fh is the mean number of gaps between structural elements alonghorizontal axes, lh is the mean length of those gaps,fv is the mean number of gaps
along vertical axes, and lv is the mean length of the vertical axis gaps. Gaps along 3
horizontal and 3 vertical axes (each at least 3 em apart) were counted and measured using a ruler against 4 unmagnified photographs of each macrophyte. A greater
hv
value indicates a higher frequency of gaps and a smaller gap length, and thereby indicates a greater structural complexity.Interstitial Space Size/Predator Size (Sp/Pr) - This dimensionless measure was
developed by Bartholomew (2000) to determine the extent to which structure
most likely to be impeded by macrophyte structure (Bartholomew et al. 2000). Values below 1 indicate the predator's movement through the habitat is impeded by structural elements, implying a greater structural complexity, and values above 1 indicate the interstitial space is large enough to allow free movement through the habitat.
Fractal Dimension (D) The fractal dimension of each macrophyte was estimated, at
each of 4 scales, based on the method ofMorse (1985) and Jeffries (1993) which used the Kolmogorov or box-counting dimension (Schmid 2000). This dimension is based in the log-log relation between the side-length of grid squares and the edge of the plant. The macrophytes were suspended upside down to recreate their position in the water column. Four black-and-white photographs were taken, with very shallow depths of field (5 mm), at 5 mm intervals "through" the plants, at each scale. Scale 1 was the smallest scale at 6.5 x magnification, Scale 2 was at 5 x magnification, Scale 3 at 2.5 x magnification, and Scale 4 was at 1 x magnification (i.e. unmagnified) and thereby the largest scale. This method yielded 4 two-dimensional "slices" of each plant at each scale. Grid squares of 100 mm, partitioned into 2n squares (where n was 2, 4, 6, 8 or 10, and the square size was therefore 50, 25, 12.5, 6.25 or 3.125 mm respectively), were progressively placed over each photograph, and the number of squares (per grid) in which the plant was in focus was counted. The log of this number was plotted against the log of the number of squares along the respective grid edge (2, 4, 8,16, or 32 squares respectively), and the slope of the resulting regression line was D, the fractal dimension (also called the Kolmogorov dimension). A separateD was calculated for each scale to determine how D varied with scale as I did not assume self-similarity in D.
Data Analysis
Each index of habitat structure was obtained from the same three plant types. Principal Components Analysis (PCA) was conducted on the structural indices to assess their interrelationships; the indices which are more highly correlated with each other will map onto the same component and would allow me to assess whether there was any redundancy amongst them. I used orthogonal rotation on the loadings which helps interpretation by maximising the high correlations and minimising the low correlations of each index with the principal components (Tabachnick and Fidell 2001). By plotting each macrophyte in principal component space I could judge how
they differed from each other, and which index, or combination of indices, best described them.
Single factor analysis ofvariance (ANOVA) was conducted on each ofthe total number ofmacroinvertebrates and the total number of taxa to determine if they varied with macrophyte shape, and planned pairwise comparisons (Myriophyllum v.
Triglochin, and Triglochin v. Eleocharis) were also conducted.
If the macroinvertebrate assemblage is affected by the structural complexity of the habitat, there should be significant correlations between the structural indices and macroinvertebrate abundance and taxon richness. Furthermore, the index with the most significant correlations should provide the best measure of habitat structure that most strongly affect macroinvertebrates (Beck 1998). Each structural index was correlated with macroinvertebrate abundance and taxon richness, and site was treated as independent for this analysis, so there were six correlations for each structural index. Each site was sampled a different number of times which meant 3 sites had 60 replicate samples, and 3 had 24 replicate samples. The time factor was not considered independent here because the abundance and taxon richness of the macroinvertebrate assemblage at any one time was likely to depend on the abundance and richness at the previous time (Underwood and Anderson 1994). Due to the large number of tests performed, the level of significance was reduced top< 0.01 to prevent the occurrence of Type I errors. Data were log-transformed where necessary, to meet assumptions of normality, and all analyses were performed using SYSTAT Version 9 (Wilkinson 1999).
Results
Each complexity index differed between macrophytes except for D3 (the fractal
dimension at Scale 3) which was the same for Eleocharis and Triglochin (Table 1). This indicates each index was capable of measuring differences in structure between the macrophytes. The fractal dimension did not increase linearly with scale, as Scale 2 (at 5 x magnification) had the lowest D (Figure 3), which indicates a lack of
self-similarity. Significant differences between the fractal dimension of each macrophyte only appeared at the largest scale (Scale 4, no magnification) where Myriophyllum
had a greater fractal dimension than either Triglochin or Eleocharis. The lSI value for
indicating many small interstitial spaces, and therefore many structural elements, on this plant. An Sp/Pr value under 1.0 for Myriophyllum suggested these structural elements potentially impede the mobility of pygmy perch.
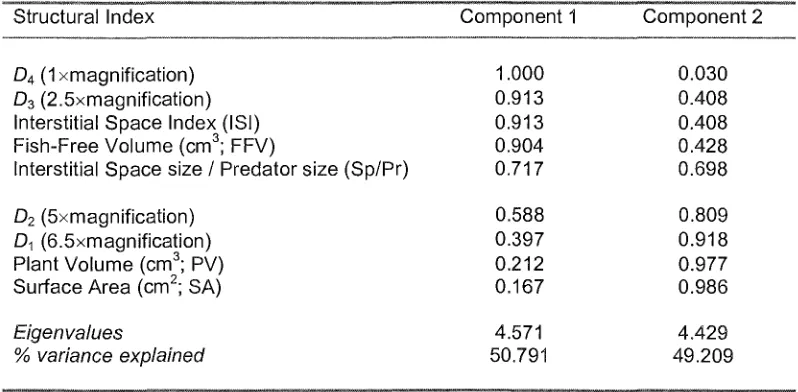
The Principal Components Analysis reduced the structural indices to just two
components which explained 100% of the variation (Table 2) and indicates the indices are highly correlated with each other. This was expected given the indices were derived from the same three plant shapes. Component 1 is most strongly correlated with the indices measuring the interstitial space of the plants (ISI, FFV and Sp/Pr) and the fractal dimension at Scales 3 and 4 (at 2.5 and 1 x magnification respectively), while Component 2 is most strongly correlated with SA, PV and the fractal dimension at Scales 1 and 2 (6.5 and 5 x magnification respectively). The plot of each
macrophyte in Principal Component space (Figure 4) shows that Myriophyllum loads highly on PC1 and low on PC2, indicating that it has greater amount of interstitial space and fish-free volume, a lower Sp/Pr index, and a higher fractal dimension at Scales 3 and 4 relative to the other macrophytes. By contrast, Eleocharis loads highly on PC2 and low on PCl, indicating it affords little refuge from predation and is best described by surface area, plant volume and a low degree of surface rugosity at finer scales.
The abundance of macroinvertebrates significantly varied according to macrophyte shape (F2,246= 49.733, p<O.OOl; Figure 5a). Myriophyllum supported 48% more
macroinvertebrates than Triglochin (F1,z46= 30.063, p<0.001), which supported 38%
more macroinvertebrates than Eleocharis (F1,246 = 19.594, p<0.001). Likewise, the
taxon richness was also significantly affected by macrophyte shape (F2,246 = 53.238,
p<O.OOl; Figure 5b ). There were 13% more taxa on Myriophyllum than Triglochin (F1,z46 = 7.766, p<0.006), and 29% more taxa on Triglochin than Eleocharis (F1,246 =
51.439, p<O.OOl).
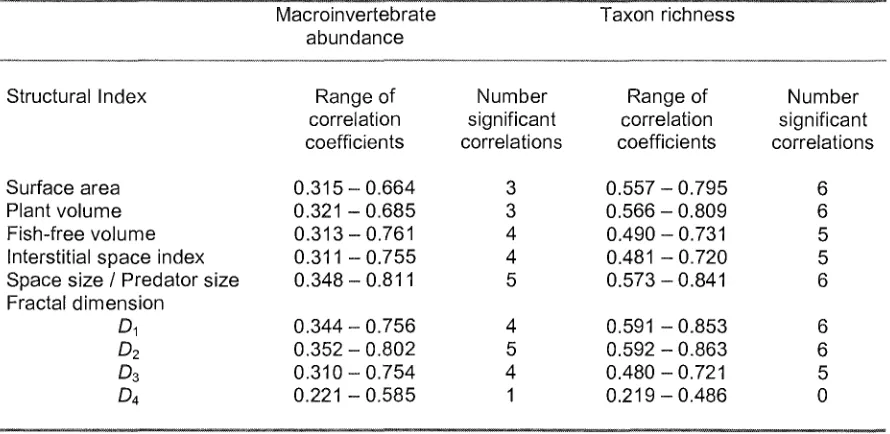
The structural indices D2 and Sp/Pr had the highest number of significant correlations
with macroinvertebrate abundance and taxon richness, although SA, PV and D1 also
had six significant correlations with taxon richness (Table 3). D2 and Sp/Pr can
therefore be considered to best measure the habitat structure as it influences
macroinvertebrate abundance, while the intercorrelated indices of Component 2 best measure the habitat structure as it influences taxon richness. D4 had the lowest number of significant correlations with both macro invertebrate abundance and
richness, and thus did not describe the habitat in a way which related to the
macroinvertebrate assemblage despite being highly correlated with the Component 1 indices.
Discussion
This research was designed to determine how best to quantify macrophyte shape, and to elucidate the aspects ofmacrophyte structure which influence the distribution of an instream macroinvertebrate assemblage. I measured three morphologically different macrophytes with a variety of indices to determine which index was most strongly related to the distribution of associated macroinvertebrates and may therefore be used as a predictive tool.
Indices of structural complexity
I measured each plant with indices relating to their physical structure (surface area and plant volume), their fractal dimension, and their interstitial space attributes (lSI, FFV and Sp/Pr) to determine which best described the habitat as it related to the distribution of the macroinvertebrate community. Each index (apart from D2 ) was capable of separating the macrophytes, and the values of each mirrored my a priori
classification of structural complexity. For example, Myriophyllum, the macrophyte I considered most structurally complex, consistently had a higher fractal dimension indicating a higher degree of surface rugosity, although contrary to expectations, its surface area was very similar to that of Triglochin, which supports the view that a dissected morphology does not necessarily provide more surface area (Cyr and Downing 1988b, Sher-Kaul et al. 1995). Eleocharis, the plant I considered least structurally complex, had the highest Sp/Pr value which indicated it had the largest gaps and thus the least amount of structure likely to impede the mobility of pygmy perch. D2 was the same for both Eleocharis and Triglochin, suggesting these plants
had the same degree of surface rugosity at 5 x magnification.
There was a high degree of intercorrelation between the indices, as shown in the principal components analysis, which summarised them into just two components. When the macrophytes were plotted in principal components space, I found
Myriophyllum was best described by PCl, which comprised the indices lSI, FFV,
more protrusions into three-dimensional space and larger animals would perceive it differently from smaller animals. The interstitial space is the space between structural elements, therefore, should be associated with a greater degree of surface rugosity. Given the highly dissected leaf structure of Myriophyllum, with many structural elements, it makes sense that the combination of these indices best described its shape.
Similarly, it made sense that Eleocharis separated strongly from Myriophyllum on PC2, which comprised the indices SA, PV, Dl and D2. The surface area and plant volume describe the physical structure without any indication of structural elements, and the lower fractal dimension at finer scales indicates a relatively smooth surface. Thus, the combination of these indices best described a smooth surface and shape lacking finer structural elements, i.e. Eleocharis.
Triglochin was intermediate between Eleocharis and Myriophyllum. It differed from
these two macrophytes in that its fractal dimension did not vary with scale, which indicated a degree of self-similarity over the scales measured. Unlike the relatively smooth surface of Eleocharis, the packing strap used to construct Triglochin had a rough dimpled surface; this provided a degree of surface rugosity at the scale ofthe leaf surface which shared a similar fractal dimension to the whole plant. However,
Triglochin did provide some refuge for macroinvertebrates from pygmy perch
predation, and had a similar surface area to Myriophyllum, which explains its closer affinity to Myriophyllum than Eleocharis in principal component space.
Although the three macrophytes are separated on PCl, they are more clearly separated by considering both principal components. This suggests that there are two suites of variables with a high degree ofintercorrelation (and redundancy) within each suite: one suite measuring the refuge "volumes" and rugosity at coarser spatial scale, the other measuring "whole plant" attributes (SA and PV) and rugosity at finer spatial scales. This suggests firstly, many measures of structural complexity are likely to be highly correlated. Secondly, as few as two carefully selected, relatively independent measures would suffice to quantitatively describe the structural complexity of macrophytes. While he did not assess the collinearity between four indices of habitat structure on a rocky shore, Beck (2000) also concluded that multiple indices should be used to incorporate the many correlated features of habitat structure.
Macroinvertebrate distribution and indices of structural complexity
The distribution of macroinvertebrates varied with macrophyte shape, as predicted, and the Sp/Pr and fractal dimension at Scale 2 best described the habitat structure that influenced this distribution.
The greater abundance and richness ofmacroinvertebrates on Myriophyllum than Triglochin, and on Triglochin than Eleocharis, supports my a priori classification of
each macrophyte and also the many studies showing macroinvertebrates, marine epifauna and terrestrial arthropods are more abundant and diverse in more structurally complex habitats (Robinson 1981, Orth et al. 1984, Heck and Crowder 1991,
Schneider and Mann 1991, Jeffries 1993, Gee and Warwick 1994a, Jacobi and Langevin 1996, Crowder et al. 1998, Diehl and Kornijow 1998, Raizer and Amaral 2001). For example, Rooke (1986) compared the macroinvertebrate fauna on eight different macrophyte species, and found consistently greater abundances on the highly dissected leaf forms, a Myriophyllum and Ranunculus species. Raizer and Amaral
(200 1) assessed the spider communities on the emergent parts of aquatic macrophytes, and found the most abundant and diverse community on the most structurally
complex plant, Eichornia azurea. I explore this pattern further in Chapter 4, and here I will discuss the relationship between the structural indices and the distribution of macroinvertebrates between macrophytes.
The Sp/Pr was one of the most highly correlated indices with macroinvertebrate distribution as both total macroinvertebrate abundance and taxon richness were greater in the habitat with a lower Sp/Pr, Myriophyllum. This supports the findings of
with the greatest amount of refuge space (Bell and Westoby 1986), which in this case corresponds to Myriophyllum. Myriophyllum also supported a greater biomass of
periphyton (Chapter 5) and macroinvertebrates may have been tracking food
resources rather than refuge availability. However, Miller (2002) and Schneider and Mann (1991) have shown that invertebrates can still select structurally complex macrophytes even in the absence ofperiphyton, which suggests refuge availability is an important factor in their distribution.
The Sp/Pr, lSI and FFV indices all measured the space associated with each macrophyte, yet the lSI and FFV indices were not as correlated with the macroinvertebrate distribution because they each lacked information that was
incorporated in the Sp/Pr index. Unlike the Sp/Pr, the FFV index does not specifically incorporate information about the number of structural elements, which in the Sp/Pr is inferred from the size of interstitial spaces (the smaller the average space size, the more frequently it is split by structural elements). The FFV is based on the assumption that space is unavailable to pygmy perch because parts of the structure are impeding their access, and therefore a greater overall amount offish-free volume implies a more structurally complex habitat. It appears macroinvertebrates are responding to the refuge space associated with the actual structure of the macrophyte, rather than the refuge space per se. This agrees with the PCA results, where Component 1 (lSI, FFV,
Sp/Pr, D3 and D4) described the interstitial space and the surface rugosity of
macrophyte shape, and thus best described Myriophyllum, the plant with the greatest
macroinvertebrate abundance and richness.
While the lSI incorporated habitat structure, measuring the size and frequency of interstitial gaps associated with macrophyte shape, it did not incorporate any
information about the predator. Thus, unlike the Sp/Pr, it was not a measure of refuge space. Sanson et al. (1995) developed a method to describe the surface structure of stone substrates, which modelled the amount of refuge space available to prey at risk from predators of various sizes, illustrating that refuge availability can be much more accurately determined by scaling space to the size of relevant predators. By scaling the average interstitial gap size to the predator of interest, in this case pygmy perch, the Sp/Pr specifically incorporated information about how the habitat was used (Bartholomew et al. 2000). It thus proved one of the best descriptors ofthe habitat structure in a way that was relevant to the macroinvertebrate distribution.
The other good descriptor of habitat structure for macroinvertebrate abundance and taxon richness was D2, the fractal dimension at Scale 2 (5 x magnification). Fractal
dimension has been shown to be a relatively good indicator of habitat structural complexity, with more complex habitats having a higher D and supporting more animals (Morse et al. 1985, Shorrocks et al. 1991, Williamson and Lawton 1991, Jeffries 1993, Gee and Warwick 1994a, Beck 1998, Schmid 2000). The fractal dimension is generally seen as an effective method of describing habitat structure because it is independent of the nature of the habitat and is related to the scale at which the habitat is viewed (Morse et al. 1985, Lawton 1986, Gee and Warwick 1994b, Schmid 2000). This may explain why the fractal dimension at Scale 4 was by far the worst descriptor of macrophyte structure in relation to the macro invertebrate distribution, because it is at a scale too "coarse" to be perceived by macrophyte-associated macroinvertebrates. If macro invertebrates are responding to their immediate vicinity, then they are not likely to perceive structural complexity at the scale ofthe entire plant (Davenport et al. 1996).
Against expectations, surface area was one of the worst descriptors of habitat structure as it related to macroinvertebrate abundance. This contrasts with the many studies which have shown that as plant surface area increases, so does animal abundance (Dvorak and Best 1982, Stoner and Lewis 1985, Parsons and Matthews 1995, Parker et al. 2001). Much of the surface area may not have been directly available to
macroinverterbates because it left them vulnerable to predation from pygmy perch. In
Eleocharis there was no surface area available as a refuge from predation and in
Triglochin, "safe" surface area was only available at the base of the tuft, in the spaces
between leaves. In Myriophyllum, however, the entire inside surfaces of the leaves (i.e. half the total surface area) provided a surface free from the risk of predation. The absolute surface area may therefore not be a good representation of usable habitat. Other researchers have also found no relationship between macroinvertebrate density and macrophyte surface area, and have suggested the fauna are responding to different aspects of structure (Brown et al. 1988). Jeffries (1993) constructed artificial