BIS RESEARCH PAPER NUMBER 64
Apprenticeship Pay Survey 2011
John has been working in social research for the past ten years specialising in the areas of further and higher education.
Kully Kaur-Ballagan is a Research Director with over has over 13 years’ experience in social research and has worked on a number of studies relating to skills and the labour market, especially in relation to the skills of ethnic minority communities.
Jayesh Navin Shah is a Senior Research Executive specialising in further and higher education research.
Contents
About the Ipsos MORI authors... 2
Contents ... 3
Chapter 1: Introduction ... 9
Policy background... 9
The survey in brief... 10
Sampling and response rates ... 10
Mode of survey... 11
Data processing ... 12
Reading this report... 12
Statistical differences ... 13
Chapter 2: Great Britain and the UK ... 14
Key UK facts ... 14
Summary of the main findings in Great Britain... 16
Route into an Apprenticeship ... 16
Apprentice Pay... 17
Apprentices’ contracted working hours ... 18
Overtime... 18
Training received... 18
Starting on an Apprenticeship and hours worked ... 19
Routes into Apprenticeships ... 19
Number of hours contracted to work ... 22
Off-the-job training ... 25
On-the-job training ... 26
Pay rates ... 28
Apprentices’ basic pay ... 28
Tips from customers... 34
Bonuses ... 35
Course impact on pay ... 35
Overtime... 35
Paid overtime ... 37
Unpaid overtime ... 38
Time off in lieu or flexi leave... 39
Other work... 40
After Apprenticeships ... 40
Chapter 3: England ... 44
Key facts in England ... 44
Summary of the main findings in England... 46
Routes into Apprenticeships ... 47
Apprentice Pay... 47
Apprentices’ contracted working hours ... 48
Overtime... 48
Training received... 49
Starting on an Apprenticeship and hours worked ... 50
Routes into Apprenticeships ... 50
Number of hours contracted to work ... 52
Off-the-job training ... 55
On-the-job training ... 56
Pay rates ... 58
Basic pay from employer... 58
Tips from customers... 62
Bonuses ... 63
Education Maintenance Allowance ... 63
Course impact on pay ... 63
Overtime... 64
Paid overtime ... 65
Unpaid overtime ... 67
Time off in lieu or flexi leave... 67
Other work... 68
After Apprenticeships ... 68
Chapter 4: Scotland ... 72
Key facts in Scotland... 72
Summary of the main Scotland findings... 74
Routes into Apprenticeships ... 74
Apprentice Pay... 75
Apprentices’ contracted working hours ... 75
Overtime... 76
Training received... 76
Starting on an Apprenticeship and hours worked ... 77
Routes into Apprenticeships ... 77
Participation in training... 80
Off-the-job training ... 81
On-the-job training ... 82
Pay rates ... 83
Basic pay from employer... 83
Tips from customers... 86
Bonuses ... 87
Course impact on pay ... 88
Overtime... 88
Paid overtime ... 89
Unpaid overtime ... 91
Time off in lieu or flexi leave... 91
Other work... 92
After Apprenticeships ... 92
Chapter 5: Wales... 94
Key facts in Wales... 94
Summary of the main findings in Wales... 96
Routes into Apprenticeships ... 96
Apprentice Pay... 96
Apprentices’ contracted working hours ... 97
Overtime... 97
Training received... 98
Starting on an Apprenticeship and hours worked ... 99
Routes into Apprenticeships ... 99
Participation in training... 101
Off-the-job training ... 102
On-the-job training ... 103
Pay rates ... 105
Basic pay from employer... 105
Tips from customers... 108
Bonuses ... 109
Course impact on pay ... 109
Overtime... 110
Paid overtime ... 110
Unpaid overtime ... 112
Time off in lieu or flexi leave... 113
Other work... 113
After Apprenticeships ... 114
Chapter 6: Northern Ireland ... 116
Key facts in Northern Ireland... 116
Summary of the main Northern Ireland findings... 118
Routes into Apprenticeships ... 118
Apprentice Pay... 118
Apprentices’ contracted working hours ... 119
Overtime... 119
Training received... 119
Starting on an Apprenticeship and hours worked ... 120
Routes into Apprenticeships ... 120
Participation in training... 121
Off-the-job training ... 122
On-the-job training ... 123
Pay rates ... 123
Basic pay from employer... 123
Tips from customers... 125
Bonuses ... 126
Course impact on pay ... 126
Overtime... 126
Paid overtime ... 127
Unpaid overtime ... 127
Time off in lieu or flexi leave... 127
Other work... 128
After Apprenticeships ... 128
Appendix A: Methodology ... 130
The survey in brief... 130
The research audience ... 130
Sampling approach ... 131
Mode of data collection ... 132
Response rates ... 133
Non-response and corrective weighting... 134
Appendix B: Apprentice Profile Data ... 136
Chapter 1: Introduction
Policy background
The Apprenticeship Pay study has been conducted twice before in England, most recently in 2007. Past surveys collected data on the pay levels, working hours and training of Apprentices and sought to understand differences by framework and by demographic variables such as gender and age. Two key factors were new to the 2011 survey: the introduction of a National Minimum Wage for Apprentices in October 2010; and the expansion of research to cover all four nations of the UK.
The study comes at a critical time for Apprenticeships in England as they are at the heart of the coalition Government’s strategic vision for economic growth. The Skills for
Sustainable Growth Strategy Document highlights that the UK is at least 15% less
productive than Germany, France and the US and that this weakness is particularly acute for the intermediate technical skills of the working population. The UK Government is also keen for the market to drive demand for skills training and for the cost to be shared
between public funds, the employer and the employee. Apprenticeship pay is an important component of this market and there are costs for all parties to consider. It is therefore crucial to have up-to-date information on the wages employers pay Apprentices.
Paying a lower wage than for a fully qualified worker while a person receives training is a long-standing principle of traditional Apprenticeships. In the UK there is an implicit contract that the individual learner is making a contribution to their human capital that will pay future dividends in terms of better pay and employment prospects on completion of their training. London Economics1 calculated that the lifetime benefit of achieving a Level 2
Apprenticeship was extra earnings between £48,000 and £74,000. The equivalent figure for a Level 3 Apprenticeship was between £77,000 and £117,000.
Since October 2010, employers now have to pay the Apprentice Rate to those apprentices aged between 16 and 18, or those aged 19 or older who are in their first year of training (£2.50 per hour at the time of the survey), recognising the significant contribution they make to the economy. There are some exceptions to this rule, notably programme-led Apprenticeships in England and Northern Ireland, where the apprentice is not employed and receives a training allowance.
Furthermore, a differential pay rate applies to Apprentices aged 19 and over after their first year of study (as shown in Table 1.1 overleaf). Apprentices between the ages of 19 and 20 in their second or subsequent year of study receive at least the Youth Development Rate of the National Minimum wage (£4.92 per hour at the time of the survey), and those apprentices aged 21 or older should receive at least the adult rate (£5.93 per hour at the time of the survey) after their first year.
1 London Economics (2011) Returns to Intermediate and Low Level Vocational Qualifications, Department
for Business Innovation & Skills, BIS Research Paper 53, Accessed 20/10/2011:
Table 1.1: Hourly pay rates for Apprentices in their second and subsequent years
Age 18 or younger 19 to 20 years 21 or older
Oct 2010 to Sept 2011 £2.50 £4.92 £5.93
Hourly
pay Oct 2011 to Sept 2012 £2.60 £4.98 £6.08
Prior research studies showed wide variations in pay by Apprenticeship framework. Unsurprisingly apprentices working in low pay sectors such as ‘Hairdressing’ and ‘Early Years Care’ earn relatively less than those in higher paid sectors such as ‘Engineering’. This raises gender issues as male and female employment differs by sector. For those on more advanced courses, there is a strong perception from employers that they have to offer over the going rate in order to attract the best candidates. The framework also dictates the amount of time an Apprentice spends on training outside of work, and Apprentices with more learning hours away from work often feel their lower wages are ‘fairer’ because working towards a qualification shows they are doing more than work alone.
The overall purpose of this survey is to provide factual data from which the pay levels of Apprentices can be understood. This will inform policy for BIS and partner organisations, such as the Low Pay Commission, which is responsible for recommending the minimum wage for Apprentices. For the Scotland, Wales and Northern Ireland governments, the survey represents an opportunity to robustly assess the pay and working hours of Apprentices in their country.
The survey in brief
The 2011 Survey of Apprentices’ Pay was administered to a random selection of Apprentices in England, Scotland and Wales (GB), and to all Apprentices in Northern Ireland.
In total, 11,020 Apprentices took part in the UK. As described in the overview below, the mode of the survey in Great Britain was different to that in Northern Ireland. For the former, a Computer Assisted Telephone Interviewing (CATI) method was used whereas the Northern Ireland survey was administered via a postal self-completion survey. Because of the large variance in response rate between the two methods, the resultant differences in bias and the difference between interviewer-led and self-completion modes, the data between Great Britain and the UK is not truly comparable. UK wide figures have been reported for specific critical questions on pay levels in Chapter 2; however these figures should be treated with some caution.
Sampling and response rates
Great Britain
suggests, there is considerable overlap between them. For example, ‘Retail’ is a very big framework in England (and subsequently the UK) but less sizable in Wales and Scotland. An ‘Other’ 12th category was also selected and a representative sample drawn outside of the top 11. What this means is that there was representation in this ‘Other’ category for larger frameworks such as ‘Plumbing’ in Scotland.
The GB survey sample was drawn from Apprentice records supplied by the Skills Funding Agency in England, the Department for Children, Education, Lifelong Learning and Skills in Wales and Skills Development Scotland. The audience was Level 2 and 3 Apprentices who were still on their course in April 2011. After an opt-out process, Ipsos MORI
attempted to contact 25,014 Apprentices. A total of 10,178 agreed to complete an 8 minute questionnaire about their pay and working hours. These interviews comprised 6,140 in England, 2,041 in Scotland and 1,997 in Wales. This represents an unadjusted GB response rate of 40.7%. After ineligible respondents and incorrect numbers are removed, the adjusted response rate was 51.9%.
Northern Ireland
The Department of Employment and Learning in Northern Ireland (DEL) is responsible for the data records of Apprentices under their jurisdiction. DEL did not hold specific
authorisation to either release Apprentice records to Ipsos MORI in order to draw a sample or supply contact details for the purposes of a telephone survey. Instead, a postal survey was administered by DEL to all current Apprentices listed on their records. A total of 10,723 postal surveys were sent to NI Apprentices, of which 842 were returned, representing a response rate of 7.9%.
Mode of survey
Great Britain
A CATI methodology was adopted for the GB element of the survey. CATI was by far the most cost-effective and efficient way of collecting reliable data given the sample size, the geographical distribution of the sample and the fact that a telephone number was included in the samples. Telephone mode is generally well established for surveys of learners and Apprentices, and was the approach used in earlier Apprenticeship Pay surveys. Fieldwork took place from 1 June to 31 July 2011.
A telephone random probability design requires a different methodology to a quota survey (which was run in 2007). The overall aim is to have a known outcome for every piece of sample loaded onto the CATI server which has several implications:
1. Each piece of sample should be called until an interview is achieved, a refusal given or information obtained to make a judgment on the eligibility of that contact.
2. Calls are not made indefinitely. In this case, numbers were called a maximum of 12 times after which the lead was labelled as unavailable and their eligibility assigned as unknown.
Northern Ireland
Ipsos MORI designed the NI questionnaire to match the wording of the GB telephone questionnaire as closely as possible. Nonetheless, taking into account that the NI survey was a self-completion methodology, some of the question ordering was changed so as to minimise the routing for respondents.
The final graphic-designed questionnaire was passed on to DEL, which was responsible for printing and mailing the survey to all 10,723 Apprentices on the database. In this way, Ipsos MORI did not handle the sample. Fieldwork overlapped with the GB telephone survey, with DEL despatching questionnaires on Friday 24 June. The cover letter asked respondents to return their surveys to a freepost address no later than 29 July 2011, though Ipsos MORI included all questionnaires received by 8 August in the final data, so as not to exclude any late returns.
For the data processing and weighting, where it was necessary to match each returned survey back to the profile of the respondent, DEL provided Ipsos MORI with an
anonymised dataset linking the serial number of each survey to the respondent’s gender, age, year of study, level of study and Apprenticeship framework.
Data processing
Comprehensive weighting to adjust for differential response rates was applied to the GB CATI data to principally correct for the disproportionate stratification by framework. Some response bias was also found in the data, so the weighting strategy also helped correct for this. Post-weighting, the effective base size for the whole GB survey was 3,554. For the individual nations, the effective base sizes were 2,963 in England, 1,125 in Scotland and 1,338 in Wales.
The same level of weighting was not possible for Northern Ireland due to the lack of profile data Ipsos MORI had access to and the mode of survey adopted. Limited profile data was available for some corrective weighting, which resulted in an effective base size of 653 for the Northern Ireland data. However, it is not possible to follow the same comprehensive GB weighting strategies in Northern Ireland. Because of the use of a different mode (postal) and different weighting strategies, UK level reporting has only been conducted on the key survey questions. The Northern Ireland data is not comparable with the data collected in GB. Ipsos MORI urge caution when considering any UK statistics derived from this survey.
The methodology comprising audience, sampling, mode of data collection, response rates and corrective weighting are discussed in more detail in the Appendices.
Reading this report
This report is structured to provide data at the UK/GB level and by each of the devolved administrations that compose the UK. Apprenticeship policy is an issue governed by each devolved administration (England, Scotland, Wales and Northern Ireland). The structure of the report reflects this by providing a separate chapter for each.
to finish. Instead, Chapter 2 should be read by those with an interest in Apprenticeship policy throughout the UK and Great Britain. This chapter highlights the key differences that were found between individual administrations comprising the UK. Chapter 3 to 6 have been written for those with an interest in a specific country of the Union.
Statistical differences
All differences referred to throughout this report are those which are statistically significant. The respondents who took part in this survey are only a sample of the total population of those who could have taken part, so we cannot be certain that the figures obtained are exactly those we would have if everybody had responded (the "true" values). We can, however, predict the variation between the sample results and the true values from knowledge of the size of the samples on which the results are based and the number of times a particular answer is given. The confidence interval chosen for this research was 95% - that is, the chances are 95 in 100 that the "true" value will fall within a specified range. This is a standard confidence interval for social research surveys.
Table 1.2 below illustrates the predicted ranges for different sample sizes and percentage results at the "95% confidence interval", assuming the “universe” to be infinite.
Table 1.2: Confidence limits for the survey data based on effective base sizes
Approximate sampling tolerances applicable to percentages at or near these levels Size of sample on which
survey result is based 10% or 90% 30% or 70% 50%
Effective base size +
%
+ %
+ %
UK: 3,684 responses 1 2 2
GB: 3,554 1 2 2
England: 2,963 1 2 2
Scotland: 1,125 2 3 3
Wales: 1,338 2 3 3
Northern Ireland: 653 2 4 4
Chapter 2: Great Britain and the UK
Key UK facts
The median rate of hourly pay received by Apprentices in the UK was £5.87 and £5.86 in GB. The mean was £5.83 per hour in the UK and £5.84 in Great Britain.
The median differed by country, with Apprentices in England receiving £5.83, those in Scotland £5.62 and those in Wales £6.30. Apprentices in Northern Ireland
received a median of £5.93 per hour. The mean rates by country were £5.80 per hour in England, £5.91 in Scotland, £6.62 in Wales and £5.70 in Northern Ireland. Statistical tests on mean pay values showed that significant differences existed by
country. Apprentices in Wales were paid a significantly higher hourly wage than those in other countries (£6.62 per hour). However, it is important to remember the profile of Apprentices within each country differs and this was a major factor
determining pay levels, especially in relation to framework, age and level of study. Median gross weekly pay in the UK and for Great Britain was £200. As with hourly
pay, median weekly pay differed between countries with Apprentices in Wales receiving the highest weekly median (£229), followed by Scotland (£219), and England and Northern Ireland (both £200).
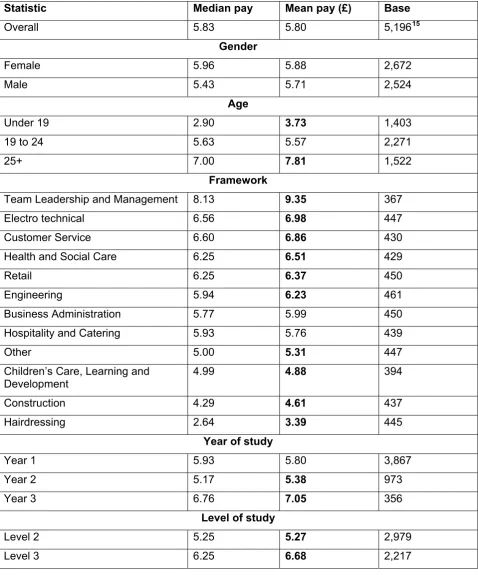
The key pay data for the UK and Great Britain is contained in the summary table overleaf. Statistically significant differences in the mean between different subgroups are highlighted in bold text. As not all Apprentices responded to
questions on pay, overall base sizes as less than the total number of participants. Across the UK, four in five Apprentices’ (79 per cent) contracted hours were 30 hours or more a week. Contracted hours cover both work and training. The mean Apprentice contract was 34 and a half hours per week. Apprentices in Scotland were contracted to work longer hours on average their counterparts in the rest of the UK – at over 37 hours a week. Five per cent of Apprentices said their contracted hours were less than 16 hours a week, which is lower than is allowed under
guidelines in England.
Nearly half of UK Apprentices (46 per cent) said they received off-the job training and over two thirds (69 per cent) received training on-the-job. Apprentices in Northern Ireland were the most likely to train off-the-job (56 per cent) and
Table 2.1: Summary gross hourly pay for the UK and Great Britain
Statistic UK GB
Median
pay (£) Mean pay (£) Base
2 Median
pay (£) Mean pay (£) Base
2
All 5.87 5.83 9,268 5.86 5.84 8,710
Gender
Female 6.00 5.93 4,680 5.98 5.93 4,418
Male 5.49 5.75 4,588 5.50 5.75 4,292
Age
Under 19 3.00 3.74 2,346 2.98 3.74 2,277
19 to 24 5.63 5.58 3,916 5.63 5.58 3,695
25+ 7.00 7.85 3,006 7.03 7.85 2,738
Framework
Team Leadership and Management3
8.33 9.57 668 8.33 9.58 629
Electrotechnical 6.60 6.94 794 6.67 6.99 745
Customer Service 6.73 6.92 728 6.74 6.92 717
Health and Social Care 6.30 6.57 790 6.30 6.56 705
Retail 6.25 6.36 750 6.25 6.36 723
Engineering 5.94 6.23 846 5.95 6.26 788
Business Administration 5.82 6.02 749 5.81 6.01 731
Hospitality and Catering 5.93 5.82 779 5.93 5.81 731
Other 5.00 5.34 915 5.00 5.35 759
Children’s Care, Learning and
Development 4 5.00 4.88 714 4.95 4.87 681
Construction 4.39 4.79 773 4.40 4.79 754
Hairdressing 2.64 3.38 762 2.64 3.39 747
Year of study
Year 1 5.93 5.82 6,289 5.93 5.82 5,951
Year 2 5.33 5.47 2,200 5.32 5.47 2,038
Year 3 6.76 6.97 779 6.76 6.98 721
Level of study
Level 2 5.34 5.32 4,725 5.32 5.31 4,458
Level 3 6.25 6.61 4,543 6.25 6.62 4,252
2 Base size is only those who answered questions on pay and hours. It excludes those saying they were not paid.
Apprentices in Great Britain who did some off-the-job training and were able to state an average said they completed just less than six and a half hours (6.4 hours for the UK) per week. Roughly double the amount (12.5 hours) was on average spent on on-the-job training. Apprentices in Scotland undertook far more off- and on-the-job training than those elsewhere in Great Britain, which is at least in part due to their different profile by framework and level. They spent over nine hours (9.7) a week training off-the-job and nearly seventeen hours (16.7) training on-the-job.
Apprentices in Northern Ireland also undertook more training spending seven and a quarter hours (7.2) a week training off-the-job and fourteen and a half hours (14.5) training on-the-job.
Seven in ten UK Apprentices worked for their current employer prior to enrolling on an Apprenticeship. In Wales, the figure was three quarters (75 per cent) of
Apprentices, which may partly explain the difference in pay noted earlier.
Summary of the main findings in Great Britain
For the reasons stated in the Methodology section, the findings in this section cover Great Britain.
Frameworks play a key role in shaping Apprentice Pay and working conditions in Great Britain. Overall, the findings presented in the main body of the report show a divide existed between two broad groups of frameworks: those that taught technical and/or practical manual skills such as the ‘Engineering’, ‘Construction’ and ‘Electrotechnical’ frameworks and those that focused on the service sector and/or transferable skills such as ‘Customer Service’, Business Administration’ and ‘Team Leading and Management’. Furthermore, Apprentices working on the ‘Hairdressing’ and ‘Children’s Care, Learning and Development’ frameworks were more likely to receive relatively low wages and work unpaid overtime.
Scotland stands out as having a different profile of Apprentices compared to other countries in the Great Britain (see the Profile Appendix). Over a third (35 per cent) of Apprentices in Scotland were studying on the technical/manual ‘Engineering’,
‘Construction’ and ‘Electrotechnical’ frameworks. In England, the proportion was 16 per cent and in Wales 19 per cent. Furthermore, nearly all technical/manual Apprentices in Scotland were on NVQ Level 3 equivalent courses whereas the distribution in England and Wales was closer to 60:40 in favour of Level 3 over Level 2. The difference in the profile of apprenticeships by framework and level across the administrations is what typically
accounts for the overall differences in both pay and conditions that were found between Scotland and other administrations.
Route into an Apprenticeship
Frameworks can be split into different categories based on what Apprentices were doing prior to enrolment. Seven in ten Apprentices were working for their employer before enrolling on an Apprenticeship, which indicates that employers were mostly investing in current staff rather than recruiting new workers. This is especially the case for the
on the service-focused frameworks of ‘Retail’, ‘Hospitality & Catering’, ‘Health & Social Care’ and ‘Customer Service’ were also much more likely to have worked for their employer prior to enrolling on an Apprenticeship.
However, the technical/manual Apprenticeships of ‘Engineering’, ‘Construction’ and
‘Electrotechnical’ are much more likely than others to contain Apprentices enrolling straight from school or college, as was the ‘Hairdressing’ framework.
Apprentice Pay
Although all Apprentices worked for an employer, five per cent of respondents said they did not receive any pay. This group is of particular concern and were more likely to be aged 18 or under (8 per cent), have a black and ethnic minority (BME) background (9 per cent) or study on a ‘Children’s Care, Learning & Development’ framework (14 per cent). At first glance, the one area that was atypical of the overall findings by framework was pay. Median and mean pay differed enormously across frameworks. At the top of the scale, median pay for GB Apprentices on the Team Leadership and Management framework was £8.33 per hour (the mean was £9.58) whilst at the bottom, Hairdressing Apprentices
earned a median of £2.64 per hour (a mean of £3.39). Nearly half of the ‘Hairdressing’ group earned below the minimum wage they should have received based on their year of study and/or age5. However, there are several other aspects linked to pay such as hours and overtime which do conform to the overall trend to difference between the
technical/manual frameworks and others focused on service occupations. We cover these in more detail later.
The pay data revealed other common themes. Four in five Apprentices received on or above the minimum amount they should get based on their year of study and/or age. The 20 per cent that did not were more likely to be aged 24 or under (26 per cent), and in their
second year of study (39 per cent). This is a strong indicator that the rules which dictate how much an Apprentice should earn are not understood by all employers, particularly that pay in the second year of an Apprenticeship increases from the Apprentice Rate of the NMW to the relevant age-related rate for those apprentices aged 19 or older.
Twelve per cent of Apprentices said they received tips. As might be expected,
‘Hairdressing’ and ‘Hospitality & Catering’ Apprentices were more likely to receive tips (79 per cent and 37 per cent respectively). Given their low levels of pay, there is a potential danger that ‘Hairdressing’ Apprentices’ wages are still being topped up by tips which
should not happen after changes to the NMW legislation in 2009. A quarter (24 per cent) of all Apprentices that received a wage less than the minimum they should due to their age and/or year of study received tips. In the case of ‘Hairdressing’, the proportion working for below their minimum wage who received tips was 85%.
A quarter (26 per cent) of all Apprentices received bonuses from employers, and these were particularly common in ‘Retail’ (47 per cent) and ‘Engineering’ (45 per cent). Bonuses were also more likely for Apprentices earning more than the adult NMW at the time of the study (£5.93 per hour).
Apprentices’ contracted working hours
Under course guidelines in England, Apprentices are expected to be employed for at least 30 hours per week. Part-time Apprenticeships of between 16 / 21 and 29 hours are
permitted in cases where it is difficult for individuals to commit full time, such as where an Apprentice has childcare or caring duties. England and Wales permit part-time
Apprenticeships between 16 and 29 hours, whereas the minimum in Northern Ireland is 21 hours. Scotland has no rules governing the minimum hours for an Apprenticeship. In Scotland and Wales, Apprentices should have a maximum contract of 40 hours per week. In four out of five (81 per cent) cases, Apprentices were contracted for 30 hours or more and 15 per cent of Apprentices worked part-time. Apprentices in Scotland were more likely to be full time (91 per cent) as were those on the technical/manual frameworks (all at least 93 per cent).
This left five per cent who worked 15 hours or less. This latter group were more likely to be aged 18 years or less (8 per cent), from a BME background (7 per cent) women (6 per cent) and to be training on ‘Children’s Care, Learning & Development’ (9 per cent) and Retail (9 per cent) frameworks. These significant differences closely match with those more likely to receive no pay noted above.
Overtime
Over half (54 per cent) of Apprentices worked overtime. It was common across all
frameworks and with older Apprentices studying at a higher level and in later years of their training. The average amount spent on overtime, amongst those who did some and were able to state an average, was six hours a week. Those who were working for their current employer prior to enrolling on an Apprenticeship were more likely to do more overtime as were Apprentices on the following frameworks: ‘Health and Social Care’ (9.2 hours),
‘Hospitality & Catering’ (7.8 hours), ‘Team Leading & Management’ (7.3 hours) and ‘Retail’ (6.7 hours).
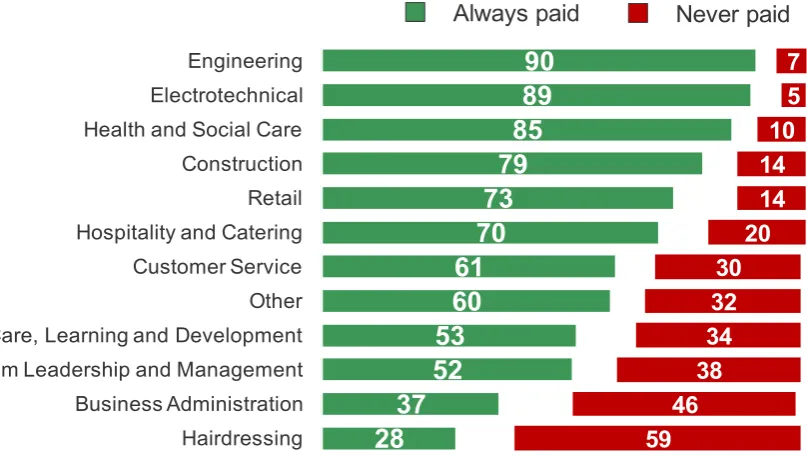
The figures by framework for those who do and do not get paid for overtime were also revealing. Apprentices on technical/manual frameworks tend to get paid whereas those on ‘Business Administration’ and ‘Hairdressing’ rarely get paid. The situation for
‘Hairdressing’, in which nearly three in five are ‘never paid’ for overtime, is concerning given the low wages these Apprentices command.
Training received
Furthermore, there is a close link between the group not recognising off- or on-the-job training and framework. As identified earlier, Apprentices on service-focused frameworks were more likely to have worked for their current employer before enrolling on an
Apprenticeship. Apprentices on these frameworks were also the ones more likely to do neither off- nor on-the-job training. Around a third of Apprentices on ‘Retail’, ‘Customer Service’ and ‘Team Leading & Management’ frameworks fell into this group. In
comparison, less than one in ten Apprentices on technical/manual frameworks said they received neither off- nor on-the-job training.
Those receiving training were asked about the average hours per week they spent doing it. Overall, Apprentices spent twice as long training on-the-job (just over twelve and a half hours per week) compared to off-the-job (just under six and a half). Indeed, GB
Apprentices on these frameworks spent most of their working week training, as shown in the table below. Apprentices in Scotland spent more time training than those in England and Wales and those in technical/manual apprenticeships spent the most of all the frameworks.
Table 2.2: Training mix for technical/manual Apprentices in Great Britain
Mean time spent training
Off-the job On-the-job Total
Mean contracted hours
Engineering 9.1 21.0 30.1 37.4
Construction 11.8 22.0 33.8 38.0
Electrotechnical 8.4 20.3 28.7 38.8
This chapter continues by providing detailed analyses of the findings for Great Britain, taking into account features of apprenticeship schemes that were specific to the country.
Starting on an Apprenticeship and hours worked
Routes into Apprenticeships
Although seven in ten GB Apprentices worked for their employer before starting their Apprenticeship6, there was significant variation between country and framework.
Apprentices in Wales were more likely to have worked for their employer prior to enrolment (75 per cent) compared to all GB Apprentices.
The variation by framework in the proportion of Apprentices working for an employer prior to enrolment was marked. This ranged from nearly all (99 per cent) of ‘Team Leading & Management’ Apprentices to less than half (47% per cent) of those enrolled on an
6 The 2009 National Employer Skills Survey (England only) showed a quarter of employers only offer Apprenticeships to new recruits whereas 11 per cent offer mainly to new recruits. This left 60 per cent of employers whose Apprentice intake comprised at least half of existing staff. UKCES (2010) National Employer Skills Survey for England 2009: Main report. Evidence report 23, (p.209). Accessed 21/11/2011:
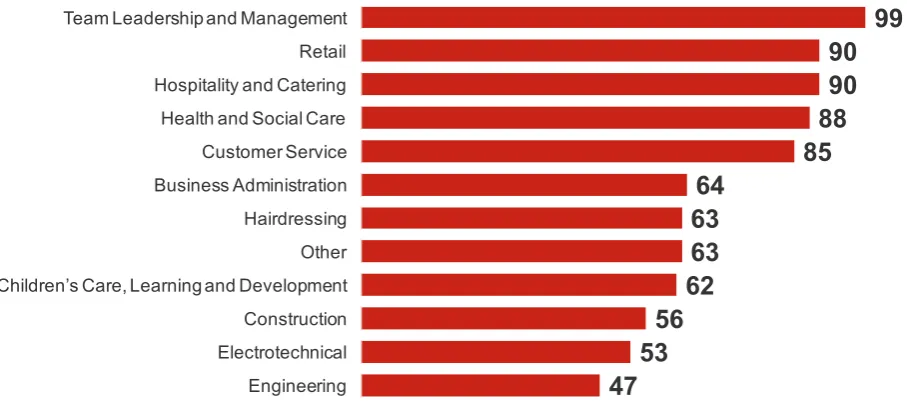
Engineering framework. As shown in Figure 2.1, there is a clear step between some of the ‘service’ frameworks such as ‘Retail’ and ‘Customer Service’ and others which show a different recruitment pattern. This group of Apprentices were much more likely to have worked for their employer prior to starting their Apprenticeship.
Figure 2.1: Proportion of GB Apprentices working for their current employer prior to starting their Apprenticeship (%)
99 90 90 88 85 64
63 63 62 56 53 47 Team Leadership and Management
Retail
Hospitality and Catering
Health and Social Care
Customer Service
Business Administration
Hairdressing
Other
Children’s Care, Learning and Development
Construction
Electrotechnical
Engineering
Base: All (10,178) GB Apprentices, 1 June to 31stJuly 2011
When analysed by other factors, it was found that women were more likely than men to have worked for their employer prior to enrolment (78 percent versus 62 per cent of men). As would be expected, age also played a part as those 18 years old or younger were far less likely to have been employed before starting their Apprenticeship. Of this age group, 45 per cent worked for their employer prior to enrolment compared to 65 per cent of 19 to 24 year olds and 94 per cent of those aged 25 or more.
Three in ten Apprentices (30 per cent) were not working for their employer before starting the course. Figure 2.2 shows that among this group, over half (56 per cent) said they were doing a course in school or college; close to three in ten (28 per cent) were working for a different employer; and 14 per cent were unemployed.
Figure 2.2: Apprentices not working for their employer prior to starting their Apprenticeship, by country
2% 2% 2% 3%
14% 15% 8% 8%
56% 56%
60% 51%
28% 27% 29%
37%
0% 10% 20% 30% 40% 50% 60% 70% 80% 90% 100%
Other Unemployed Doing a course Working for a different employer
Base: All Apprentices not working for an employer before enrolment (2,911), 1 June to 31stJuly 2011
Table 2.3: Apprentices in Great Britain not working for their employer prior to starting their Apprenticeship by framework and age
Routes to Apprenticeships Base
size Doing a course in a school or college
Working for a different employer
Unemployed
% % %
Overall 2,911 56 28 14
By Framework
Hairdressing 302 68 24 7
Engineering 484 68 24 6
Construction 382 59 29 11
Electrotechnical 397 58 33 8
Children’s Care, Learning and Development
306 57 29 11
Other 338 57 25 16
Hospitality and Catering 80* 55 30 9
Business Administration 322 44 27 26
Customer Service 110 40 30 27
Retail 75* 40 30 22
Health and Social Care 101 31 47 16
By age
Under 19 years of age 1,292 74 16 10
19 to 24 years of age 1,399 50 31 17
25 years of age or more 220 4 62 18
Note: The framework ‘Team Leading and Management’ has been excluded from this table because of small base size. Asterisk (*) means that the base size is small so results should be treated with caution. Bolded text shows Apprentices in that sub-group were more or less likely than average to fall under each route.
Number of hours contracted to work
Apprentices were asked the number of hours a week they were contracted to work
(including time spent training) by their employer, excluding meal breaks and any overtime. As shown in Figure 2.3 overleaf, 5 per cent of Apprentices said they worked fewer than 16 hours, which is lower than Apprentices technically should in England7.
The figure for the UK as a whole was also 5 per cent.
Figure 2.3: Number of hours contracted to work by Apprentices in Great Britain
5%
4%
6%
5%
9%
38%
26%
5%
2%
0%5% 10% 15% 20% 25% 30% 35% 40%
1-15 16-19 20-24 25-29 30-34 35-39 40-44 45-49 50+
Contracted Hours
Base: All (10,178) GB Apprentices ,1 June to 31stJuly 2011
In Great Britain, Apprentices contracted for fifteen hours or less were statistically more likely to be enrolled on ‘Children’s Care, Learning & Development’ and ‘Retail’ frameworks (both 9 per cent, compared to 5 per cent overall). Overall, these two frameworks were also:
Much more likely than others to offer part-time Apprenticeships on contracts lasting 29 hours a week or less (33 and 51 per cent respectively compared to 20 per cent overall);
Both enrolled far more women than men (96 per cent and 74 per cent respectively). Overall, women were more likely than men to have part-time Apprentice contracts
(29 per cent versus 10 per cent).
These figures show a gender divide in contracted hours which affected some frameworks more than others and is reflected in the rules governing who can do an Apprenticeship part time in England8. It also suggests women were more likely to be affected by employers incorrectly applying the rules governing the number of contracted hours an Apprentice should work, as they form a greater part of the group working less than 16 hours. However, analysis of the pay versus hours worked revealed a number of statistically
significant differences (Table 2.4 overleaf). The mean salary for Apprentices who said their contracted hours were less than 16 hours per week was £8.60 per hour. This fell to £6.09
per hour for those working between 16 and 29 hours a week and £5.66 for those who said they were contracted for 30 hours or more. Median pay also differed by contracted hours, which are also shown in Table 2.4.
Table 2.4: Mean and median pay by contracted hours in Great Britain
Contracted hours Less than 16 hours 16 to 29 hours 30 hours or more
Base 352 1,315 7,596
Mean hourly pay £8.57 £6.10 £5.66
Median hourly pay £6.42 £6.04 £5.63
Seven per cent of Apprentices said they were contracted to work for 45 hours or more. These were more likely to be male (9 per cent) and study ‘Hospitality & Catering’ or
‘Electrotechnical’ frameworks (13 per cent and 11 per cent respectively). Twelve per cent of those earning below the national minimum wage they should receive were also working over 45 hours per week.
Participation in training
Apprentices were asked whether they had taken part in any off-the-job or on-the-job training as part of their course. The new Specification of Apprenticeship Standards for England (SASE) indicates that the criteria for guided learning hours (GLH) at Intermediate and Advanced level are the same9; there is a minimum of 280 GLH of which 100 must be
delivered away from the workplace.
Off-the-job training was defined for them as training away from their everyday work and which could include courses, workshops, training sessions, distance learning, workbooks, CD-ROMs, etc. In addition, off-the-job training could still be conducted at the place where they worked, but would be away from their everyday work area. On-the-job training was defined as training where someone provided advice,
showed them how to do something or coached them whilst they were doing their everyday work.
As shown in Figure 2.4 overleaf, a third (35 per cent) took part in both types of training; the same proportion in on-the-job training only (34 per cent); and one in ten (11 per cent) in off-the-job training only. Two in ten (20 per cent) apprentices said they received neither of these types of training. The latter group receiving neither on- nor off-the-job training were more likely to be first year Apprentices (24 per cent).
Figure 2.4: Proportion of GB Apprentices receiving on- and off-the-job training
35%
34%
11%
20%
Doing on- and
off-the-job training
On-the-job training only
Base: All (10,178) GB Apprentices ,1 June to 31stJuly 2011
Off-the-job training
only
Neither on- nor
off-the-job training
Apprentices in Scotland were less likely than those from other countries to receive neither on- nor off-the-job training (14 per cent), and more likely to receive both types of training (40 per cent) This provides a picture of different training methods in each country and is a reflection of the different composition by framework in each.
Off-the-job training
Forty six per cent of Apprentices in Great Britain received off-the-job training overall. Those in Wales (50 per cent) and Scotland (49 per cent) were more likely to have access to such training compared with their counterparts in England (46 per cent). Frameworks that demanded more technical or specific skills were more likely to offer off-the-job training. These frameworks were: ‘Children’s Care, Learning and Development’ (59 per cent), ‘Electrotechnical’ (58 per cent), ‘Engineering’ (57 per cent), ‘Health and Social Care’ (52 per cent), ‘Construction’ (51 per cent), ‘Hairdressing’ (51 per cent) and ‘Other’ (52 per cent). This suggests that the training for these frameworks was typically more structured than for others, especially ‘Retail’, ‘Customer Service’ and ‘Hospitality & Catering’ all of which, as illustrated in Figure 2.5, were far less likely to include off-the-job training.
Men and younger Apprentices were more likely to take part in off-the-job training. Half (50 per cent) of the men surveyed across Great Britain did this form of training compared to 42 per cent of women. Nearly half of Apprentices aged 18 or under (48 per cent) and aged 19 to 24 (49 percent) took part in off-the-job training compared to 41 per cent of
Apprentices aged 25 or more.
Figure 2.5: Proportion of GB Apprentices who undertook off-the-job training (%)
59 58 57 52 52 51 51 40
38 32 31 23 Children’s Care, Learning and Development
Electrotechnical
Engineering
Health and Social Care
Other
Construction
Hairdressing
Team Leadership and Management
Business Administration
Hospitality and Catering
Customer Service
Retail
Base: All (10,178) GB Apprentices, 1 June to 31stJuly 2011
On-the-job training
Seven in ten (69 per cent) Apprentices were offered on-the-job training, though this
masked differences across countries. Close to eight in ten Apprentices in Scotland (78 per cent) received on-the-job training, compared with 69 per cent of those in England and 63 per cent of those in Wales.
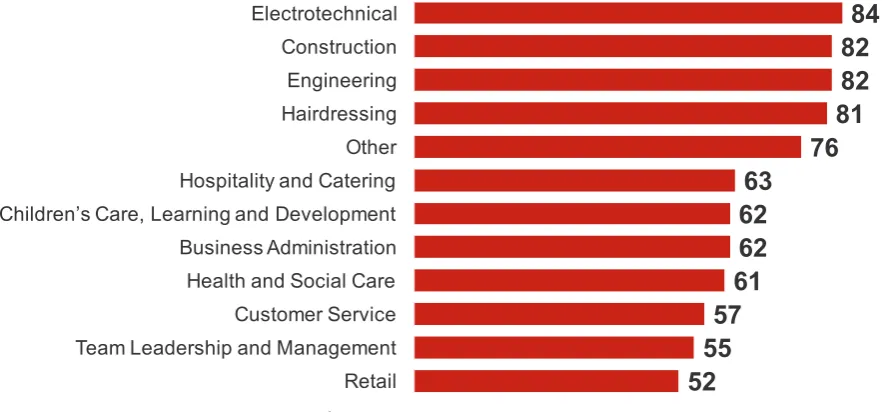
Apart from ‘Health and Social Care’ and ‘Children’s Care, Learning and Development’, frameworks that offered more off-the-job training were also more likely to offer training on-the-job, as demonstrated by the experience of Apprentices in the ‘Electrotechnical’ (84 per cent of apprentices received on-the-job training), ‘Construction’ (82 per cent), ‘Engineering’ (82 per cent), ‘Hairdressing’ (81 per cent), and ‘Other’ (76 per cent) frameworks.
As with off-the-job training, men and younger Apprentices were more likely to undertake training on-the-job. Over three quarters (76 per cent) of the men surveyed did this form of training compared to 62 per cent of women. Similarly, 77 per cent of Apprentices aged 18 or under and 74 per cent of those aged 19 to 24 took part in off-the-job training compared to just 56 per cent aged 25 or more.
Figure 2.6: Proportion of GB Apprentices who undertook on-the-job training (%)
84 82 82 81 76 63 62 62 61 57 55 52 Electrotechnical
Construction Engineering Hairdressing Other Hospitality and Catering Children’s Care, Learning and Development Business Administration Health and Social Care Customer Service Team Leadership and Management Retail
Base: All (10,178) GB Apprentices , 1 June to 31stJuly 2011
What the overall figures show is that training, whether off- or on-the-job, is more integral to some frameworks than others. Frameworks with strong theoretical and/or technical
[image:27.595.74.516.163.369.2]elements were more likely to be offering dedicated training compared to those covering predominantly service occupations such as ‘Retail’, ‘Customer Service’ and ‘Business Administration’. Indeed, Apprentices on these frameworks were more likely to say they received no training as described in the questionnaire, as illustrated in Figure 2.7 below.
Figure 2.7: Proportion of GB Apprentices not receiving on- or off-the-job training (%)
39 34 32 29 25 21 19 13 10 10 9 9 Retail
Customer Service Team Leadership and Management Hospitality and Catering Business Administration Health and Social Care Children’s Care, Learning and Development Other Hairdressing Electrotechnical Engineering Construction
Pay rates
Apprentices’ basic pay
In the UK, 85 per cent of participants provided details on pay and hours and in Great Britain, 86 per cent of respondents provided these details. The proportion of participants providing details varied between countries. In Scotland and Wales, 88 per cent of
Apprentices provided details of pay and hours. This reduced to 85 per cent in England, falling to 68 per cent in Northern Ireland.
Almost all Apprentices across Great Britain (95 per cent) received pay from their
employers, and the proportion rose to 97 per cent in Wales. This compares favourably with the 12 per cent of Apprentices in England not receiving any pay in the 2007 pay survey10.
The figure for the UK as a whole was also 95 per cent.
Some groups of Apprentices were more likely to be unpaid, notably those aged 18 or under (8 percent compared to 5 per cent overall in the UK), BME Apprentices (9 per cent) and those on the ‘Children’s Care, Learning and Development’ framework (14 per cent). That over one in seven Apprentices on this framework said they did not get any pay is of clear concern although this is in part driven by Apprentices in England as 10 per cent on this framework said they were still receiving the Educational Maintenance Allowance. The amount of pay an Apprentice should receive is dictated by their year of study and their age. Regardless of age, all Apprentices are eligible for at least £2.50 per hour in the first year of their studies at the time this research was conducted. From year two onwards, the minimum amount an Apprentice can receive depends on their age. Those aged between 16 and 18 should receive at least the same amount – £2.50 per hour. Those aged
between 19 and 20 should receive at least the Youth Development Rate of the NMW, which was £4.92 during the period in question, and those aged 21 or more at least the adult rate of the NMW.
Details of pay were collected using two questions in which an Apprentice could state either gross or net pay in hourly, weekly, monthly or yearly amounts. The data was then
processed so a “per hour” amount was derived for every record giving a figure for pay and
a figure for the average number of hours worked per week where a per hour figure was not provided by the respondent. The detail of this calculation is provided in Appendix B. Note that Apprentices receiving no pay were excluded from this calculation and therefore all reporting on mean and median pay.
Among those who were paid and reported a wage figure, eight in ten (80 per cent) were paid their equivalent minimum wage or above (based on their age and/or year of study), leaving the rest (20 per cent) being paid below their minimum wage. The proportion of
10 BMRB (2008) Apprentice Pay: 2007 Survey of Earning by Sector. Department of Innovation Universities and Skills Report 08 05. Accessed 18/10/2011:
Apprentices paid under the minimum wage they should receive in the UK as a whole was also 20%.
Given that some error due to recall or rounding may exist in the data, a further calculation was undertaken in which a 10 per cent error margin was applied to the figures. This meant the threshold for whether an Apprentice was below their equivalent minimum wage was relaxed to, for example, £2.25 per hour rather than £2.50 per hour for first year
Apprentices. Using these figures, 15 per cent of GB Apprentices were still outside the revised thresholds.
Hourly pay rates
The mean gross hourly pay reported was £5.84 and median pay in Great Britain was £5.86 per hour. The mean gross hourly pay for Apprentices in Wales was the highest amongst the three countries (£6.62 versus £5.91 in Scotland and £5.80 in England). However, median pay did not follow this trend. Although Apprentices in Wales received the highest median pay (£6.30), Apprentices in Scotland recorded a lower median than those in England (£5.62 and £5.83 respectively). Median and mean pay rates are illustrated in Table 2.5 below.
The mean pay of Apprentices in the UK was £5.84 per hour. The median was £5.87.
Table 2.5: Percentile differences in pay across the UK, Great Britain and devolved governments
Percentile Nation
10th 20th 30th 40th 50th 60th 70th 80th 90th
Mean Base
UK 2.50 3.06 4.26 5.03 5.87 6.22 6.73 7.60 9.05 5.83 9,268
GB 2.50 3.06 4.26 5.01 5.86 6.24 6.73 7.61 9.07 5.84 8,710
England 2.50 3.00 4.21 5.00 5.83 6.20 6.70 7.50 9.00 5.80 5,196
Scotland 2.56 3.38 4.20 4.92 5.62 6.25 7.00 7.89 9.25 5.91 1,802
Wales 2.67 4.28 5.22 5.93 6.30 6.86 7.59 8.50 10.12 6.62 1,766
Northern Ireland
2.68 3.61 4.35 5.49 5.93 6.00 6.38 6.97 7.99 5.70 570
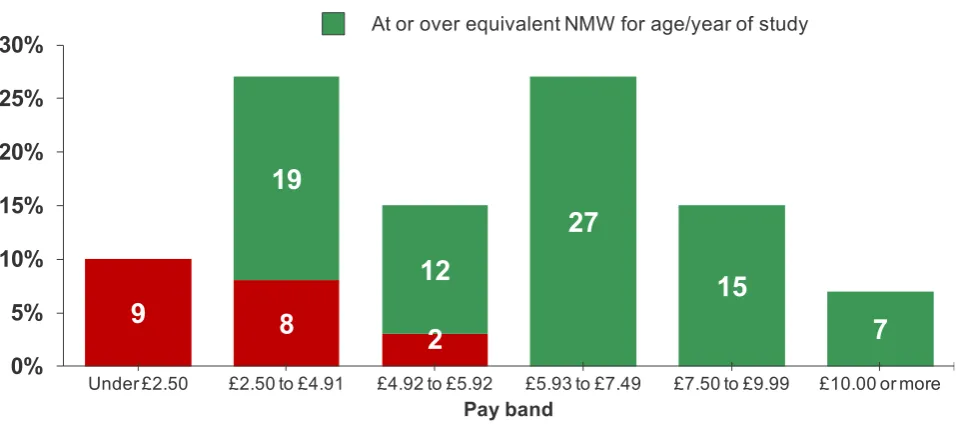
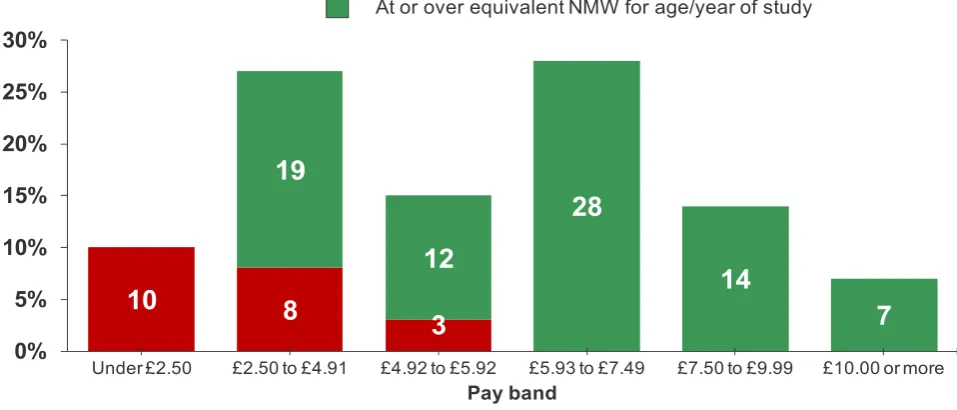
Figure 2.8: Apprentice Pay rates in Great Britain (%)
9
8
2
19
12
27
15
7
0% 5% 10% 15% 20% 25% 30%Under £2.50 £2.50 to £4.91 £4.92 to £5.92 £5.93 to £7.49 £7.50 to £9.99 £10.00 or more Pay band
Base: All those giving a wage figure (8,710) , 1 June to 31stJuly 2011 Total sums to 101 due to rounding
Under equivalent NMW for age/year of study At or over equivalent NMW for age/year of study
A more detailed view of pay is provided in Figure 2.9 below. As shown, two peaks of pay existed: between £2.50 and £2.99 per hour, and between £6.00 and £6.49. The
importance of the peak around £2.50 is that it corresponds with the minimum pay of first year Apprentices and so illustrates that this rate is used by some employers. Pay falls off with a very long “tail” after the £6.00 to £6.49 mark which is around the full national
[image:30.595.60.540.147.359.2]minimum wage level of £5.93 per hour at the time of the study. Nearly two-thirds (63 per cent) of Apprentices earned between £2.00 and £6.49 per hour.
Figure 2.9: Great British Apprentice pay rates in detail (%)
0.0 0.2 0.5 1.6
7.3 9.4
3.9 3.95.1
5.9 7.1 9.1
11.5
7.6
5.3 4.5
3.7 3.1 2.3
1.4 1.5 1.1 0.8 0.62.8 0% 2% 4% 6% 8% 10% 12% 14% Less t han £0. 50 £0. 50 t o £0. 9 9 £1. 00 t o £1. 4 9 £1. 50 t o £1. 9 9 £2. 00 t o £2. 4 9 £2. 50 t o £2. 9 9 £3. 00 t o £3. 4 9 £3. 50 t o £3. 9 9 £4. 00 t o £4. 4 9 £4. 50 t o £4. 9 9 £5. 00 t o £5. 4 9 £5. 50 t o £5. 9 9 £6. 00 t o £6. 4 9 £6. 50 t o £6. 9 9 £7. 00 t o £7. 4 9 £7. 50 t o £7. 9 9 £8. 00 t o £8. 4 9 £8. 50 t o £8. 9 9 £9. 00 t o £9. 4 9 £9. 50 t o £9. 9 9 £10. 00 t o £10. 49 £10. 50 t o £10. 99 £1 1. 00 t o £1 1. 49 £1 1. 50 t o £1 1. 99 £12. 00 or m or e Pay band
As might be expected, there was a close relationship between age and pay. Younger Apprentices were much more likely to be those receiving lower wages. The 16 to 18 age group composed 54 per cent of the £2.50 to £2.99 peak. In comparison, 19 to 24 year olds composed 51 per cent of the £6.00 to £6.49 peak, with those aged 25 or more forming 42 per cent.
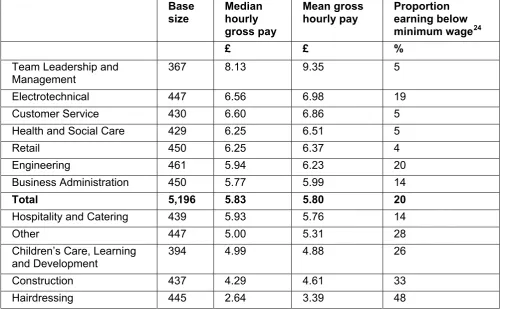
As shown in Table 2.6 overleaf, significant differences in pay existed between frameworks. Half of Apprentices in the ‘Hairdressing’ framework (48 per cent) were paid below
minimum wage (figures that exclude those who said they received no pay) and their mean gross hourly pay was £3.39, making them the worst remunerated group and mirroring findings for England in 2005 and 2007. Apprentices from the following three other frameworks were also more likely to be paid below minimum wage compared with
average: ‘Construction’ (31 per cent), ‘Other’ (28 per cent), and ‘Children’s Care, Learning and Development’ (26 per cent). Overall, Table 2.6 makes interesting reading as pay did not conform to the framework groupings discussed previously so technical Apprenticeships did not command higher wages than those aimed at service occupations. However, with the exception of ‘Construction’, female dominated frameworks did typically appear towards the bottom of the table for mean gross pay.
Table 2.6: Median and Mean wage and proportion above minimum wage by framework in Great Britain
Base
size Median gross pay (£)
Mean gross
hourly pay (£) Proportion earning below minimum wage11 (%)
Team Leadership and Management
629 8.33 9.58 4
Electrotechnical 745 6.67 6.99 19
Customer Service 717 6.74 6.92 5
Health and Social Care 705 6.30 6.56 5
Retail 723 6.25 6.36 4
Engineering 788 5.95 6.26 19
Business Administration 731 5.81 6.01 14
Total 8,710 5.86 5.84 20
Hospitality and Catering 731 5.93 5.81 14
Other 759 5.00 5.35 28
Children’s Care, Learning and Development
681 4.95 4.87 26
Construction 754 4.40 4.79 31
Hairdressing 747 2.64 3.39 48
Other areas of difference were considered in order to unpick some of the data by
framework. An analysis by gender within each framework showed that there were just two frameworks displaying statistically significant differences in pay between men and women. Men on ‘Health & Social Care’ frameworks were paid more than women (£6.94 per hour compared to £6.48). For ‘Business Administration’ frameworks, the opposite was true; women earned more than men (£6.23 versus £5.30). As no other statistical differences existed within framework, it can be inferred that the overall difference in pay by gender found in the survey was due to men working on different frameworks to women.
A quarter of those aged 24 or under (26 per cent) were paid below the minimum wage as were over a third of those in year 2 of their course (38 per cent). A quarter of those in subsequent years of their course (27 per cent) were also paid under their equivalent minimum wage. This suggests that some employers may have had some difficulty correctly interpreting the rules on Apprentice pay, especially as there were statistically significant peaks in those being paid under the minimum wages at age 19 and 21 (Figure 2.10 overleaf). When Apprentices reach these ages, the minimum amount of pay to which they are entitled changes.
Figure 2.10: Proportion of GB Apprentices paid under the minimum wage they should receive by age (%)
24
32 23
33 26
29 22
7
13
16 years old 17 years old 18 years old 19 years old 20 years old 21 years old 22 years old 23 years old 24 years old
Base: All those giving a wage figure (5,942 ), 1 June to 31stJuly 2011
Base
1,255
1,260
921
574
399
303 836 186
238
Analysis of pay by age within framework showed that earnings increased with age. As would be expected given the different rates of minimum pay by age, every framework displayed a statistically significant trend for pay to increase with age.
Indeed, in the case of the overall figures for Great Britain, Apprentices in their second year earned a lower mean and median pay than those in their first year.
Table 2.7: Median and Mean wage in Great Britain by year of study and prior employment
Worked for employer before started course?
Yes No Total
Gross hourly
pay (£) Gross hourly pay (£) Gross hourly pay (£) Base size Median Mean Median Mean Median Mean
First year 5,951 6.20 6.46 3.13 4.10 5.93 5.82
Second year 2,038 5.97 6.10 3.85 4.12 5.32 5.47
Third or subsequent year 721 6.89 6.99 6.76 6.97 6.76 6.98
Total 8,710 6.14 6.40 3.91 4.53 5.86 5.84
Similarly, Apprentices receiving on- and off-the-job training were more likely to receive a wage below their minimum. Around a quarter of Apprentices receiving either on- or off-the-job training were paid below the wage they should receive (26 per cent getting off-the-off-the-job and 23 per cent receiving on-the-job training). This is another indicator that employers may not be interpreting the rules correctly as Apprentices should be paid for their time training.
Low pay was also likely to disproportionately affect Level 2 Apprentices as 22 per cent were paid below their equivalent minimum wage.
Further advanced statistical analysis of the pay dataset (such as regression modelling, which is outside the scope of this report) is recommended to explore these issues in more detail.
Weekly pay rates
The core of the pay analysis uses hourly pay rates in order to compare the findings against the legal per-hour requirements laid out in Apprentice pay and NMW legislation. However, some analysis by weekly pay is also valuable, not least because the last Apprentice Pay report in England analysed pay this way12.
Weekly pay rates were calculated by multiplying the derived hourly pay rate by the number of hours worked per week, plus the number of hours spent on off-the-job training. Median gross weekly pay in Great Britain was £200 with mean weekly pay at £212.
Median gross weekly pay in the UK was also £200 with mean weekly pay at £212.
12 BMRB (2008) Apprentice Pay: 2007 Survey of Earning by Sector. Department of Innovation Universities and Skills Report 08 05. Accessed 18/10/2011:
Apprentices in Wales and Scotland received a mean of £241 and £235 gross per week respectively. Apprentices in England received £209 per week and those in Northern Ireland £215. This compares to mean gross pay in England in 2007 of £194 per week and a median of £188. The latest figures therefore represent a decline in real terms pay, although earlier caveats relating to the different survey methods should be noted13. The mean increased by 8% in England between 2007 and 2011, however, Retail Price Index (RPI) inflation was 14% over the same period. Mean and median gross weekly pay is summarised for each country in Table 2.8 below.
Table 2.8: Median and mean gross weekly Apprentice Pay by administration
Base size Median weekly gross
pay (£) Mean weekly gross pay (£)
UK 9,263 200 212
GB 8,710 200 212
England 5,165 200 209
Scotland 1,790 219 235
Wales 1,755 229 241
Northern Ireland 553 200 215
Tips from customers
Apprentices were asked whether they received any tips from customers in their work with their employer, and one in ten (12 per cent) said they did.
There were some expected differences by framework; those in ‘Hairdressing’ (79 per cent) and ‘Hospitality and Catering’ (37 per cent) were more likely to receive tips. Similarly, those aged 18 or under were twice as likely to receive tips compared to the GB average (23 per cent) which might partially explain why Level 2 Apprentices were more likely to receive tips than those studying at Level 3 (15 per cent compared to 8 per cent). Those receiving a wage below their minimum were also twice as likely to receive tips as the GB average (24 per cent). This last point may suggest that employers are using tips to top up the wages of Apprentices studying on low-paying frameworks, especially for those aged 18 or less. Since 2009, tips no longer count towards wages14. This may be one reason for the large number of Apprentices in the ‘Hairdressing’ framework being paid less than the wage they should receive, especially if employers are unaware of the change.
13 See page 45 which is the summary of the England Chapter 14
Since 1 October 2009, tips, gratuities, service charges and cover charges no longer count towards NMW pay. This is regardless of whether they are paid through your payroll or are given direct to workers by customers or a tronc master. Business Link:
Bonuses
A quarter (26 per cent) of Apprentices received bonuses in their work with their employer. Those in Wales (22 per cent) were less likely than Apprentices across Great Britain to receive bonuses. Gender and year of study were also factors in determining who received bonuses. Men (29 per cent) and those in year 2 (29 per cent) or year 3+ (33 per cent) were more likely to receive a bonus.
The payment of bonuses was largely a result of the incentive structure of the framework which Apprentices were in, with those in ‘Retail’ (47 per cent) and ‘Engineering’ (45 per cent) most likely to receive a bonus. Bonuses were especially rare in the following frameworks: ‘Children’s Care, Learning and Development’ (10 per cent), ‘Health and Social Care’ (10 per cent), and ‘Hospitality and Catering’ (17 per cent).
Finally, bonuses were also linked to overall pay as Apprentices earning above the Adult Minimum Wage of £5.93 were more likely to receive them (28 per cent compared to 26 per cent overall).
Course impact on pay
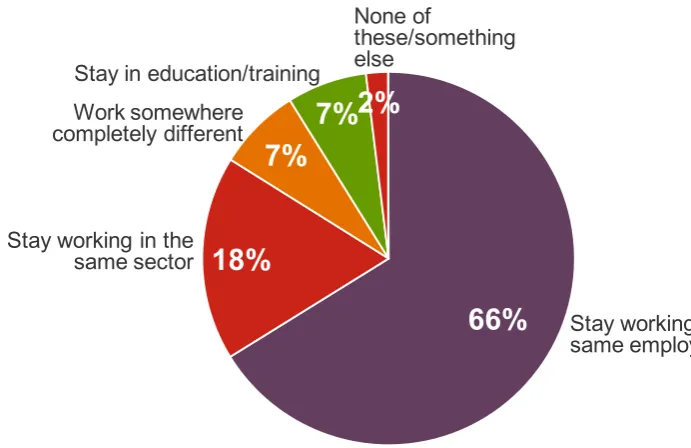
Apprentices who were working for their employer before starting their training were asked if their pay had increased, decreased or stayed the same as a result of starting the course and eight in ten (79 per cent) said that their pay stayed the same. Close to two in ten (18 per cent) saw an increase in their pay, and this rose to 23 per cent in Scotland. However, a small number of Apprentices (2 per cent) saw a fall in their pay and this was more likely in the ‘Hairdressing’ framework where four per cent of Apprentices reported a decline in their pay.
Overtime
Over half (54 per cent) of the Apprentices surveyed worked overtime, paid or unpaid, with their employer at some point.
Figure 2.11: Proportion of GB Apprentices working overtime by gross hourly pay
38%
44%
63%
61%
65%
61%
0% 10% 20% 30% 40% 50% 60% 70%
Under £2.50 £2.50 to £4.91 £4.92 to £5.92 £5.93 to £7.49 £7.50 to £9.99 £10.00 or more Pay bands
Base: All those giving a wage figure (8,710), 1 June to 31stJuly 2011
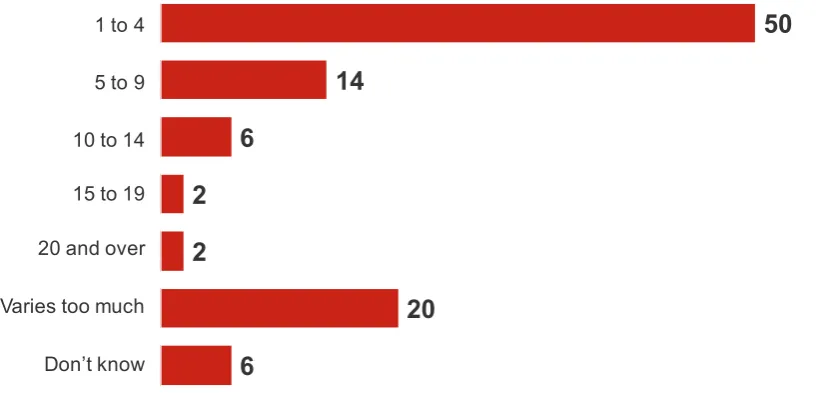
On average, if an Apprentice did overtime, they did so for 6.0 hours per week. The majority (65 per cent) worked under 10 hours overtime per week.
Figure 2.12: Number of hours working overtime per week by GB Apprentices (%)
40 25
11 3
4
16 3
Base: All who worked/are working overtime (5,492), 1 June to 31stJuly 2011
1 to 4
5 to 9
10 to 14
15 to 19
20 and over
Varies too much
Don’t know
Paid overtime
Among Apprentices who worked overtime, two thirds (66 per cent) were always paid, 8 per cent were sometimes paid and a quarter were never paid (25 per cent). This latter group were more likely to be women (30 per cent). There were also some differences by year of study as second years were much less likely to be paid overtime (30 per cent received no pay) compared to those in their third or subsequent year (12 per cent received no pay). As shown in Figure 2.13, there were also major differences by framework as to whether Apprentices were paid for their overtime. ‘Engineering’, ‘Electrotechnical’ and
‘Construction’ frameworks all appear within the top four of the chart as Apprentices on these frameworks mostly ‘always got paid’ for their overtime (90, 89 and 81 per cent respectively). In comparison, more Apprentices said they were ‘never paid’ than ‘always paid’ on both the ‘Business Administration’ and ‘Hairdressing’; 46 per cent and 59 percent respectively said they were ‘never paid’.
Figure 2.13: Proportion of GB Apprentices always paid and never paid for overtime by framework (%)
90
89
85
81
73
70
62
61
53
51
38
28
6
8
13
9
8
8
13
10
16
13
7 5 9 11 14 21 30 31 34 39 46 59 Engineering Electrotechnical Health and Social Care Construction Retail Hospitality and Catering Customer Service Other Children’s Care, Learning and Development Team Leadership and Management Business Administration HairdressingBase: All who worked/are working overtime (5,492), 1 June to 31stJuly 2011
Always paid Never paid
On average, those who were paid for overtime did 6.3 hours of paid overtime work a week. A third did between one to four hours (35 per cent), a quarter between five to nine hours (27 per cent), and 18 per cent worked over 10 hours. The rest (17 per cent) said the number of hours varied too much for them to say.
Looking at the findings by framework, ‘Health and Social Care’ (9.3 hours) and ‘Hospitality and Catering’ (7.7 hours) spent most hours on paid overtime on average. ‘Team Leading & Management’ Apprentices are also worthy of mention. Their mean hours were relatively high (6.8 hours a week) and Figure 2.13 shows only half of this group (51 per cent) were ‘always paid’ for their overtime.
Apprentices in Great Britain earned a mean of £7.75 an hour for paid overtime, and this differed by country. Apprentices in England earned significantly less for their overtime than the GB average (£7.64) whereas Apprentices in Wales and Scotland earned significantly more (£8.17 and £8.90 respectively).
The median overtime rate for Great Britain was £6.73 per hour and for each country, the median hourly rate was as follows: England, £6.64; Scotland, £7.79 and; Wales, £7.00. Mean payments for overtime followed the same pattern as payment for main job – those in the ‘Electrotechnical’ (£10.62), ‘Engineering’ (£9.48), ‘Team Leading and Management’ (£9.29) and ‘Customer Service’ (£8.26) frameworks received the highest mean pay for working overtime. Mean per hour pay for overtime was particularly low for Apprentices on ‘Hairdressing’ (£4.92) and ‘Children’s Care, Learning & Development (£5.63) frameworks. Median overtime pay followed the same trend ranging from £10.00 per hour for
Apprentices working on ‘Electrotechnical’ frameworks to £3.61 for ‘Hairdressing’. These variations also relate to gender as men commanded significantly higher overtime wages than women (a mean of £8.48 per hour versus £6.85). Men’s median overtime pay was also higher; £7.50 per hour compared to the £6.26 that women received. Overtime also increased with age rising from £6.08 per hour (median £5.50) for the under 19’s to £8.41 per hour (median of £7.00) for those aged 25 or more. Those in their third year also earned far more in overtime than average, earning a mean of £10.44 per hour (a median of £10.00).
Unpaid overtime
Figure 2.14: Number of hours doing unpaid overtime per week by GB Apprentices (%)
50 14
6 2 2
20 6
Base: All who worked/work any unpaid overtime (1,706), 1 June to 31stJuly 2011
1 to 4
5 to 9
10 to 14
15 to 19